Debug in mixed mode (C#, C++, Visual Basic)
This article describes how to enable debugging for managed and native code together, known as mixed-mode debugging. There are two mixed-mode debugging scenarios:
The app that calls a DLL is written in native code, and the DLL is managed.
The app that calls a DLL is written in managed code, and the DLL is in native code. For a tutorial that walks you through this scenario, see Debug managed and native code.
You can enable both managed and native debuggers in the calling app project's Property pages. The settings are different for native and managed apps.
If you don't have access to a calling app's project, you can debug the DLL from the DLL project. You don't need mixed mode to debug. You need only the DLL project. For more information, see How to debug from a DLL project.
Note
The dialogs and commands described in this article might differ from your experience, depending on your Visual Studio settings or edition. To change your settings, select Tools > Import and Export Settings. For more information, see Reset all settings.
Enable mixed-mode for native calling app (C++)
To enable mixed-mode debugging for a native calling app in C++, follow these steps:
In Visual Studio Solution Explorer, right-click the C++ project and select Properties, or use the Alt + Enter keyboard shortcut. The <Project> Property Pages dialog opens.
In the dialog, expand the Configuration Properties section and select the Debugging tab.
In the Debugging tab, select the Debugger Type property and use the dropdown list to select the Auto or Mixed option. If there are multiple options for Mixed, such as .NET Core and .NET Framework, choose the best option for your configuration.

To apply the property change, select OK.
Enable mixed-mode for managed calling app (C# or Visual Basic)
To enable mixed-mode debugging for a managed calling app in C# or Visual Basic, follow these steps:
In Visual Studio Solution Explorer, right-click the C# or Visual Basic project and select Properties, or use the Alt + Enter keyboard shortcut. The Properties pane opens.
In the Properties pane, enable mixed-mode debugging by setting the following property:
.NET code
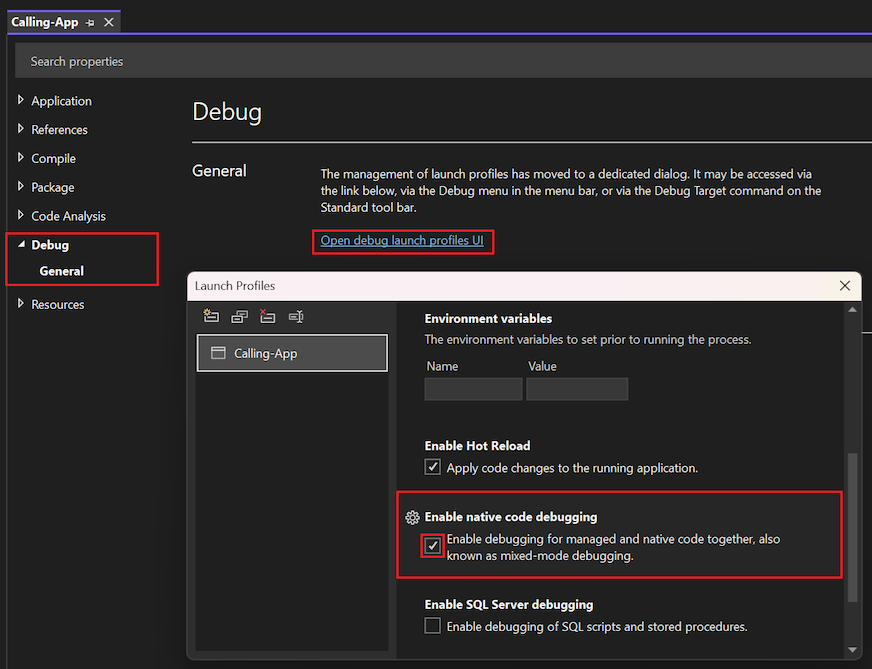
On the left menu, select Debug.
In the General section, select the Open debug launch profiles UI link. The Launch Profiles dialog opens.
In the dialog, scroll to locate the Enable native code debugging section.
Select the Enable debugging for managed and native code together, also known as mixed-mode debugging property:

To apply the property change, close the Launch Profiles dialog and the Properties pane.
.NET Framework code
If you're using .NET Framework code, which has no debug launch profile, follow these steps:
On the left menu, select Debug.
In the Debugger engines section, select the Enable native code debugging property:

To apply the property change, close the Properties pane.
On the left menu, select Debug.
In the Debugger engines section, select the Enable native code debugging property:

To apply the property change, close the Properties pane.
Note
For a .NET Core app in Visual Studio 2017 and Visual Studio 2019, you must use the launchSettings.json file instead of the project properties to enable mixed-mode debugging.