Not
Åtkomst till denna sida kräver auktorisation. Du kan prova att logga in eller byta katalog.
Åtkomst till denna sida kräver auktorisation. Du kan prova att byta katalog.
I recently came across a very interesting profiling tool that is available in Vista SP1 and Server 08 called the Windows Performance Analyzer. You can use this tool to profile and diagnose different kinds of symptoms that the machine is experiencing. This tool is built on top off the Event Tracing for Windows (ETW) infrastructure. It uses the ETW providers to record kernel events and then display them in a graphical format.
Performance Analyzer provides many different graphical views of trace data including:
- CPU Sampling
- CPU and Disk utilization by process and thread
- Interrupt service routine and deferred procedure call
- Hard faults
- Disk I/O Detail
What you will need
Download the latest version of the Windows Performance Tools Kit, and install it on your machine. (https://www.microsoft.com/whdc/system/sysperf/perftools.mspx : Windows Performance Tools Kit, v.4.1.1 (QFE)) You will need to find the toolkit that corresponds to your processor architecture. Currently there are 3 versions available i.e. X86, IA64, X64.
After installation you should be able to see 2 new tools. The first one is Xperf, which is a command line tool that is used to capture the trace. The second is called XperfView, which graphically interprets the trace that has been collected by Xperf.
You will need to run the Xperf and XperfView from an elevated command prompt for all functionality.
Starting a Trace
For many tasks all you need for effective analysis is a kernel trace. For this example, we'll use the –on DiagEasy parameter to enable several kernel events including: image loading; disk I/O; process and thread events; hard faults; deferred procedure calls; interrupts; context switches; and, and performance counters. From an elevated command prompt launch xperf –on DiagEasy.
This starts the kernel logger in sequential mode to the default file "\kernel.etl"; uses a default buffer size of 64K, with a minimum of 64 and a maximum of 320 buffers.
Stopping a Trace
To stop a trace, type xperf –d <filename>.etl at the command line. This will stop the trace and output the file.
Viewing a Trace
There are 2 ways to view the trace. From an Elevated Command prompt, launch xperf <filename>.etl, or
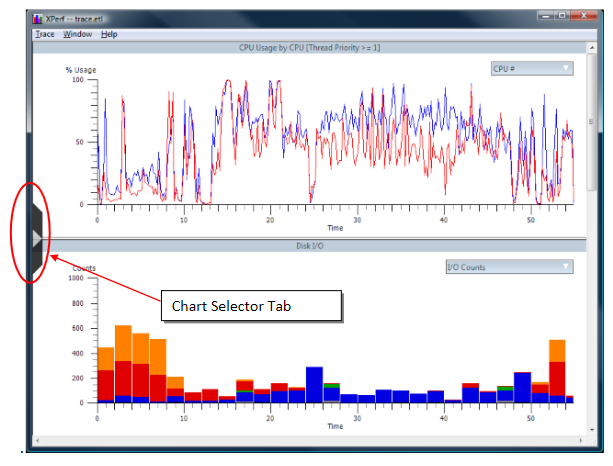
launch the XperfView tool and open the file manually. When you open the trace file, you should see something similar like this.
NOTE - While you need to run xperf from an elevated command prompt in order to record a trace you do not need an elevated command prompt in order to *analyze* a trace.

Using the Chart Selector tab, you can select all the graphs that you want to look at. To drill down in each chart, you can select the Summary table. For instance, in the CPU Sampling chart, the summary table gets you the summary of the processes that were running, with information like the amount of CPU time, CPU %, stacks (if the stacks were collected in the trace, see below). When looking at the Summary table for the Disk I/O chart, you can see which processes were writing files (the filename too!) to disk, as well as how much time it took.
You also have the ability to zoom in on a selected area. Another really cool feature is the ability to overlay multiple graphs on one frame. This way you can correlate different pieces of data together very easily.
Also, you select which counter instances you want to see in each specific chart. On the top right corner of each chart is a drop down box from where you can select the counter instances. For instance on the Disk I/O chart, you can select Disk 0, Disk 1, or a combination as well.
You can also view detailed information about the system that the trace was taken on. Click on the Trace menu item, and select System Configuration.
Xperf Kernel Flags and Groups
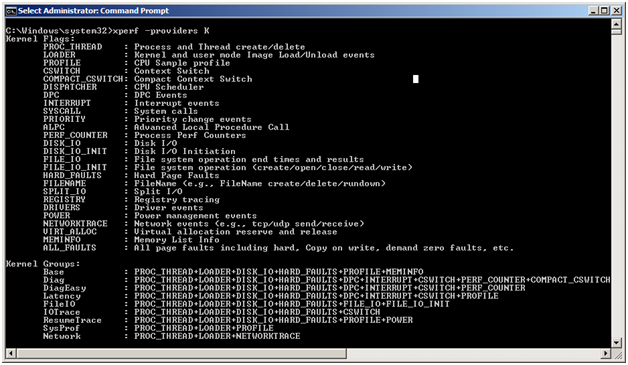
In the first sample Xperf command we ran, xperf –on DiagEasy. I am sure many of you were wondering what DiagEasy means. DiagEasy is a group of kernel events that are predefined by the Windows Performance Toolkit. This group includes Process, Threads, Kernel and User Image Load/Unload, Disk I/O, DPCs and Context Switch events.

When we used the xperf –on DiagEasy command, we did not specify an individual provider, so we enabled the kernel events for all the ETW providers on the system. If you want to enable events for a specific provider, you can the following format xperf -on: (GUID|KnownProviderName)[:Flags[:Level]] . For more information about ETW providers, Kernel Flags and Groups, you can run the xperf –help providers command.
Stack Tracing
One of the most powerful features in Performance Analyzer is the ability to visualize stacks. It's important to note that this requires no special instrumentation in the code – only that you have symbols for the binary components you are interested in analyzing.
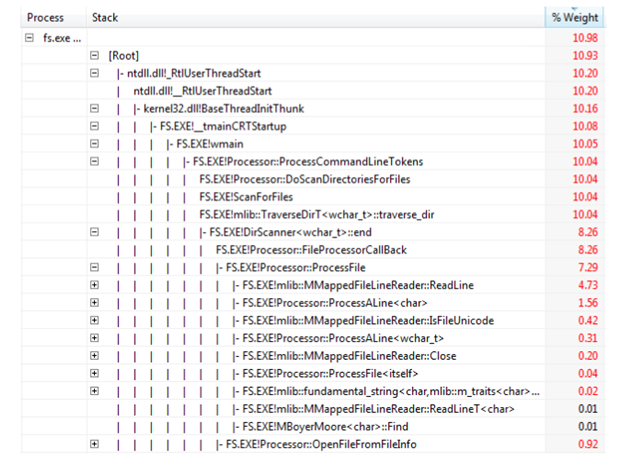
When the trace is setup to collect the stacks, Performance Analyzer will display call stack summary information for the events that had stack walking enabled. Here is an example that takes a trace (with stack tracing enabled) of the entire system while running a "find string" utility.. We can use the Stack Tracing feature of Xperf to record a stack when certain events happen, or take sample at regular intervals over time. See xperf –help stackwalk output for more info.
Below, we will use the Stack Tracking feature of Xperf to take stack samples at regular intervals. With this output, we will be able to determine where the CPU is spending most of its time within a process.
xperf -on latency -stackwalk Profile
Latency is the kernel group to enable certain events, including the profile event which records the CPUs' activity every millisecond. The "-stackwalk Profile" flag tells Xperf to record stack walks on every profile event, which makes the profile information much more useful. In other words, in order to get profile information with stack walks you need to turn on the profile event, and turn on stack walking for that event.
Note that decoding of stacks requires that symbol decoding be configured. However stacks can be recorded without symbols, and can even be viewed without symbols, although they are much less useful without symbols. I only mention this in the event you're trying to record a trace of a problematic machine with little time to mess around with _NT_SYMBOL_PATH.
To get a trace with the stack information, do the following:
- Run the command, xperf -on latency -stackwalk Profile.
- Run the application that you wish to analyze, then
- You can end the trace by using the regular xperf –d <filename>.etl command.
- Load the trace in the viewer and then select the Load Symbols from the Trace drop down menu.
- Once the symbols are loaded, select an interesting region on the CPU sampling graph.
- Right click and select Summary Table.
Click on the selector tab to bring up the column chooser list. Then select "Process name", "Process", "Stack", "Weight" and "%Weight". These are the most useful columns when looking at stacks from the sample profile event. You should get a view similar to this.

At this point I need to mention a few of the restrictions with stack walking coupled with when and how it works.
· Xperf stack walking is not available on XP
· On Vista stack walking is available for x86, and is available for x64 as of Vista SP1.
· On Windows 7 stack walking is available.
· Stack walking on x64 is complicated. You have to set DisablePagingExecutive in the registry, as documented here:
https://social.msdn.microsoft.com/Forums/en-US/wptk_v4/thread/282e5beb-0afd-411b-9a81-a0bbbf569dfe/
REG ADD "HKLM\System\CurrentControlSet\Control\Session Manager\Memory Management" -v DisablePagingExecutive -d 0x1 -t REG_DWORD –f
Sample Case
I recently came across a case where the customer was complaining that DPC processing was taking up too much CPU time. We ran Xperf on the machine and drilled down into the DPC activity on the machine.

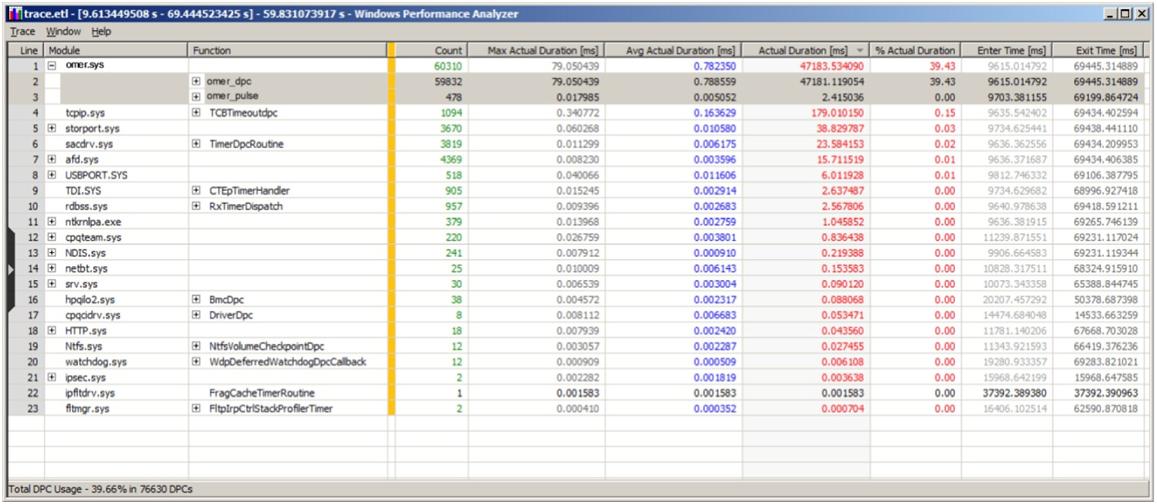
From the Xperf graph, I was able to confirm that the customer was actually seeing high DPC usage. I selected the Summary for this chart, and got the list of drivers that were actually taking up CPU time.

Right off the bat, I could identify the driver that had a lot of DPC activity. I also noted that the average duration for each DPC from that driver was taking 788 microseconds. This is way too high. Each DPC should be taking a maximum of 100 microseconds.
- Omer
Reference
Performance.Analyzer.QuickStart.xps – This is shipped with the performance toolkit.
From an elevated command prompt, launch xperf -help
https://www.microsoft.com/whdc/system/sysperf/perftools.mspx
https://blogs.gotdotnet.com/pigscanfly/archive/2008/02/16/using-xperf-to-take-a-trace.aspx
https://www.microsoft.com/whdc/Driver/tips/DPC_ISR.mspx
Comments
Anonymous
April 03, 2008
제가 visual studio 2008 performance work 할때 사용한 툴인데 Vista 하 에서만 제대로 작동하긴 하지만, 기존 VS profiling tool과는 비교Anonymous
April 04, 2008
Great article - didn't know about this tool, had written my own in mixed mode assemblies. This looks cool though - kudos.Anonymous
April 04, 2008
.NET Framework Design Studio Published Counting Processors in .NET: The Pros and Cons of Five DifferentAnonymous
April 04, 2008
.NETFrameworkDesignStudioPublishedCountingProcessorsin.NET:TheProsandConsofFiveDif...Anonymous
April 10, 2008
This reminds me of kernrate . .Anonymous
April 14, 2008
yep - similar to kernrate. Also, I could not get symbols to load with this tool, although they work with windbg and VS2008. JohnAnonymous
April 21, 2008
I have been very happy with my tablet once I scanned my fingerprint to "calm down" the fingerprintAnonymous
June 12, 2008
The comment has been removedAnonymous
February 27, 2009
Windows Performance Analyzer XperfAnonymous
February 27, 2009
Windows Performance Analyzer XperfAnonymous
April 05, 2010
The comment has been removedAnonymous
May 20, 2014
Regarding the DPC activity where the driver was taking 788 microseconds; what was the issue and solution? [The issue was that the driver was spending a lot of time in DPCs. Removing or updating the driver is usually a good solution.]Anonymous
September 06, 2014
The comment has been removedAnonymous
November 19, 2014
The comment has been removedAnonymous
April 15, 2015
Why it never wants to load the symbols from the given path? Pathetic. [Xperf works well with symbol paths. However, this tool is obsolete and you should use the improved WPA tool.]Anonymous
April 21, 2015
@stupidxperf if you use Windows 8.1, you must use the 8.1 SDK/WPT: msdn.microsoft.com/.../bg162891 .Using the xperf.exe 8.0 SDK/WPT doesn't include the ImageID/DbgID_RSDS eventswhich are used to get the correct symbols. @ntdebug xperf is still the best tool. Coding WPR profiles is a pain.