Not
Åtkomst till den här sidan kräver auktorisering. Du kan prova att logga in eller ändra kataloger.
Åtkomst till den här sidan kräver auktorisering. Du kan prova att ändra kataloger.
In yesterday's blog post, wrote a summary of the new support in .NET V4.6 for Activities. In particular it points you EventSource Activity Specification, which describes the feature in detail.
I explained why you should care (if you are instrumenting server applications, you care), and outlined the basics of using the feature.
In short, in a world of concurrent/asynchronous activities, it allows you to focus on all events that are related causally, ignoring all the other concurrent activity on the system. This is critical in server scenarios.
In this blog post I what to insure you have what you need to actually experiment with the feature. In particular I have posted demonstration code as an attachment to this blog. This is a ZIP file that contains
- Source code (A VS2013 solution) containing a trivial C# application that has an EventSource that defines some activities that nest inside each other.
- A build of that C# (so you can run it yourself event without Visual Studio)
- A PerfView.etl.ZIP file containing the events that you would have collected if you follow the instructions.
Thus you have everything you need to walk through the feature. The source code is really just a single C# file 'Program.cs that contains
- An EventSource with various 'Start' and 'Stop' events, that represent particular activities.
- A fictitious request processing code that includes asynchronous events, network activities, nested activities, and event 'bad' activities (that start but do not stop) to simulate real request processing code.
- A driver that runs 20 of these requests in parallel.
There is a Visual Studio 2013 .SLN and .CSPROJ file so to compile it you can simply
- Click on the EventSourceActivityDemo.zip link below. Click through the security prompt and open the ZIP.
- Drag the EventSourceActivityDemo directory inside the ZIP file to a location on your local drive
- Open the EventSourceActivityDemo\EventSourceActivityDemo.sln file in Visual Studio
- Build (F6).
If you don't have Visual Studio Handy, I have already built the EXE as EventSourceActivityDemo\bin\Debug\EventSourceActivityDemo.exe. If you wish you can simply run that.
To gather data you will need a current version (V1.8) of the PerfView tool. You can get this at the PerfView Download Location. The demo code tells you how to collect data, but I repeat it here
- Run PerfView /Providers=*Microsoft-Demos-Activities collect
- While it is running run the EventSourceActivityDemo.exe
- When complete, tell PerfView to stop collection
As a reminder you need to have .NET 4.6 installed on your machine. If you are on Win10 you have it, but otherwise see yesterday's blog post for details about checking if you have it and getting it if you don't have it.
The result is a PerfViewData.etl.zip file that PerfView can examine. If you wish you can skip this part too (e.g. you don't have V4.6 installed), as I have already collected that data and included it in the EventSourceActivityDemo.zip file. It is in the EventSourceActivityDemo\bin\Debug\PerfVIewData.etl.zip file Thus you need only open this file in PerfView (e.g. PerfView EventSourceActivityDemo\bin\Debug\PerfVIewData.etl.zip).
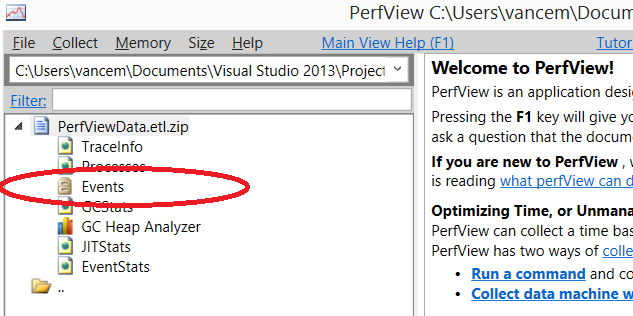
Once you have the PerfVIewData.etl.zip opened in PerfView, you will want to look at the 'events' view by double clicking on it.
This will bring up the EventViewer as show below. (I strongly suggest using the blue hyperlinks at the top to learn more about the view). By Shift Clicking events names from the left hand pane, you can select all the 'Microsoft-Demos-Activities events. You may also wish to set the columns of interest by clicking on the 'Cols' button on the right and picking the 'ThreadID' and 'ActivityID' columns. Then you can hit 'Enter' (or click the 'update' button), to see the events you have specified.
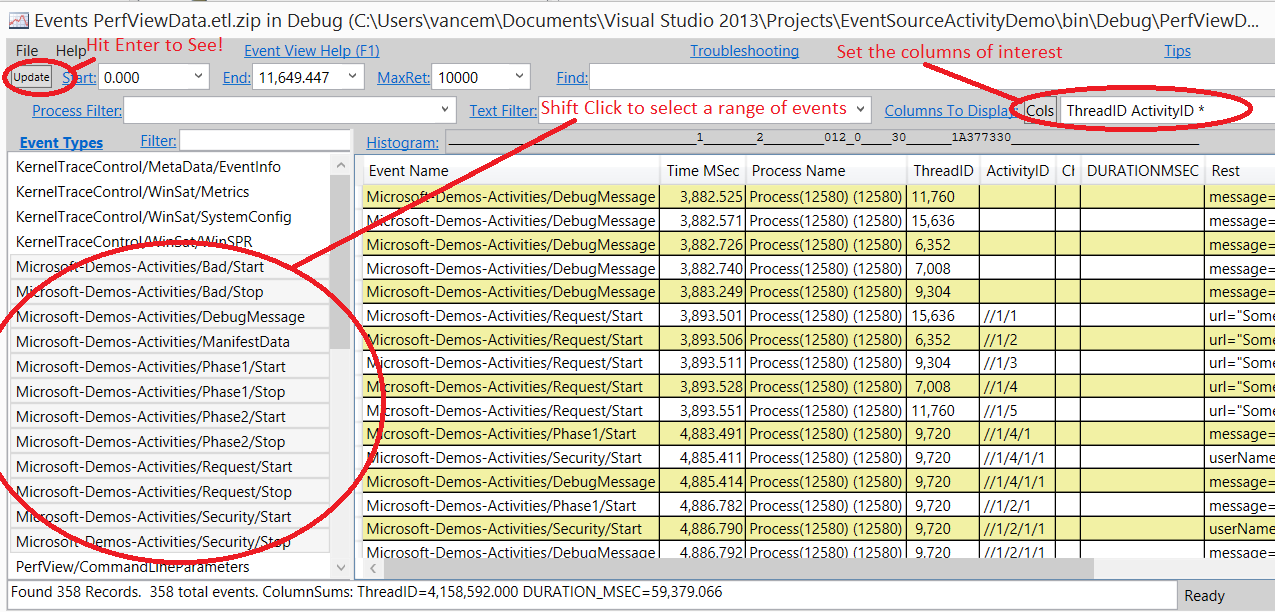
What you will see is al the events from the program in chronological order each tagged with an ActivityID like //1/4/1/1. You can use the 'TextFilter' text box to see only events that have the given text pattern so putting //1/4 in that text box and hitting <enter> will show you all the events that were associated with that activity (or any of its children activities).
There you have it. You and now repro what I showed you in the last post. As extra credit you can look at the 'StartStopTree' view to look at the events as a tree sorted by activity rather than as a chronological display.
Vance
Comments
Anonymous
September 15, 2015
Thank you for the interesting blog post. But how can I find the 'StartStopTree' view in the PerfView (version 1.8.0.0)?Anonymous
September 15, 2015
This is a good question. The StartStopTree will be one of the children of the .ETL.ZIP file in PerfView. However you will NOT see it in the ETL.ZIP I provided because, to keep the size small, I used special PerfView options to reduce the number of events collected to the point that PerfView does not believe it can render the start-stop tree. If you collect the data yourself (and thus the data will not be impoverished, you should see the StartStopTree child of the data file.Anonymous
September 25, 2015
I collected the data myself but the 'StartStopTree' child is not there... the events were successfully collected as I can see them in the 'Event' child. Are there any options I should enable while collecting?Anonymous
September 28, 2015
When you say that you collected it yourself. what precisely do you mean? Do you mean you collected it with something besides PerfView? Or do you mean that you collected it with PerfView, but with other options besides PerfView /Providers=*Microsoft-Demos-Activities collect. The StartStopTree in PerfView currently expects other events before it turns on (I believe it is looking for the TPL events). While this is probably not necessary, it is how it works today.Anonymous
September 28, 2015
The comment has been removedAnonymous
September 30, 2015
The comment has been removedAnonymous
October 05, 2015
@Thomas, @John, I just tried the steps you list above, namely using PerfView Version 1.8.0 do PerfView Providers=*Microosoft-Demos-Activities collect while running the demo app on machine with V4.6 (e.g Win 10). And open it. You should see a 'Any StartStopTree Stacks' view near the bottom of the list of views' I double clicked on this and I get a stack viewer where the nodes of the tree are the activities themselves and the 'leaves' of the tree are the events being logged. If you place your .ETL.ZIP file on http://1drv.ms/1xoq5bU I can take a look, but right now I don't have anything I can debug.Anonymous
October 06, 2015
Hi Vance and thanks for looking at this. I attached a zip file called NoStartStopView.zipAnonymous
October 06, 2015
OK, I found the problem. The StartStopTree feature was marked as experimental and thus does not work unless PerfView can validate that you are within Microsoft. This should have been removed a while a go. I have a prerelease (unsigned) version of PerfView 1.8.5 at http://1drv.ms/1jMRItA (It is PerfView.zip), if you care to try it out. Otherwise it will wait until the next release (probably a couple of months).Anonymous
October 06, 2015
I'm sorry but I don't see any file in this OneDrive folderAnonymous
October 07, 2015
Try http://1drv.ms/1Q7JmHl. It seems the previous link was invalidated for some reason. The file is called PerfView.zip and has a single EXE in in it.Anonymous
October 07, 2015
I confirm that I was able to download & test this new build... and it works! Amaising to see that such a nice & complex feature was hidden due to a simple if(...), hehe ThanksAnonymous
November 01, 2015
Hi Vance, I'm not sure if this is intended behaviour or a bug. When I change your code to dynamically define the EventSource the activity detection stops working. No "StartStopActivity" fields will be added to the events. If have changed your code " [EventSource(Name = "Microsoft-Demos-Activities")] public class MySource : EventSource { ... }" to " public class MySource : EventSource { public MySource() : base("Microsoft-Demos-Activities") { } ... }" The ActivityID on the other Hand are set to the correct path-like values. It's just the StartStopActivity that does not get set. Would be great if you could clarify if this should or should not work with dynamically named EventSources. Thanks a lot, MattiAnonymous
November 01, 2015
@Matthias Klöpp I could not reproduce the behavior you describe. I was able to make an example with two EventSources (one Dynamic and one with static Event definitions), and basically you can mix-and-match dynamic and static events and it all should work with the activity IDs. Now obviously you did not have that experience, so we will need more detailed information about how to repro the problem (you can contact met at vancem@microsoft.com) However to answer your question, the intent is that in general dynamic events should behave like a similar static event, and in particular should behave equivalently with respect to activity tracking. Note that there is a known bug that activity tracking does not start until the Task system is initialized. This is usually not a big issue, but it can be confusing with small examples (which may not even use tasks. Thus placing Task.Factory.StartNew(delegate { }); // Launch an empty task to initialize the Task library. somewhere before the first call to any of your start events will work around the bug.Anonymous
November 06, 2015
Thanks for the Information and your contact address. I will send you the modified demo code and the PerfView results.Anonymous
December 06, 2015
Is this expected to work under ASP.Net Webforms? I've got the sample running outside of asp.net, but the moment I throw it into asp.net, all events have empty activity ids.Anonymous
December 07, 2015
There is nothing about WebForms per-se that should affect it. However there are a number of things that may make it appear to work under simple circumstances but fail under more complex ones if you are not using V4.6 of the runtime, and that you turned on the tracing by setting the appropriate keyword for the Task events (See the spec on the previous blog, however CURRENT versions of PerfView do this).Anonymous
December 08, 2015
I'm running on .net 4.6.1. It seems for me that enabling the TPL Provider alone is not enough, I had to additional enable the AspNetTraceEventProvider. session.EnableProvider(AspNetTraceEventParser.ProviderGuid, TraceEventLevel.Informational); Once that was enabled in a session, Activity tracing worked fine for me.Anonymous
December 08, 2015
Yes, turning on the keyword in the Task library only turns on the activity Tracking. If you don't have additional providers turned on, then you won't get any events. You have to turn on the providers you care about as well.Anonymous
December 08, 2015
So I was getting events fine, but without the AspNetTraceEventParser enabled the ActivityIds received for the events were not Path activities. Without enabling the AspNetTraceEventProvider enabled, StartStopActivityComputer.IsActivityPath(data.ActivityID) the events raised in my customa sp.net code always returned false. Once AspNetTraceEventProvider was enabled it returned true. I can provide some code to repro if that would be helpful.Anonymous
December 08, 2015
I should clarify that unfortunately, the ASP.NET pipeline for a request starts in NATIVE code and thus is NOT using an EventSource and thus does NOT properly participate the causality tracing feature. There is a certain amount of interop that can happen between native code and EventSource causality IDs, but it turns out that there was a bug that makes the more complex native-managed scenario break. This has been fixed in the next release of the runtime V4.6.2, but that will not be available for a few months. What will work immediately however is the ability to instrument your code (ASP.NET or otherwise) using starts and stops and see that code causality flow as described in this blog.Anonymous
March 09, 2016
You mentioned that the StartStopTree was available in non-official version 1.8.5. I tried 1.9 and didn't see the tree. Is it still hidden for public use?Anonymous
March 09, 2016
@stej: Because the StartStopTree uses the Task events and context switch events to accurately attribute events to the tasks that they are associated with, it is only active if you have those events (collecting with the 'threadTime' checkbox will enable them) This view predated the activityID path work in EventSource, which is why it works the way it does. It should also be possible to form the tree by using activity IDs (which would not need the Task and context switch events). This could be a useful view to add, it just has not been done yet.Anonymous
March 27, 2016
I tried to run the app and collect data with PerfView. The results are different from your etl file. Why event DebugMessage that starts in thread (has message "Processing Request") has assigned activity like //1/1/1/, //1/1/2/ ? The activity should be started when event has "Start" suffix, but that's not true for DebugMessage. It looks ok in your etl file (no activity started for DebugMessage event).Also I noticed that three activity ID's are duplicate in my collecting. See http://imgur.com/Ov1h8Dp Can you shed some light on the activity ID's for such events without Start/Stop suffix?Anonymous
March 27, 2016
One more question: we have some work, that is initiated by some threads (creating and preparing some event), the event is then added to ConcurrentQueue and then later taken by one exclusive thread and processed. I guess that in this case the activity support won't work, because each Stop is called always on that one particular thread. Am I right? And if so, is there any chance how to "help" the PerfView to cope with it?Anonymous
April 12, 2016
Is there any other forum where to ask question related to perfview? Tried stackoverflow with little luck, then some MS forum, no answer...