Not
Åtkomst till den här sidan kräver auktorisering. Du kan prova att logga in eller ändra kataloger.
Åtkomst till den här sidan kräver auktorisering. Du kan prova att ändra kataloger.
I den här artikeln beskrivs hur du aktiverar felsökning för hanterad och intern kod tillsammans, vilket kallas felsökning i blandat läge. Det finns två felsökningsscenarier i blandat läge:
Appen som anropar en DLL skrivs i intern kod och DLL hanteras.
Appen som anropar en DLL skrivs i hanterad kod och DLL:en finns i intern kod. En självstudiekurs som vägleder dig genom det här scenariot finns i Felsöka hanterad och intern kod.
Du kan aktivera både hanterade och interna felsökningsprogram på anropande appprojektets Egenskap sidor. Inställningarna skiljer sig åt för interna och hanterade appar.
Om du inte har åtkomst till det anropande appens projekt så kan du felsöka DLL-filen från DLL-projektet. Du behöver inte blandat läge för att felsöka. Du behöver bara DLL-projektet. Mer information finns i Så här felsöker du från ett DLL-projekt.
Notera
Dialogrutorna och kommandona som beskrivs i den här artikeln kan skilja sig från din upplevelse, beroende på dina Visual Studio-inställningar eller -utgåva. Om du vill ändra inställningarna väljer du Verktyg>import- och exportinställningar. Mer information finns i Återställ alla inställningar.
Aktivera blandat läge för intern samtalsapp (C++)
Följ dessa steg för att aktivera felsökning i blandat läge för en inbyggd anropande app i C++:
I Visual Studio Solution Explorerhögerklickar du på C++-projektet och väljer Egenskapereller använder kortkommandot Alt + Retur. Dialogrutan <Project> Property Pages öppnas.
I dialogrutan expanderar du avsnittet Konfigurationsegenskaper och väljer fliken Felsökning.
På fliken Felsökning väljer du egenskapen Felsökningstyp och använder listrutan för att välja alternativet Auto eller Mixed. Om det finns flera alternativ för Mixed, till exempel .NET Core och .NET Framework, väljer du det bästa alternativet för din konfiguration.
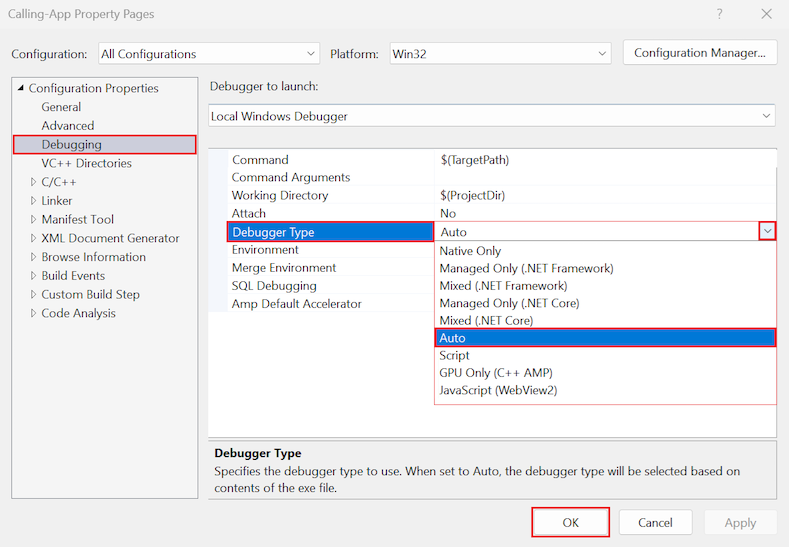
Om du vill tillämpa egenskapsändringen väljer du OK.
Aktivera blandat läge för hanterad samtalsapp (.NET)
Följ dessa steg för att aktivera felsökning i blandat läge för en .NET-anropande app i C# eller Visual Basic:
Högerklicka på projektet C# eller Visual Basic i Visual Studio Solution Exploreroch välj Egenskapereller använd kortkommandot Alt + Retur. Fönstret Egenskaper öppnas.
I fönstret Egenskaper aktiverar du felsökning i blandat läge genom att ange följande egenskap:
.NET-kod
På den vänstra menyn väljer du Felsök.
I avsnittet Allmänt väljer du Öppna UI för startprofiler för felsökning. Dialogrutan Startprofiler öppnas.
I dialogrutan bläddrar du för att hitta avsnittet Aktivera intern kodfelsökning.
Välj Aktivera felsökning för hanterad och intern kod tillsammans, även kallat felsökning i blandat läge egenskap:
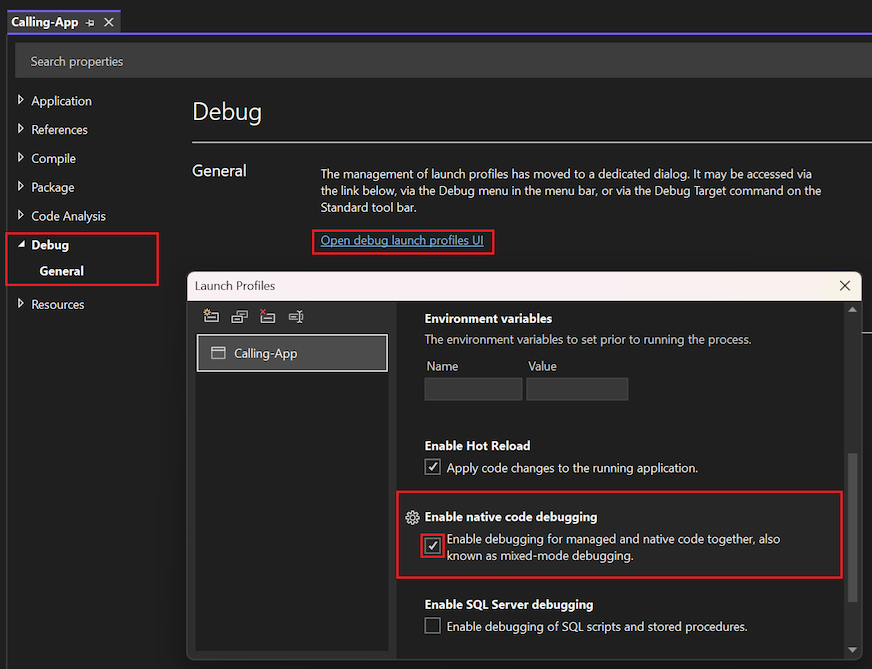
Om du vill tillämpa egenskapsändringen stänger du dialogrutan Starta profiler och fönstret Egenskaper.
På den vänstra menyn väljer du Felsök.
I avsnittet Felsökningsmotorer väljer du egenskapen Aktivera intern kodfelsökning:
Om du vill tillämpa egenskapsändringen stänger du fönstret Egenskaper.
Notera
För en .NET Core-app i Visual Studio 2017 och Visual Studio 2019 måste du använda filen launchSettings.json i stället för projektegenskaperna för att aktivera felsökning i blandat läge.
Aktivera blandat läge för appen för hanterat samtal (.NET Framework)
Så här aktiverar du felsökning i blandat läge för en .NET Framework-anropande app i C# eller Visual Basic:
Högerklicka på projektet C# eller Visual Basic i Visual Studio Solution Exploreroch välj Egenskapereller använd kortkommandot Alt + Retur. Fönstret Egenskaper öppnas.
I fönstret Egenskaper aktiverar du felsökning i blandat läge genom att ange följande egenskap:
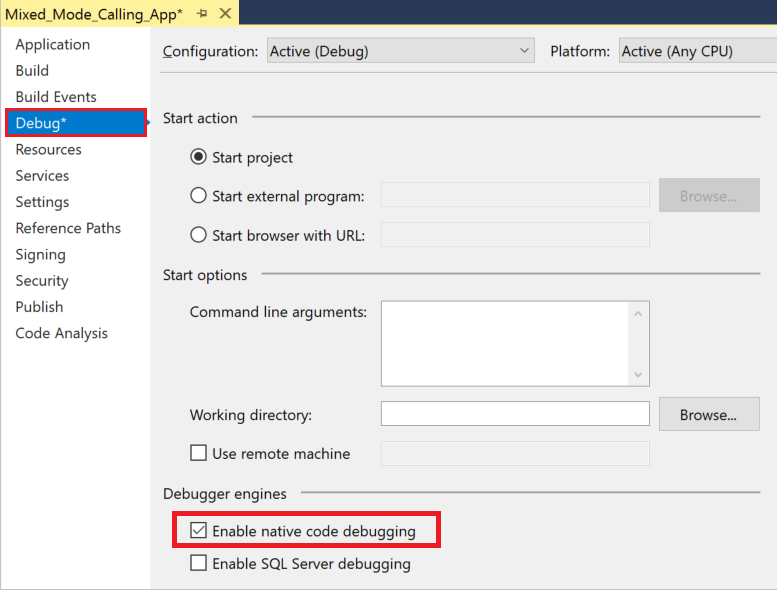
På den vänstra menyn väljer du Felsök.
I avsnittet Felsökningsmotorer väljer du egenskapen Aktivera intern kodfelsökning:
Om du vill tillämpa egenskapsändringen stänger du fönstret Egenskaper.
::: moniker-end