This is not the latest version of Visual Studio. To download the latest release, please visit the Visual Studio site.
What's New in Visual Studio 2019 version 16.0
Support Timeframe
Visual Studio 2019 version 16.0 is now out of support.
Enterprise and Professional users of Visual Studio 2019 version 16.0 were supported and did receive fixes to security vulnerabilities through January 2021. This timeframe was determined by the fact that in December 2019, Visual Studio 2019 version 16.4 was designated as the next servicing baseline to the Visual Studio 2019 product. For more information about Visual Studio supported baselines, please review the support policy for Visual Studio 2019.
The Visual Studio 2019 Blog is the official source of product insight from the Visual Studio Engineering Team. You can find in-depth information about the Visual Studio 2019 releases there.
Visual Studio 2019 version 16.0.22
released January 12, 2020
Security Advisory Notice for 16.0.22
CVE-2021-1651 / CVE-2021-1680 Diagnostics Hub Standard Collector Service Elevation of Privilege Vulnerability
An elevation of privilege vulnerability exists when the Diagnostics Hub Standard Collector incorrectly handles data operations.
CVE-2020-26870 Visual Studio Installer Remote Code Execution Vulnerability
A remote code execution vulnerability exists when the Visual Studio Installer attempts to show malicious markdown.
Visual Studio 2019 version 16.0.21
released December 08, 2020
Security Advisory Notice for 16.0.21
CVE-2020-17156 Visual Studio Remote Code Execution Vulnerability
A remote code execution vulnerability exists when Visual Studio clones a malicious repository.
A tampering vulnerability exists when the Python Tools for Visual Studio creates the python27 folder. An attacker who successfully exploited this vulnerability could run processes in an elevated context.
Visual Studio 2019 version 16.0.19
released October 13, 2020
In this Release of 16.0.19
.NET Code SDK 2.1.616 added to Visual Studio 2019.
Visual Studio 2019 version 16.0.18
released September 8, 2020
Issue fixed in 16.0.18
Out of support versions of .NET Core will no longer be reinstalled during a repair or upgrade if they were removed outside of VS setup.
Security Advisory Notice for 16.0.18
CVE-2020-1130 Diagnostics Hub Standard Collector Elevation of Privilege Vulnerability
An elevation of privilege vulnerability exists when the Diagnostics Hub Standard Collector improperly handles data operations. An attacker who successfully exploited this vulnerability could run processes in an elevated context.
CVE-2020-1133 Diagnostics Hub Standard Collector Elevation of Privilege Vulnerability
An elevation of privilege vulnerability exists when the Diagnostics Hub Standard Collector improperly handles file operations. An attacker who successfully exploited this vulnerability could run processes in an elevated context.
CVE-2020-16856 Visual Studio Remote Code Execution Vulnerability
A remote code execution vulnerability exists in Visual Studio when it improperly handles objects in memory. An attacker who successfully exploited the vulnerability could run arbitrary code in the context of the current user.
CVE-2020-16874 Visual Studio Remote Code Execution Vulnerability
A remote code execution vulnerability exists in Visual Studio when it improperly handles objects in memory. An attacker who successfully exploited the vulnerability could run arbitrary code in the context of the current user.
CVE-2020-1045 Microsoft ASP.NET Core Security Feature Bypass Vulnerability
A security feature bypass vulnerability exists in the way Microsoft ASP.NET Core parses encoded cookie names. The ASP.NET Core cookie parser decodes entire cookie strings which could allow a malicious attacker to set a second cookie with the name being percent encoded.
Visual Studio 2019 version 16.0.17
released August 11, 2020
Issue fixed in 16.0.17
Security Advisory Notice for 16.0.17
CVE-2020-1597 ASP.NET Core Denial of Service Vulnerability
A denial of service vulnerability exists when ASP.NET Core improperly handles web requests. An attacker who successfully exploited this vulnerability could cause a denial of service against an ASP.NET Core web application. The vulnerability can be exploited remotely, without authentication.
Fixed a bug in the C++ linker missing imports when using umbrella LIBs with difference casing on postfix of DLL name.
Fixed a bug in the ARM64 C++ compiler where the wrong values could be restored after setjmp.
Security Advisory Notice for 16.0.16
CVE-2020-1393 Diagnostics Hub Standard Collector Service Elevation of Privilege Vulnerability
An elevation of privilege vulnerability exists when the Windows Diagnostics Hub Standard Collector Service fails to properly sanitize input, leading to an unsecure library-loading behavior.
CVE-2020-1416 Visual Studio Elevation of Privilege Vulnerability
An elevation of privilege vulnerability exists in Visual Studio when it loads software dependencies.
CVE-2020-1147 .NET Core Denial of Service Vulnerability
A remote unauthenticated attacker could exploit this vulnerability by issuing specially crafted requests to an ASP.NET Core application, or other application that parses certain types of XML. The security update addresses the vulnerability by restricting the types that are allowed to be present in the XML payload.
To comprehensively address CVE-2020-1108, Microsoft has released updates for .NET Core 2.1 and .NET Core 3.1. Customers who use any of these versions of .NET Core should install the latest version of .NET Core. See the Release Notes for the latest version numbers and instructions for updating .NET Core.
CVE-2020-1202 / CVE-2020-1203 Diagnostics Hub Standard Collector Service Elevation of Privilege Vulnerability
An elevation of privilege vulnerability exists when the Diagnostics Hub Standard Collector or the Visual Studio Standard Collector fails to properly handle objects in memory.
An elevation of privilege vulnerability exists when the Diagnostics Hub Standard Collector Service improperly handles file operations
Visual Studio 2019 version 16.0.14
released May 12, 2020
Issues fixed in 16.0.14
Added a change that enables Enterprise IT administrators and deployment engineers to configure tools like Microsoft Update client & SCCM to determine applicability of VS2019 16.0 updates hosted on Microsoft Update Catalog & WSUS.
Security Advisory Notice for 16.0.14
CVE-2020-1108 .NET Core Denial of Service Vulnerability
A remote unauthenticated attacker could exploit this vulnerability by issuing specially crafted requests to the .NET Core application.
The security update addresses the vulnerability by correcting how the .NET Core web application handles web requests.
Visual Studio 2019 version 16.0.13
released April 14, 2020
Security Advisory Notice for 16.0.13
CVE-2020-0899 Microsoft Visual Studio Elevation of Privilege Vulnerability
An elevation of privilege vulnerability exists when Microsoft Visual Studio updater service improperly handles file permissions. An attacker who successfully exploited this vulnerability could overwrite arbitrary file content in the security context of the local system.
CVE-2020-0900 Visual Studio Extension Installer Service Elevation of Privilege Vulnerability
An elevation of privilege vulnerability exists when the Visual Studio Extension Installer Service improperly handles file operations. An attacker who successfully exploited the vulnerability could delete files in arbitrary locations with elevated permissions.
CVE-2020-5260 Git for Visual Studio Credential Leak Vulnerability due to insufficient validation on URLs
A credential leak vulnerability exists when specially crafted URLs are parsed and sent to credential helpers. This can lead to credentials being sent to the wrong host.
CVE-2020-0793 & CVE-2020-0810 Diagnostics Hub Standard Collector Service Elevation of Privilege Vulnerability
An elevation of privilege vulnerability exists when the Diagnostics Hub Standard Collector improperly handles file operations, or the Windows Diagnostics Hub Standard Collector Service fails to properly sanitize input.
CVE-2020-0884 Spoofing vulnerability when creating Outlook Web -Add-in
A remote unauthenticated attacker could exploit this vulnerability by issuing specially crafted requests to the ASP.NET Core application. The security update addresses the vulnerability by correcting how the ASP.NET Core web application handles web requests.
A remote unauthenticated attacker could exploit this vulnerability by issuing specially crafted requests to the ASP.NET Core application. The security update addresses the vulnerability by correcting how the ASP.NET Core web application handles in memory.
A remote code execution vulnerability exists when Git runs into collisions of submodule names for directories of sibling submodules. An attacker who successfully exploited this vulnerability could remote execute code on the target machine. The security update addresses the vulnerability by taking a new version of Git for Windows which requires the directory for the submodules’ clone to be empty.
A remote code execution vulnerability exists when Git interprets command-line arguments with certain quoting during a recursive clone in conjunction with SSH URLs. An attacker who successfully exploited this vulnerability could remote execute code on the target machine. The security update addresses the vulnerability by taking a new version of Git for Windows which fixes the issue.
An arbitrary file overwrite vulnerability exists in Git when non-letter drive names bypass safety checks in git clone. An attacker who successfully exploited this vulnerability could write to arbitrary files on the target machine. The security update addresses the vulnerability by taking a new version of Git for Windows which fixes the issue.
A remote code execution vulnerability exists in Git when cloning and writing to .git/ directory via NTFS alternate data streams. An attacker who successfully exploited this vulnerability could remote execute code on the target machine. The security update addresses the vulnerability by taking a new version of Git for Windows which has been made aware of NTFS alternate data streams.
An arbitrary file overwrite vulnerability exists in Git when tree entries with backslashes and malicious symlinks could break out of the work tree. An attacker who successfully exploited this vulnerability could write to arbitrary files on the target machine. The security update addresses the vulnerability by taking a new version of Git for Windows which does not allow this usage of backslashes.
A remote code execution vulnerability exists in Git when cloning recursively with submodules. An attacker who successfully exploited this vulnerability could remote execute code on the target machine. The security update addresses the vulnerability by taking a new version of Git for Windows which tightens validation of submodule names.
A spoofing vulnerability was detected in the Visual Studio Live Share extension, when a guest connected to a Live Share session was redirected to an arbitrary URL specified by the session host. An attacked would have been able to successfully exploit this vulnerability and cause the guest's computer to open a browser and navigate to a malicious URL without explicit consent. This was part of the "Shared Server" feature of Live Share that allowed auto port-forwarding during an active Live Share session. The latest update addresses this vulnerability by promopting the Live Share guest from consent prior to browsing the host-specified URL.
An elevation of privilege vulnerability exists when Visual Studio fails to properly validate hardlinks when extracting archived files. The vulnerabilities were introduced by NPM packages used by Visual Studio as described in the following two NPM advisories: npmjs.com/advisories/803 and npmjs.com/advisories/886. The updated versions of these NPM packages were included in this version of Visual Studio.
An elevation of privilege vulnerability exists when the Diagnostics Hub Standard Collector Service improperly impersonates certain file operations. An attacker who successfully exploited this vulnerability could gain elevated privileges. An attacker with unprivileged access to a vulnerable system could exploit this vulnerability. The security update addresses the vulnerability by ensuring the Diagnostics Hub Standard Collector Service properly impersonates file operations.
Visual Studio 2019 version 16.0.7
released August 13, 2019
Issues fixed in Visual Studio 2019 version 16.0.7
Fixed a performance regression during breakpoint hit and stepping.
Fixed a performance regression when IntelliTrace.exe starts up.
Fixed a bug causing a crash when unable to reach the TFS.
An elevation of privilege vulnerability exists in Git for Visual Studio when it improperly parses configuration files. An attacker who successfully exploited the vulnerability could execute code in the context of another local user. To exploit the vulnerability, an authenticated attacker would need to modify Git configuration files on a system prior to a full installation of the application. The attacker would then need to convince another user on the system to execute specific Git commands. The update addresses the issue by changing the permissions required to edit configuration files.
A denial of service vulnerability exists when .NET Core improperly handles web requests. An attacker who successfully exploited this vulnerability could cause a denial of service against a .NET Core web application. The vulnerability can be exploited remotely, without authentication.
The update addresses the vulnerability by correcting how the .NET Core web application handles web requests.
Visual Studio 2019 version 16.0.6
released July 9, 2019
Issues fixed in Visual Studio 2019 version 16.0.6
Fixed narrator support on systems running on Windows 10 version 1903 or with .NET 4.8 installed.
.NET Core updates have released today and are included in this Visual Studio update. This release addresses security and other important issues. Details can be found in the .NET Core release notes.
An elevation of privilege vulnerability exists when the Visual Studio Extension auto-update process improperly performs certain file operations. An attacker who successfully exploited this vulnerability could delete files in arbitrary locations. To exploit this vulnerability, an attacker would require unprivileged access to a vulnerable system. The security update addresses the vulnerability by securing locations the Visual Studio Extension auto-update performs file operations in.
A XOML file referencing certain types could cause random code to be executed when the XOML file is opened in Visual Studio.
There is now a restriction on what types are allowed to be used in XOML files. If a XOML file containing one of
the newly unauthorized types is opened, a message is displayed explaining that the type is unauthorized.
An elevation of privilege vulnerability exists when the Diagnostics Hub Standard Collector Service improperly performs certain file operations. An attacker who successfully exploited this vulnerability could delete files in arbitrary locations. To exploit this vulnerability, an attacker would require unprivileged access to a vulnerable system. The security update addresses the vulnerability by securing locations the Diagnostics Hub Standard Collector performs file operations in.
Visual Studio 2019 version 16.0.3
released April 30, 2019
What's New in Visual Studio 2019 version 16.0.3
Visual Studio Tools for Kubernetes now supports the latest Azure Dev Spaces.
Visual Studio will no longer show an error message on startup after you reset or import settings in certain cases.
Accessibility issues in Cloud Service projects where wrong inputs in the diagnostics configuration window are not read by screen readers have been fixed.
Collaborate with others using Visual Studio Live Share, which is installed by default. Additional language support for C++, VB.NET, and Razor gives guests a solution view and sharing of source control diffs.
Open code you recently worked on or start from one of the most commonly used flows like clone, open, or create a project through the new start window.
Create new projects with an improved search experience and filters using the new list of templates sorted by popularity.
Have more vertical room for your code and a modernized look and feel through a set of new visual changes in the shell.
View a sharper version of your IDE regardless of your display configuration and/or scaling, as we have improved support for per monitor awareness.
Use an improved search capability in Visual Studio for menus, commands, options, and installable components.
Quickly understand your code file's 'health' with a document indicator. Run and configure through a one-click code cleanup from the indicator.
Easily manage the preview features you are opted in to with a new Preview Features page in the Options dialog.
Create new projects with improvements in tag-based search and an easily accessible "Recent project templates" list.
Create new items directly from Visual Studio Search and find results faster with improved relevance.
Stay informed of important information, such as Visual Studio Live Share requests, with a new notifications experience.
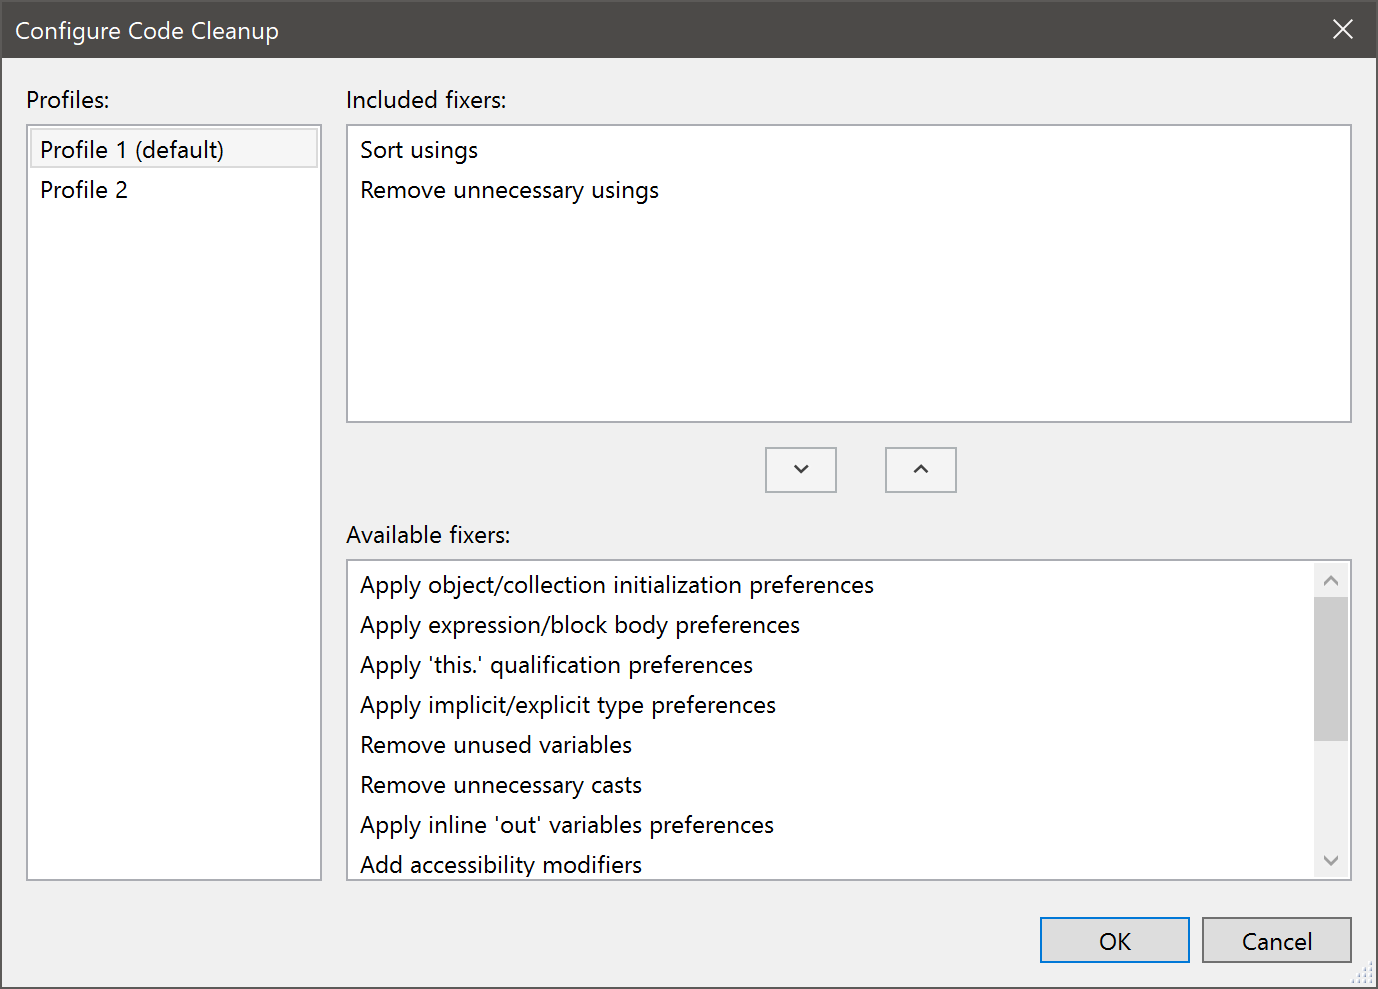
Save a collection of code cleanup fixers as a profile to easily select the fixers you want run during code cleanup.
Check and configure which Preview features you want active since the defaults have been reset in this Preview.
Keep your extensions up-to-date by excluding certain Test Window APIs that have been marked as deprecated in this release.
Sign in, browse, and one-click clone or connect to your hosted repositories from Azure DevOps through the start window.
Install extensions for other source control hosts to view repositories owned by you and your organization.
Experience an improved Blue theme experience that addresses feedback by dialing down the luminosity, improving overall contrast and addressing other usability issues.
Apply code style preferences from the command-line with the dotnet format global tool.
MSBuild and Visual Studio now target .NET Framework 4.7.2 by default.
We have removed Azure App Service-related features from Server Explorer; equivalent functionality is instead available in Cloud Explorer.
Performance
Take control of how solutions load by using Visual Studio's new performance improvements that affect stepping speed, branch switching speed, and more.
Launch Google Chrome with custom arguments and debug your JavaScript applications all within the Visual Studio IDE.
Use Hot Path Highlighting for CPU and DotNet Object Allocation tools in the Performance Profiler.
Break when a specific object's property value changes in .NET Core 3.0+ applications using data breakpoints, a feature that was originally exclusive to C++.
Since Preview 1, we have updated the UI for searching in the Autos, Locals, and Watch windows with a simpler interface. The Search Deeper function has been changed to a dropdown so you can quickly select how deep you want your initial and subsequent searches to be.
Source Control and Team Explorer
Temporarily store changes so you can work on another task by using Team explorer's Git tools support for Git stash.
Check out the optional extension available on the Visual Studio Market Place, Pull Requests for Visual Studio, that integrates Pull Request reviews into Visual Studio.
Use the new Azure DevOps work item experience that focuses on developer workflows, including user-specific work item views, creating a branch from a work item, searching for work items with #mentions, and inline editing.
Take advantage of our update to the VSIX Project to now include an AsyncPackage.
Experiment with a new Empty VSIX Project template that we have added.
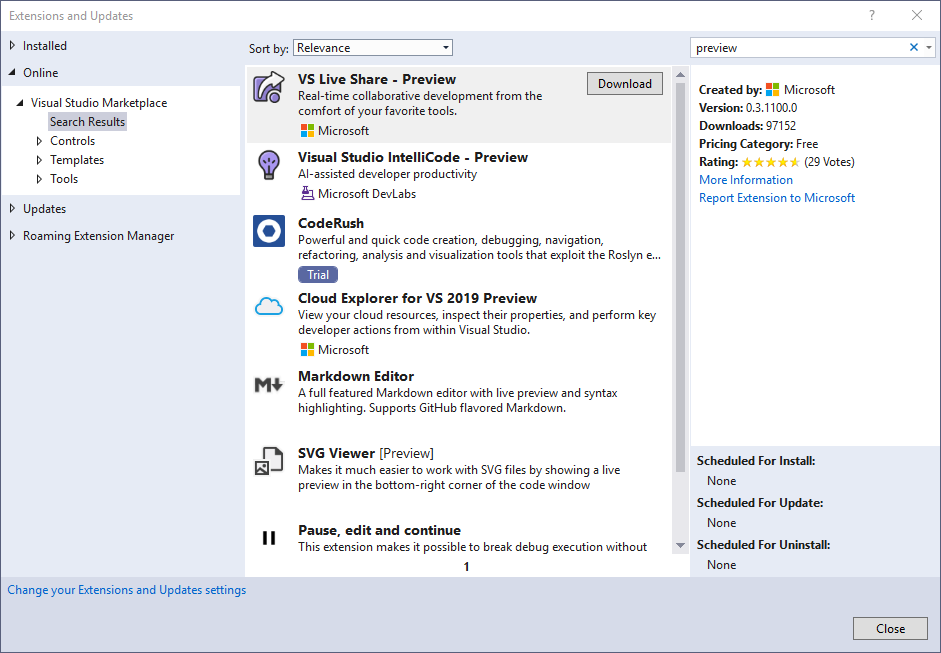
Know if an extension is Free, Paid, or Trial, as it is now indicated inside the Extensions and Updates dialog.
Programming Languages
C#
Experience a preview of the 8.0 language features that the C# compiler now supports, including:
Nullable reference types: When the feature is turned on (for example, with #nullable enable or at the project-level with <NullableContextOptions>enable</NullableContextOptions>), reference types are treated as nullable if annotated with ?, and as non-nullable otherwise. The compiler then analyzes where null values flow and warns about likely unsafe usages.
switch expressions: Offers switch-like semantics in an expression context.
Recursive pattern matching: New patterns allow testing fields/properties and positional elements (from tuples or deconstruction).
Support for Range and Index types being used in CoreFX for slicing, including the x..y literal syntax for ranges.
Asynchronous streams represented by IAsyncEnumerable<T> can be enumerated asynchronously with await foreach and can be produced with async IAsyncEnumerable<T> iterator methods.
using declarations: Dispose at the end of the current block, without increasing the level of nesting. ref structs can be disposed by implementing a public Dispose() method.
static local functions: Local functions marked with static cannot reference this or variables in the enclosing functions.
Local functions and lambdas can now declare parameters and locals that shadow names of variables of the enclosing functions.
Additionally, you can use more modern C# language features in Visual Studio by default.
C++
Save time when writing C++ and XAML code by using Visual Studio IntelliCode, an optional extension that gives AI-assisted recommendations for your code.
Experience in-editor code analysis warnings. Code analysis runs automatically in the background and warnings display as green squiggles.
Try the new Template Bar, which uses the Peek Window UI and supports nested templates.
Configure your CMake projects using the new CMake Settings Editor, which provides an alternative to CMakeSettings.json.
Try out a host of backend improvements including OpenMP SIMD vectorization, link-time speedups, and more aggressive inlining.
Open existing CMake caches generated by external tools, such as CMakeGUI, or customized meta-build systems.
Improve analysis with /Qspectre for providing mitigation assistance for Spectre Variant 1 (CVE-2017-5753). For more information, see the Visual C++ Team Blog post.
Quickly switch between your previous sample arguments now that the Template Bar for Template IntelliSense has a Most Recently Used dropdown.
F#
F# 4.6 is released, along with various other compiler improvements.
Experience performance improvements for larger solutions and various bug fixes for F# and the F# tools.
Learn about some of the awesome work done by open source contributors to the F# language and tools.
Experience enhancements to the Azure DevOps work item experience that include inline support of assigning work items and an improved #mentions experience.
Work with project files more easily and experience a better console app for .NET Core tooling.
Experience enhancements to the publish profile summary for all apps. Additionally, a new section called Dependencies is now available when an app is published to Azure App Service.
Preserve comments, spacing, namespaces, and any other text changes when making edits from the designer. The package manifest designer now maintains strict fidelity to xml changes in the Package.appxmanifest file.
Deployment to Windows Mobile devices is no longer supported in Visual Studio 2019. Attempts to deploy to a Windows 10 Mobile device will result in an error saying "Deployment to Windows Mobile devices is not supported in Visual Studio 2019". If you need to continue working on an application for Windows 10 Mobile devices, continue to use Visual Studio 2017.
XAML Debugging Tools:
XAML Edit & Continue now supports x:bind (UWP): XAML Edit & Continue now supports editing data bindings created with x:bind for paths containing public properties, element name, indexed property paths (collections), attached properties, and cast properties. Other changes are not supported. This enhancement is available to any app where the minimum and maximum versions target Windows 10 SDK version 1809 (build 10.0.17763) or higher. (Note: XAML Edit & Continue is now known as XAML Hot Reload starting with Visual Studio 2019 Update 2+).
SQL Server Data Tools
Experience an updated SSDT and DacFX that now includes UTF-8 collation support.
Details of What's New in Visual Studio 2019
Install
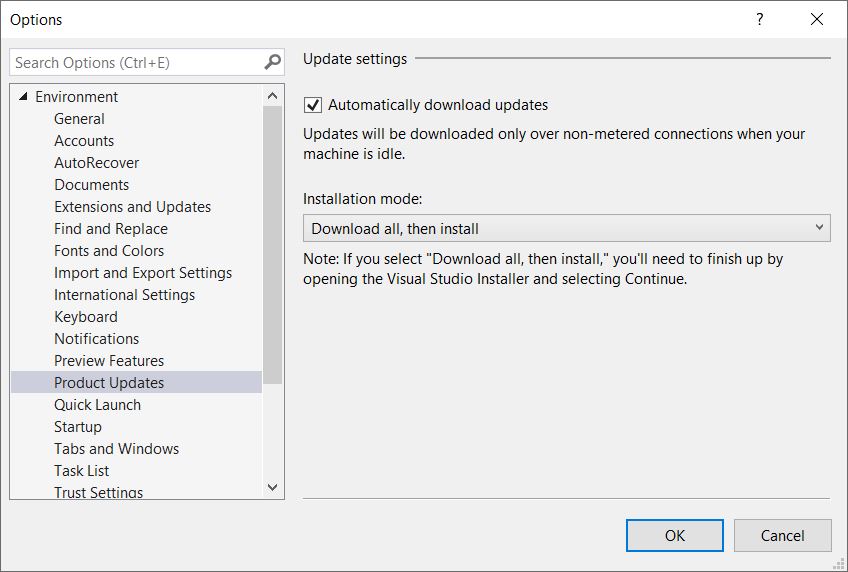
You can now choose how to install Visual Studio updates. The default mode is ‘Download all, then install’ which allows you to continue using Visual Studio while updates are being downloaded. Note that, if you select ‘Download all, then install’, you’ll need to finish up the installation by opening the Visual Studio Installer and selecting Continue.
Visual Studio updates will now be downloaded in the background. These downloads will occur only when your machine is idle. When the downloads complete, you will get a notification inside Visual Studio that your download is now ready to install.
You can now control your update installation mode and whether to download updates or not through the Tools > Options menu by changing the settings on Product Updates page.
*Product Update Options*
Start window
The new start window provides a streamlined launch experience to help you quickly get to your code upon starting up Visual Studio.
View your recent projects and folders, and open them with a single click. Pin and remove items from the list through the context menu.
Clone or check out code by using any public or private git URL, which will also automatically open the folder in the IDE.
Sign in, browse, and one-click clone or connect to your hosted repositories from Azure DevOps or install extensions for other source control hosts to view repositories owned by you and your organization.
Browse your local disk or network share for projects, solutions, or any folders containing code, and open them in the IDE.
Select a project template that provides you with code scaffolding to help you get started with a new project or solution.
Search for project templates by their title, description, and tags or filter through available languages, platforms, and project types. The default list shows all available templates, while a list of your top 10 recently used project templates appears on the left pane for quick access. A two-page wizard allows you to concentrate on one decision at a time.
*New Start Window Experience*
Shell and platform
Quickly spot which version of Visual Studio you're opening and using via the new, improved product icon. The new icon is also more visible against a variety of backgrounds.
Experience a modernized look and feel of Visual Studio with our refreshed blue theme that gives you a cleaner user interface while still meeting our accessibility standards.
See more of your code, through our changes that target compactness and reclaim vertical space in the IDE. We have combined the title bar and the menu bar while also preserving existing functionality.
Use Visual Studio as a Per-Monitor Awareness application through a new, experimental setting. When on, this setting helps parts of Visual Studio, such as the shell and the editor, render more sharply regardless of your display configuration and/or scaling.
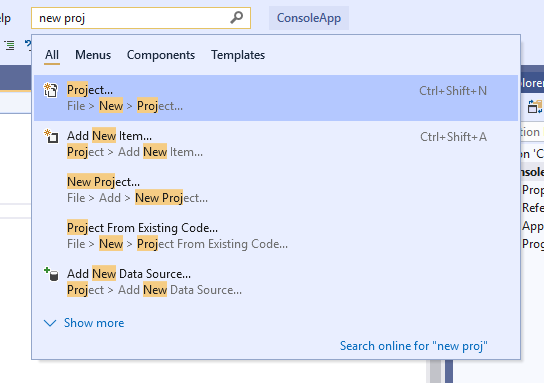
Experience an enhanced search experience across menus, commands, options, and installable components. Our new search now displays results dynamically, accommodates spelling errors, and provides relevant information (such as keyboard shortcuts) inside the search results.
*Enhanced Search in Visual Studio*
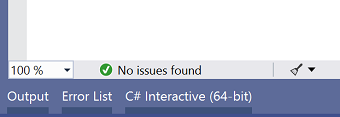
View health information associated with your currently open file through the Document Health Indicator feature.
*Document Health Indicator - issue in document*
*Document Health Indicator - no issues*
If you are a C# developer, you can quickly clean up some of the most common coding suggestions using Code Cleanup.
Select the set of fixers you'd like to have run by configuring Code Cleanup.
*Configure Code Cleanup*
See the contents of your clipboard history via a context menu that extends the Clipboard Ring (Ctrl + Shift + V).
*Clipboard Ring Context Menu*
We've improved your search experience by:
Adding filters for Menus, Components, and Templates
Incorporating your search selections to give you the most relevant search results
Enabling you to create and add new projects/items to your solution directly from Visual Studio Search
The improved Per-Monitor Awareness (PMA) experience is now turned on by default for users that meet the minimum set of requirements (.NET 4.8 Preview & and Windows 10 April 2018 Update or newer). Tool windows such as Toolbox, Breakpoints, Watch, Locals, Autos & Call Stack have been converted to PMA and thus render sharply regardless of your display configuration and/or scaling.
A new notification experience adds:
A new icon and counter experience to the status bar
A new toast notification mechanism
Visual Studio Updates & Visual Studio licensing expiration notifications
A revised Blue theme experience that addresses feedback by dialing down the luminosity, improving contrast and addressing other usability issues.
Enhanced window-dragging capabilities by leveraging available free space in the toolbar region as a draggable region.
You can now save a collection of Code Cleanup fixers as a profile so you can quickly select the set of fixers you want run during Code Cleanup.
*Visual Studio Code Cleanup Profiles*
We've added tags in the Extensions and Updates dialog to help you quickly understand whether an extension is in Preview, is a Paid extension, or is in a Trial period.
*Extensions and Updates dialogs with tags*
The recommended way to implement data tooltips in Visual Studio 2019 and later is now IAsyncQuickInfoSourceProvider. Legacy Editor Quick Info APIs IVsTextTipData and TextTipData are deprecated in Visual Studio 2019 Preview 1.
The Editor Smart Tags (ISmartTag* family of interfaces in Microsoft.VisualStudio.Language.Intellisense namespace) have been deprecated in favor of the LightBulb API and are no longer supported starting with Visual Studio 2019 Preview 1.
The solution options Show advanced build configurations, Always show solution, and Save new projects when created have been removed due to low usage. These values have been set to their default value of True.
Opt in or out of certain preview features using the new Preview Features page found in Tools > Options > Environment > Preview Features.
Performance
We have added a new shortcut for Build Selection for folders and solutions: Ctrl + B.
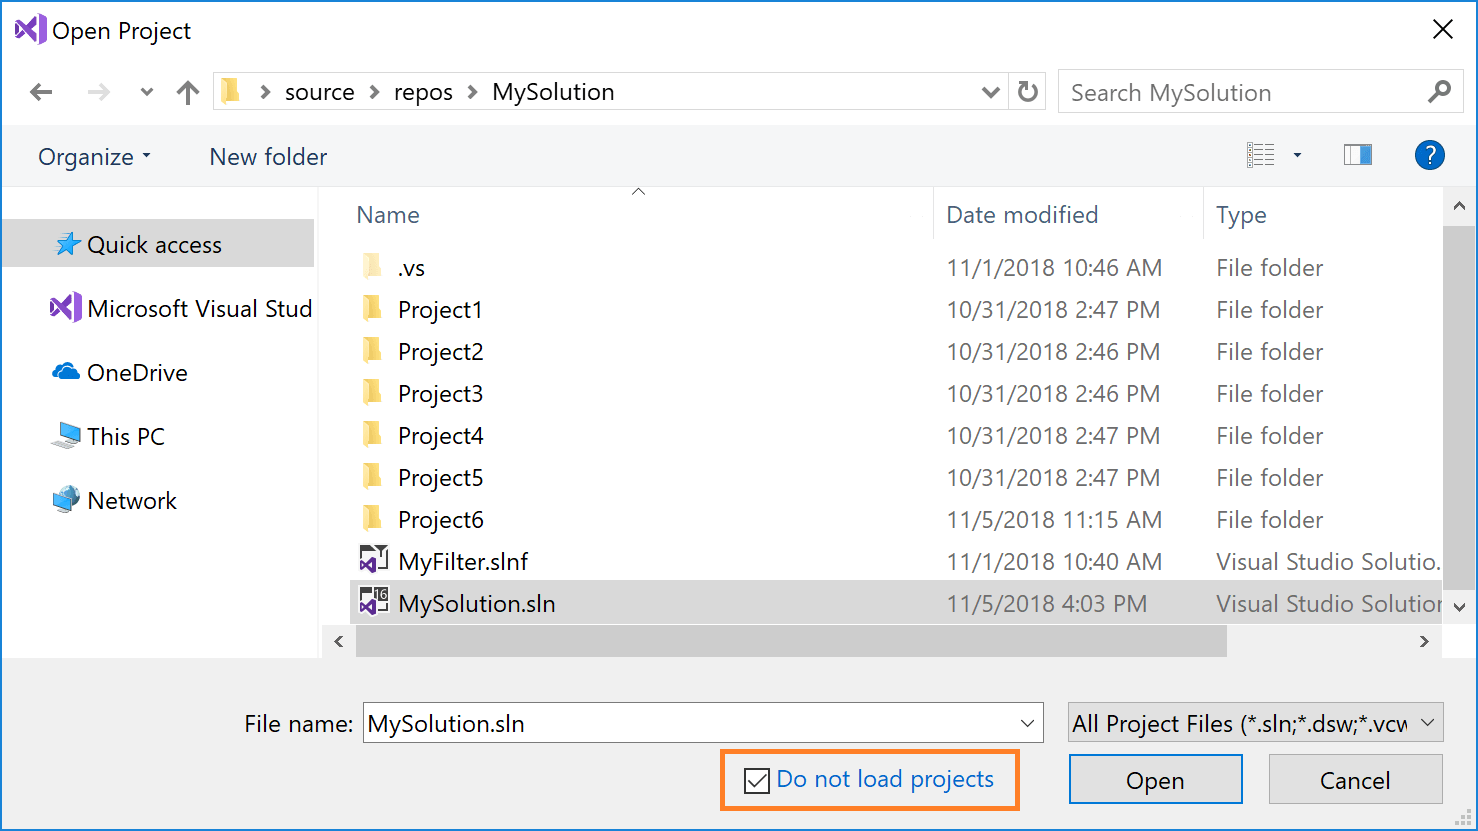
Quickly open large solutions by loading your solution with all projects unloaded.
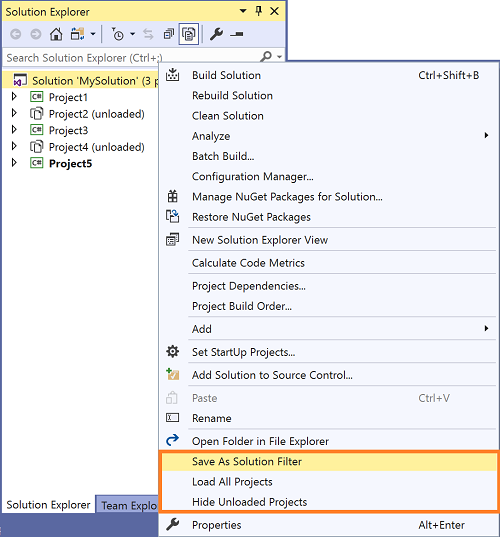
Create a Solution Filter File by unloading projects you don't want opened automatically, right-clicking the solution, and selecting Save As Solution Filter. You can then use the filter file to open the solution for subsequent uses.
We have added a command to Build All for CMake files: Ctrl + Shift + B.
We've improved IntelliSense performance in C++ files in CMake projects.
We've added a command to load unloaded project dependencies to the project and solution context menus.
Notification tips to improve performance of Visual Studio are now persisted in the performance center, accessible via Help > Manage Visual Studio Performance.
You can now see your solution load progress in the Task Status Center, as well as alerts when your solution loads finish.
Choose which projects to load on solution open with Solution Filter Files.
Create a Solution Filter File by unloading projects you don't want opened automatically, right-clicking the solution, and selecting Save As Solution Filter. You can then use the filter file to open the solution for subsequent uses.
Experience improved build asset discovery and file search when you Ctrl+T in Open Folder scenarios.
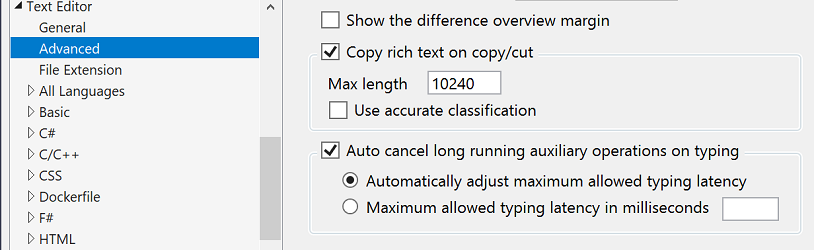
Notice performance improvements now that the Visual Studio editor will limit the impact of auxiliary components on typing performance. Particularly, it will auto-cancel any long-running, nonessential operations when typing.
You can configure the Visual Studio auxiliary component limitation behavior via Tools > Options > Text Editor > Advanced:
*Visual Studio Typing Latency Options*
You can now disable the restoration of the project hierarchy state from the previous session in the Solution Explorer tool window. We implemented this change because restoring the project hierarchy from previous session at solution open can delay solution load.
Toggle this option in Tools > Options > Projects and Solutions > General.
*Solution load restore settings*
* You can now disable the restoration of the tool window's state from the previous session and instead always load Solution Explorer and Team Explorer at startup. This change was implemented because restoring tool windows from previous sessions can delay solution loads at startup.
* Toggle this option in **Tools > Options > Environment > Startup**.
General Debugging and Diagnostics
General Debugging
Highlight, find, and navigate with keywords using our new search feature that we integrated into the Watch, Autos, and Locals windows.
Searching in the Watch Window
View a dropdown of specifiers and options to format data in the Watch, Autos, and Locals windows by appending a comma to a listed item.
Format Specifier Dropdown in Watch Window
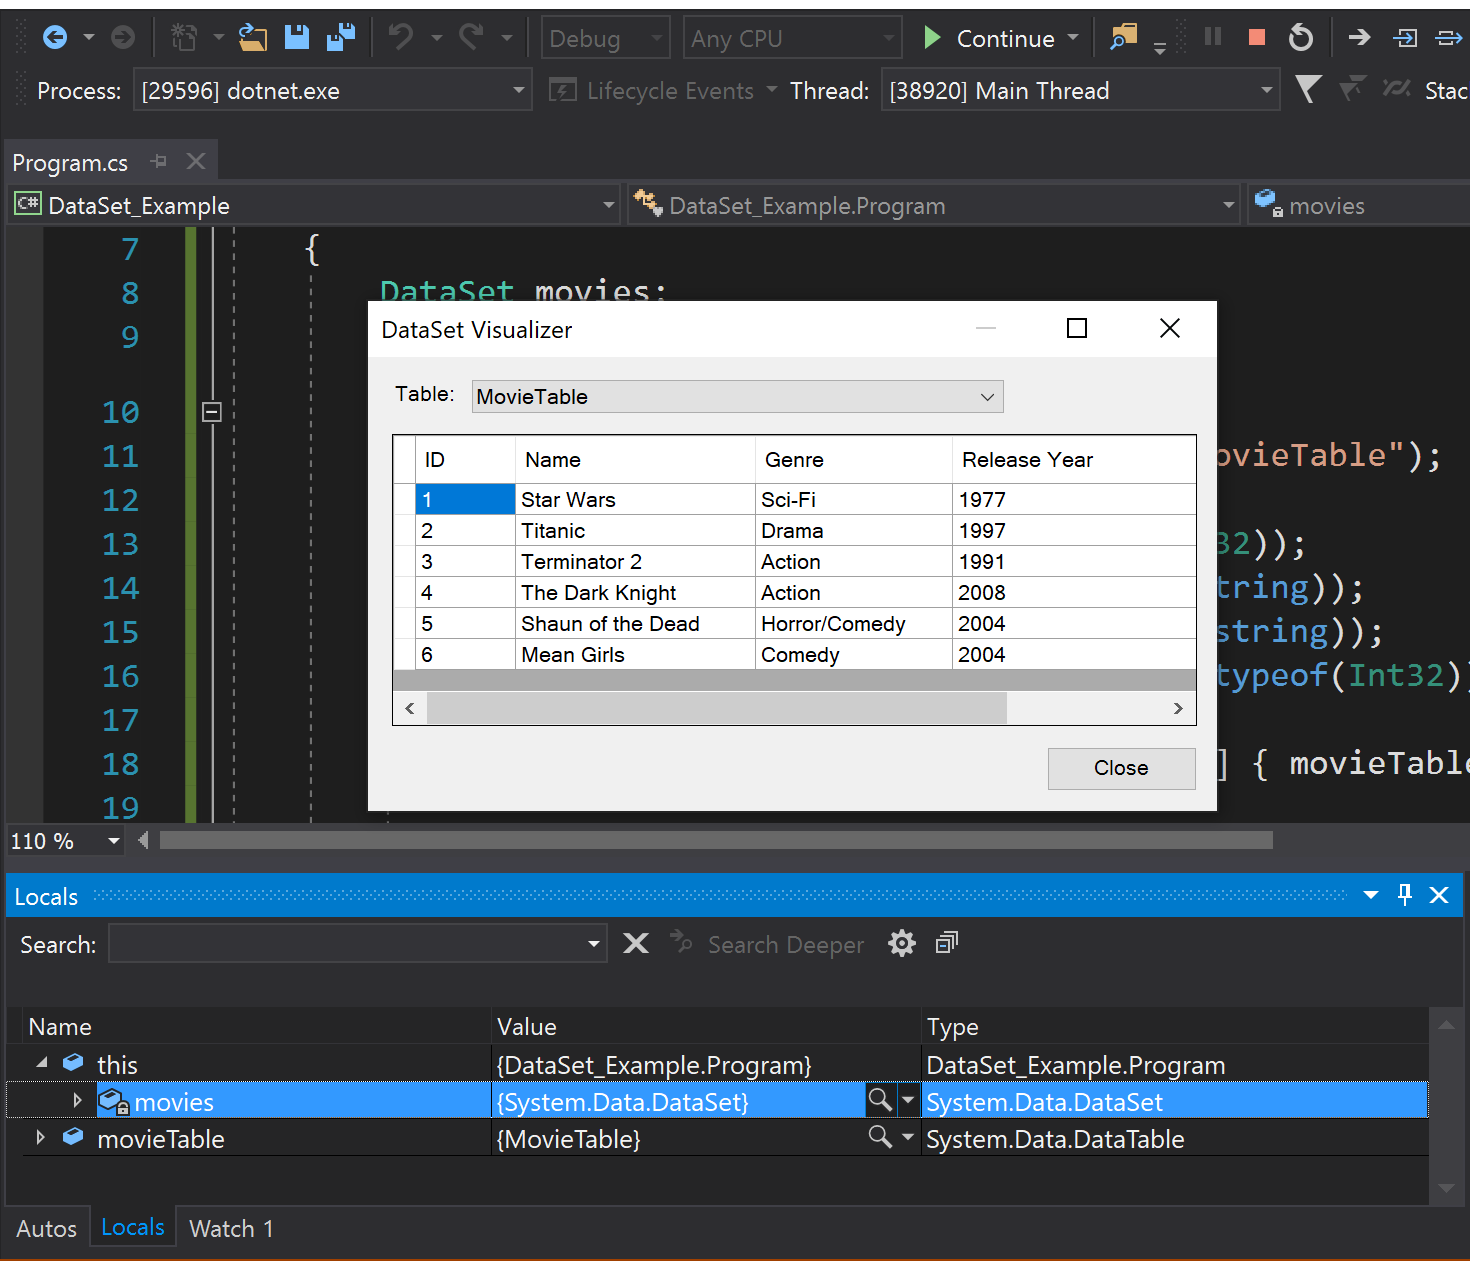
You can now use custom and DataSet visualizer support for .NET Core.
DataSet Visualizer for .NET Core applications
For C++ applications running on Windows, PDB now load in a separate 64-bit process. This change addresses a range of crashes caused by the debugger running out of memory when debugging applications that contain a large number of modules and PDBs.
Managed data breakpoints
You can now break when a specific object's property value changes in .NET Core (3.0 or higher) applications using data breakpoints, a feature that was originally exclusive to C++. They are a great alternative to simply placing a breakpoint on a property's setter because a data breakpoint can focus on a specific object's property even when it's out of scope, whereas the former option may result in constant, irrelevant breaks if you have hundreds of objects calling that function.
Data breakpoints in .NET Core application
Watch window Search UX Updates
We have updated the UI for searching in the Autos, Locals, and Watch windows with a simpler interface. The Search Deeper function has been changed to a dropdown so you can quickly select how deep you want your initial and subsequent searches to be.
Apply code style preferences
You can now apply code style preferences from the command-line with the dotnet format global tool. To install, you will need .NET Core 2.1 SDK or later. Run the following command in your favorite terminal:
dotnet tool install -g dotnet-format --version 3.0.0-beta4-19105-10
Run dotnet format from the command-line.
Extensibility
You will no longer be able to install extensions built with the V1 vsixmanifest extension format in Visual Studio 2019. V1 was introduced in Visual Studio 2010 and was deprecated in Visual Studio 2017 because it could cause reliability issues with Visual Studio. In Visual Studio 2019, the support for V1 has been completely removed. Extensions targeting Visual Studio 2019 should be rebuilt V2 or V3 of the vsixmanifest format.
In the past, extension authors had to make many separate references to the individual NuGet packages of the Visual Studio SDK they needed to use in their extension. The versions of the various packages weren't always aligned and that often resulted in dependency conflicts at compile time as well as runtime issues.
To solve these issues, use a new package called Microsoft.VisualStudio.SDK which contains dependencies on all the packages that make up the Visual Studio SDK. It solves the issue of version mismatches as well as makes it easy to know which version to use. Simply use the version of the package that corresponds to the lowest version of Visual Studio your extension supports and you will have access to the entire SDK.
Right now, only version 15.9 of the SDK package exists, but more will be released in the months to come all the way to version 14.0.
New and updated project templates
The VSIX Project template has gone through multiple updates to simplify it and make it better:
Uses the new, unified SDK NuGet package
Includes an AsyncPackage class
No longer requires a .resx file to compile a package
Targets .NET Framework 4.7.2
A new Empty VSIX Project template has been created and it is the same as the VSIX Project template but without the AsyncPackage class. It also references the unified SDK NuGet package providing a good starting point for MEF extensions and other package-less extension types.
Free/Paid/Trial
There hasn't been an easy way to see if an extension was marked as free, paid, or a trial. This now changes so that inside the Extensions and Updates dialog, each extension that is either a trial or paid will be marked clearly as such. Extensions that don't have a trial/paid label are free.
Testing tools
Additional APIs in the Test Window that were previously undocumented but marked as public have been added to the deprecation list.
Source Control
Temporarily store changes so you can work on another task now that Team Explorer's Git tools support Git stash.
Review, run, and even debug pull requests from Azure Repos without leaving the IDE using our brand-new pull request experience in Visual Studio 2019. To get started, you can download the Pull Requests for Visual Studio extension from the Visual Studio Marketplace.
New Pull Request Experience
MSBuild
The MSBuild toolset version has been changed from 15.0 to Current. MSBuild.exe is now in %VSINSTALLDIR%\MSBuild\Current\Bin\MSBuild.exe.
MSBuild (and Visual Studio) now targets .NET Framework 4.7.2. If you wish to use new MSBuild API features, your assembly must also upgrade, but existing code will continue to work.
C#
For every release prior to Visual Studio 2019, the default C# language version was always equivalent to Latest Major. In Visual Studio 2017, C# evolved and released three minor versions: 7.1, 7.2, and 7.3. However, new projects were still defaulting to C# 7.0. This proved frustrating for C# developers who wanted to use new features, but had to manually change the language version for each new project.
To address this problem, the default C# language version is determined by its target framework:
If you are targeting .NET Core 3.0 preview, the C# language version will be C# 8.0 Preview.
If you are targeting .NET Framework or any non-preview of .NET Core, the C# language version will by C# 7.3.
This allows the use of the latest stable C# language features by default, and when using .NET Core previews, the use of C# 8.0 preview language features that align with .NET Core 3.0 Preview.
If you specify a language version via LangVersion in a project or props file, that language version overrides the previously described default.
Save time by by using IntelliCode, an optional extension that uses its extensive training and your code context to put what you're most likely to use at the top of your completion list. For C++, IntelliCode offers the most help when you are using popular libraries like STL.
We have modified several project template names and descriptions to fit with the updated New Project dialog.
We have removed the Clang/C2 experimental component. Use the MSVC toolset for full C++ standards conformance with /permissive- and/or /std:c++17, or the Clang/LLVM toolchain for Windows. See the Visual C++ Team Blog for more details.
We have deprecated the C++ Compiler /Gm switch. Consider disabling the /Gm switch in your build scripts if it's explicitly defined. Alternatively, you can also safely ignore the deprecation warning for /Gm as it will not be treated as error when using "Treat warnings as errors" (/WX).
The C++ Android experience now defaults to Android SDK 25 and Android NDK 16b.
Productivity
Code analysis now runs automatically in the background. Warnings display as green squiggles in-editor as you type.
The Template Bar now utilizes the Peek Window UI rather than a modal window, supports nested templates, and prepopulates any default arguments into the Peek Window.
An automatic fix-it for the NULL->nullptr code analysis warning (C26477 USE_NULLPTR_NOT_CONSTANT) is available via the lightbulb menu on relevant lines, enabled by default in the C++ Core Check Type Rules ruleset. Additional quick fixes in the IDE include adding missing #include directives, fixing missing semicolons, and fixing incorrect uses of '*' versus '&'.
Precompiled headers are no longer generated by default for C++ console and desktop apps.
Go to Definition now works on #include directives, opening the corresponding file. This includes the F12 shortcut, providing an easy way to navigate around your code.
Hovering over a closing brace of a code block provides some helpful information about the context of that block.
We've added support in ConcurrencyChecker for well-known STL types from the <mutex> header.
An updated partial implementation of the Lifetime profile checker is available for detecting dangling pointers and references.
We've added initial support in the compiler for the C++20 operator <=> ("spaceship") for three-way comparison.
CMake
We've improved performance of IntelliSense for C++ files in CMake projects.
Visual Studio helps bootstrap your C++ development with CMake on Linux by detecting if you have a compatible version of CMake on your Linux machine. If not, it offers to install it for you.
The CMake Settings Editor provides an alternative to CMakeSettings.json and provides some parity with CMakeGUI.
The CMake menu has been removed and reorganized for closer parity with projects and solutions.
Incompatible settings in CMakeSettings, such as mismatched architectures or incompatible CMake generator settings, show squiggles in the JSON editor and errors in the Error List.
The vcpkg toolchain is automatically detected and enabled for CMake projects that are opened in the IDE once vcpkg integrate install has been run. This behavior can be turned off by specifying an empty toolchain file in CMakeSettings.
CMake projects now enable Just My Code debugging by default.
Static analysis warnings can now be processed in the background and displayed in the editor for CMake projects.
We've added clearer build and configure 'begin' and 'end' messages for CMake projects and support for Visual Studio's build progress UI. Additionally, there is now a CMake verbosity setting in Tools > Options to customize the detail level of CMake build and configuration messages in the Output Window.
The 'cmakeToolchain' setting is now supported in CMakeSettings to specify toolchains without manually modifying the CMake command line.
Backend
We've implemented build throughput improvements, including the linker's handling of File I/O and link time in PDB type merging and creation.
We've added basic support for OpenMP SIMD vectorization. This can be enabled with the new CL switch -openmp:experimental. This allows loops annotated with “#pragma omp simd” to potentially be vectorized. The vectorization is not guaranteed, and loops annotated but not vectorized will get a warning reported. If no SIMD clauses are supported, they will simply be ignored and a warning will be reported.
We've added a new inlining command line switch -Ob3, which is a more aggressive version of -Ob2. -O2 (optimize the binary for speed) still implies -Ob2 by default; if you find the compiler is under-inlining, consider passing -O2 -Ob3.
To support hand vectorization of loops containing calls to math library functions and certain other operations like integer division, we've added support for Short Vector Math Library (SVML) intrinsic functions that compute the 128-bit, 256-bit or 512-bit vector equivalents. See the Intel Intrinsic Guide for definitions of the supported functions.
New and improved optimizations:
Constant-folding and arithmetic simplifications for expressions using SIMD (vector) intrinsics, for both float and integer forms
A more powerful analysis for extracting information from control flow (if/else/switch statements) to remove branches always proven to be true or false
Improved memset unrolling to use SSE2 vector instructions
Improved removal of useless struct/class copies, especially for C++ programs which pass by value
Improved optimization of code using memmove, such as std::copy or std::vector and std::string construction
Deprecations
The Managed C++ Test Project template is no longer available. You can continue using the Managed C++ Test framework in your existing projects but, for new unit tests, consider using one of the native test frameworks for which Visual Studio provides templates (MSTest, Google Test) or the Managed C# Test Project template.
The Windows 8.1 SDK is no longer available in the Visual Studio installer. Please upgrade your C++ projects to the latest Windows 10 SDK. If you have a hard dependency on 8.1, you can download it from the Windows SDK archive.
Windows XP targeting will no longer be available for the latest C++ toolset. XP targeting with VS 2017-level MSVC compiler & libraries is still supported and can be installed via "Individual components".
Our documentation actively discourages usage of Merge Modules for Visual C++ Runtime deployment. We are taking the extra step this release of marking our MSMs as deprecated. Consider migrating your VCRuntime central deployment from MSMs to the redistributable package.
The following C++ ATL/MFC wizards are no longer available: ATL COM+ 1.0 Component Wizard, ATL Active Server Pages Component Wizard, ATL OLE DB Provider Wizard, ATL Property Page Wizard, ATL OLE DB Consumer Wizard, MFC ODBC Consumer, MFC class from ActiveX control, and MFC class from Type Lib. Sample code for these technologies is archived at the VCSamples GitHub repository.
F#
F# improvements in Visual Studio 2019 are in three major areas:
F# 4.6
Major performance improvements for medium and larger solutions
Lots of open source work by our excellent open source community
F# 4.6
This release contains the F# 4.6 language:
Anonymous Record types have been added to the language, including full tooling support and the ability to emit them types into JavaScript objects via the Fable compiler.
The F# and compiler and FSharp.Core have seen numerous improvements, especially from open source contributors:
fsi.exe and fsc.exe now defaults to .NET Framework 4.7.2, allowing the loading of components targeting this framework or lower (#4946).
We optimized methods on structs and struct records to perform as well as methods on classes and class-based records (#3057).
We optimized the emitted IL for combined Boolean logic in F# code (#635).
We've optimized the use of + with strings in F# to call the minimal amount of String.Concat calls as possible (#5560).
We fixed an issue in the FSharp.Core package where some extra directories with test assets were included. FSharp.Core 4.5.5 and 4.6.1 should have the fix (#5814).
When a user-defined attribute does not inherit from the Attribute class, you will now receive a warning, by Vasily Kirichenko.
The AssemblyInformationVersionAttribute value in a project file now supports arbitrary values to support scenarios such as SourceLink (#4822).
A bug where illegal syntax with Active Patterns would cause an internal compiler error has been fixed by Steffen Forkmann (#5745).
A bug where the Module suffix was erroneously added to a module in a recursive module to match a type where the only difference is a generic parameter was fixed by BooksBaum (#5794).
An improvement to the error message when type parameters are not adjacent to a type name has been improved by Alan Ball (#4183).
The uint16 literal suffix is listed correctly in the error messages for invalid numeric literals, by Teo Tsirpanis (#5712).
Error messages for computation expressions no longer state async in the message and instead refer to "computation expression(s)", by John Wostenberg (#5343).
An error message when incorrectly referencing .dlls in F# interactive was fixed by Bartoz Sypytkowski (#5416).
A bug where Statically Resolved Type Parameters couldn't handle calling a member that hides an inherited member was fixed by Victor Peter Rouven Müller (#5531).
Another big focus area for F# in Visual Studio 2019 has been performance for medium and large solutions. We addressed some very long-standing issues, some of which dating back to the very first edition of F# tools for Visual Studio. We also got some help from the excellent F# open source community.
We've revamped how the F# language service is initialized by Roslyn. Type colorization for larger solutions should generally appear sooner.
We changed our representation of source text to avoid large allocations over time, especially with bigger files (#5935, #5936, #5937, #4881).
We changed our build caches for small edits to files to use significantly less memory (#6028).
We modified a compiler feature that suggests names when unrecognized tokens are typed to only compute these suggestions on-demand, resulting in significant CPU and memory reductions when typing slowly in larger solutions (#6044).
We changed IntelliSense so that it will no longer show symbols from unopened namespaces by default. This notably improves performance for IntelliSense in projects with many references. This feature can be turned back on in the settings via Tools > Options > Text Editor > F# > IntelliSense.
We improved memory usage when using Type Providers to generate very large amounts of provided types in a completion list (#5599).
A reduction to CPU and memory usage to an internal string comparison algorithm for suggesting unrecognized names has been fixed by Avi Avni (#6050).
A notable source of large string allocations, particularly for IDE tooling, was fixed by Avi Avni (#5922).
A notable source of Large Object Heap allocations coming from computing IntelliSense has been fixed by Chet Husk (#6084)
F# tooling improvements
In addition to performance improvements, various other improvements to F# tooling for Visual Studio 2019 have been made:
The Add open statement code fix will now default to adding the open statement at the top of the file.
We fixed a bug where match! in user code invalidated structure guidelines and code outlining nodes for subsequent scopes (#5456).
The editor will now correctly color byref, outref, and ref values as record fields with the mutable value colorization (#5579).
We fixed a bug where the rename refactoring did not recognize the ' character in symbol names (#5604).
We've fixed a longstanding bug where renaming F# script files resulted in a loss of colorization data (#1944).
We cleaned up IntelliSense so that it doesn't show unrelated items in the list when pressing backspace.
With "Smart" indentation on, pasting F# code into the editor will now format it to match an appropriate scope based on the current cursor position, implemented by Saul Rennison (#4702).
An issue where F# editor options weren't syncing has been fixed by Jakob Majocha (#5997, #5998).
A bug where IntelliSense in a constructor within an inherit clause wouldn't show the primary constructor has been fixed by Eugene Auduchinok (#3699)
Various smaller improvements to the F# language service have been made by Eugene Auduchinok
F# open source infrastructure
We've fully migrated the F# and F# tools codebase to use the .NET SDK. This dramatically simplifies the contribution process for developers, especially if they are not using Windows. Additionally, Jakob Majocha has helped in cleaning up documents for new contributors in light of the changes to the codebase.
Python
Based on customer feedback, Visual Studio 2019 includes an overhauled experience for managing Python environments:
We added a new Add environment dialog that simplifies the experience of creating and adding virtual environments and conda environments in your project.
The Visual Studio installer no longer installs full versions of Anaconda to reduce the size of Visual Studio installs and avoid errors during upgrades.
Miniconda is bundled with Python workload as an optional component, enabling you to create conda environments without having to install Miniconda/Anaconda.
You will now be automatically prompted to add an environment if a requirements.txt (virtual environment) or environment.yml (conda environment) is present at the root of your project.
A new Python Environments toolbar is available when editing Python files. The new toolbar enables you to switch between different Python interpreters when working with projects, Open Folder workspaces or loose Python files in other projects.
Improvements to the quality of auto-completions in Python IntelliSense, including improved detection of relative and namespace imports.
Django project templates have been updated to support Django 2.x.
Function return values are now shown in the Python debugger.
You can now create VS Live Share sessions and collaborate on Python code with other Visual Studio users. Previously, Python was only supported when joining sessions created from Visual Studio Code.
JavaScript/TypeScript
We have added support for enabling JavaScript debugging within unit tests in Node.js projects. This was a long-requested feature from our Node.js customers.
The JavaScript/TypeScript language service will now be automatically loaded in projects that have the TypeScript NuGet package or npm package installed (TypeScript 3.2 and up is supported from the NuGet package and TypeScript 2.1 and up is supported from the npm package).
We have implemented performance improvements in the language service as a result of increasing the memory cap on the language service to handle larger projects.
We no longer show diagnostics of closed JavaScript/TypeScript files in the error list by default.
The legacy JavaScript language service is no longer available. Previously, users had the option of restoring the legacy JavaScript language service. Users will now have the new JavaScript language service out-of-the-box. The new language service is based on the TypeScript language service, which is powered by static analysis. This enables better tooling, so your JavaScript code can benefit from richer IntelliSense based on type definitions. The new service is lightweight and consumes less memory than the legacy service, providing users with better performance as their code scales.
Team Explorer and Azure DevOps
We have made improvements to the Git Work Items experience with Azure DevOps.
Assign work items to yourself or others with the new identity picker. By default, you will be shown a list of the people you have most recently used. Or, use the search ability to search and find others in your organization.
We have improved the #mentions experience in the commit message. As you select a work item from the #mention picker, it will automatically be added to the Related Work Items list.
Assigning work items and #mention improvements
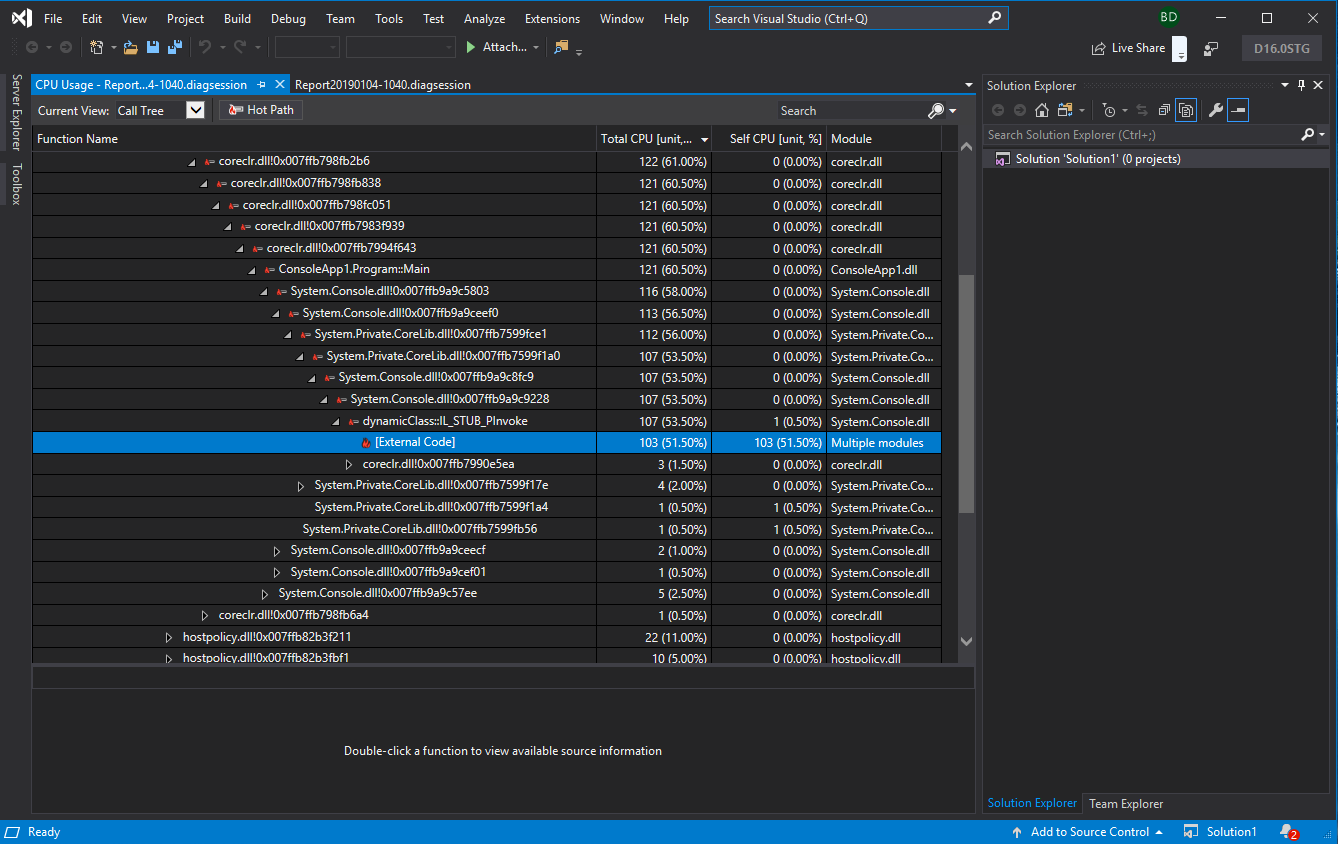
Hot Path Highlighting
We have added support for hot path highlighting in both the CPU Usage and DotNet Object Allocation tools in the Performance Profiler. Select any function in the call tree and press the hot path button to expand the CPU Usage or Dot Net Object Allocation hot path. This feature allows you to easily identify the function calls which use the highest percentage of the CPU or that allocate the most objects.
Hot path highlighting in the CPU Usage tool
.NET and ASP.NET Tools
We have implemented various small UX improvements to the publish profile summary page (new section headers and actions/shortcuts) for all applications.
When publishing ASP.NET applications to Azure App Service, the publish profile summary page now has a new section called "Dependencies". This new section currently allows you to associate Azure Storage and Azure SQL resources with your app service instance. Expect more Azure services to be surfaced through this mechanism in the future.
Use code metrics with .NET Core projects with our added compatibility.
Export editor settings to an Editorconfig file through Tools > Options > Text Editor > C# > Code Style with the button "Generate .editorconfig file from settings".
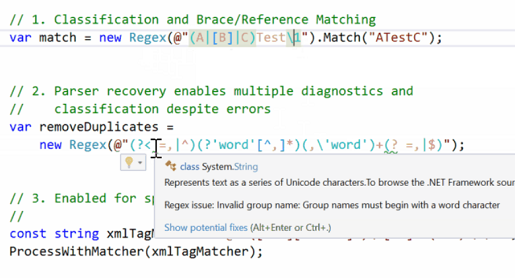
Use C# and Visual Basic's new Regex parser support. Regular expressions are now recognized, and language features are enabled on them. Regex strings are either recognized when a string is passed to the Regex constructor or when a string is immediately preceded with a comment containing the string language=regex. The language features included in this release are classification, brace matching, highlight references, and diagnostics.
Regular Expression Parser Support
You can now use dead code analysis for unused private members with an optional code fix to remove unused member declaration.
The Find References feature on an accessor now only returns results for that accessor.
We have added a code fix for generating a deconstruct method.
"Using" statements can be added when code is pasted into a file. A code fix appears after pasting recognized code that prompts you to add relevant missing imports.
There are now more refactoring and quick actions available by using "Ctrl + ." or "Alt + Enter":
For cases where "await" is implied but omitted, there is now a compiler warning.
For converting a local function to a method.
For converting a tuple to a named-struct.
For converting an anonymous type to a class.
For converting an anonymous type to a tuple.
For a foreach loop to LINQ query or to LINQ method.
You now have added support for ASP .NET Core applications running in an Azure Kubernetes Service. To get started, see this docker example over on GitHub.
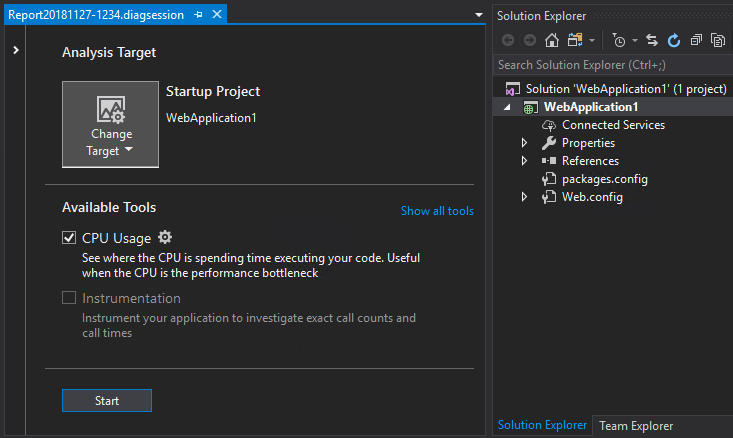
ASP.NET is now supported in the CPU Usage tool of the Performance Profiler.
CPU Usage Tool in Performance Profiler
You can now use Find All References (Shift-F12) and CodeLens to show results from Razor (.cshtml) files in .NET Core projects. You can then navigate to the identified code in the relevant Razor files.
We've added support for targeting ASP .NET (core and desktop) applications running on Windows Virtual Machines (VM) and VM Scale Sets.
Snapshot Debugger Target Selection UI
You will now receive a warning when running code analysis using FxCop. .NET Compiler analyzers are the recommended way to perform code analysis going forward. Read more on migrating to .NET compiler platform analyzers.
Portable Class Library (PCL) project templates are no longer available, and project support will not be installed by default. New projects intended to target multiple platforms should use the .NET Standard project type. Customers who require PCL project support must install the component separately from the Individual Components tab in the Visual Studio installer.
The "Project.CopyWebSite" command is no longer available. This feature was only available on the "Web Site" project type for .NET. It provided the ability to synchronize two web sites so that they have the same version of each file. In Visual Studio 2019, you can copy the files from the remote destination outside of Visual Studio and then open the project.
The ability to open a Web Site project from a remote FTP location has been removed. FTP users can copy the files from the remote destination outside of Visual Studio, open the project and make changes, and then use publish to push them back to the remote FTP location.
The ASP.NET and Web workload no longer installs a custom CoffeeScript editing experience. Visual Studio's TextMate bundles provide a superior experience for working with CoffeeScript.
CSS and CoffeeScript errors that are currently generated by built-in copies of CSSLint and CoffeeLint will no longer automatically surface when editing those files. Use an alternative method for running linters such as npm or the Visual Studio Task Runner Explorer.
Visual Studio no longer provides IntelliSense for Knockout HTML attributes. In Visual Studio 2019 you will need to type the attributes.
The ability to use the Legacy Chrome debugger in ASP.NET projects for debugging JavaScript has been removed. You can continue to use the current Chrome debugger built into Visual Studio.
The ability to use JavaScript Console functionality in ASP.NET projects has been removed. We recommend that customers use Console included within their favorite browser devtools.
Container Tools
We've added a streamlined single-project experience for containerizing and debugging:
ASP.NET Web Applications (.NET Framework)
Console Applications (.NET Core)
We've added support for debugging ASP.NET Core Applications that use Alpine as a base image.
We've added support for the latest ASP.NET and .NET Core images.
.NET Core tools
.NET Core 3.0
With this release, you can create ASP.NET Core, Console, and Class Library projects targeting .NET Core 3.0 if you have the preview SDK installed.
If you are using Visual Studio RC, you need to also go to Tools > Options > Projects and Solutions > .NET Core and check the Use previews of the .NET Core SDKs checkbox. If you are using Visual Studio Preview, you do not need to do this. You can read more about this setting and its behavior in .NET Core tooling update for Visual Studio 2017 version 15.9.
You can also create Windows Forms or WPF projects for .NET Core 3.0 with the "dotnet new" command. These projects can then be opened in Visual Studio 2019.
New features
Starting with this release, we are making project files for .NET SDK-style projects a first-class file type in Visual Studio. The following is now supported:
Double-click a project node to open the project file
Single-click the project node to open the project file in a Preview tab
Find a project file by name with Go to All (ctrl + T)
MSBuild elements in a project file now are searchable with Find in Files
Opening from the error list if a project authoring error is triggered
Additionally, .NET SDK-style projects will now use the new Integrated Console experience for F5 and ctrl + F5 on console apps. This unifies the experience when launching console applications from Visual Studio:
For F5, the console window will not automatically close when the app is finished executing. You no longer need to add Console.Read() calls to your console apps.
For ctrl + F5, the console window will be re-used in subsequent runs of your app. You no longer need to close loads of console windows.
The new console window can be closed automatically by pressing a key when it is open or by selecting the option under Tools > Options > Automatically close the console when debugging stops.
Invert conditional expressions and logical operations
Automatically close block comment on “/”
Convert to compound assignment
Fix Implicitly-typed variables cannot be constant
Auto-fixer to replace @$" with $@" when typing interpolated verbatim string
Completion for #nullable enable|disable
Fix for unused expression values and parameters
Fix for allowing Extract Interface to remain in the same file
Categorize references by Read/Write.
Add Editorconfig when_multiline option for csharp_prefer_braces.
New classification colors are available from the .NET Compiler Platform SDK (aka Roslyn). New default colors, similar to the Visual Studio Code colors, are gradually being rolled out. You can adjust these colors in Tools > Options > Environment > Fonts and Colors or turn them off in Environment > Preview Features by unchecking the Use enhanced colors check box. We’d appreciate hearing feedback on how this change affects your workflow.
New Roslyn classification colors
JavaScript Debugging in ASP.NET projects
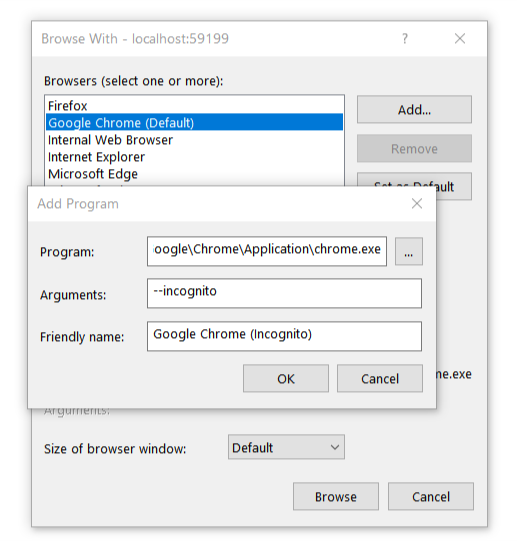
If you have added a new Google Chrome browser with custom arguments using the "Browse with..." menu for your ASP.NET project, Visual Studio will now enable JavaScript debugging for your application when debugging is started. Your custom launch arguments for Google Chrome will be applied when launching Chrome.
Adding Google Chrome with Custom arguments using 'Browse with...'
Note: Visual Studio, by default, will launch Chrome using a different data directory than your regular Chrome instance unless you provide the path to your data directory as an argument. As a result, if you require any extensions to be available when using this Chrome instance, you will need to install them the first time.
ASP.NET & Azure Functions tooling
Visual Studio 2019 comes with a new experience for creating new projects. When creating new ASP.NET projects specifically, Visual Studio offers additional dialogs that surface ASP.NET specific choices. These additional dialogs have been updated to match the visual style of the rest of the experience.
For a while now, publish credentials in Visual Studio are encrypted and stored in the publish profile user file so you don't have to re-enter them every time you publish your application. User files in general are excluded from source control by default because they are likely to contain secret and/or personal information that should not be shared. Up until now, if a publish profile for an Azure Functions project was checked into source control but the user file was not, the publish credentials were missing and the publish profile could not be re-used. Now, we allow for the credentials to be edited and a new user file to be created so that the publish profile can be re-used.
Performance Wizard
In Visual Studio 2019, the profiling experiences that were available in the Performance Wizard have been moved to the Performance Profiler. You can find the CPU Usage Tool for sampling, and instrumentation in the Instrumentation tool in the Performance Profiler. With this change the Performance Wizard is no longer needed and has been removed from Visual Studio 2019. Additionally, the sampling option in the VS Performance command line tools have been removed, a replacement command line tool will be released in an upcoming preview.
Test Tools
You can now right-click on tests, test classes or test projects in the Solution Explorer to run or debug tests.
Test runs now auto-detect what processor architecture is set in the project properties.
OSS UI test tools such as Selenium and Appium have gained momentum and have a strong community backing. Because these frameworks have become industry standards, we deprecated Coded UI test for automated UI-driven functional testing. Visual Studio 2019 will be the final version of Visual Studio with Coded UI test features. We recommend using Selenium for testing web-applications and Appium with WinAppDriver for testing desktop and UWP apps.
Visual Studio 2019 will be the last version of Visual Studio with load test features. For customers requiring load testing tools, we recommend using alternate load testing tools such as Apache JMeter, Akamai CloudTest, Blazemeter.
In Visual Studio 2019, some test window APIs that were previously marked public but were never officially documented have been removed. They were marked deprecated in Visual Studio 2017 to give extension maintainers an early warning. To our knowledge, very few extensions have taken a dependency on these APIs. These APIs include IGroupByProvider, IGroupByProvider, KeyComparer, ISearchFilter, ISearchFilterToken, ISearchToken and SearchFilterTokenType. If this change affects your extension, please let us know by submitting an issue on Developer Community.
Visual Studio Kubernetes Tools
The Visual Studio Kubernetes Tools, which were previously available as a separate extension for Visual Studio 2017, are now integrated into the Azure development workload in Visual Studio 2019.
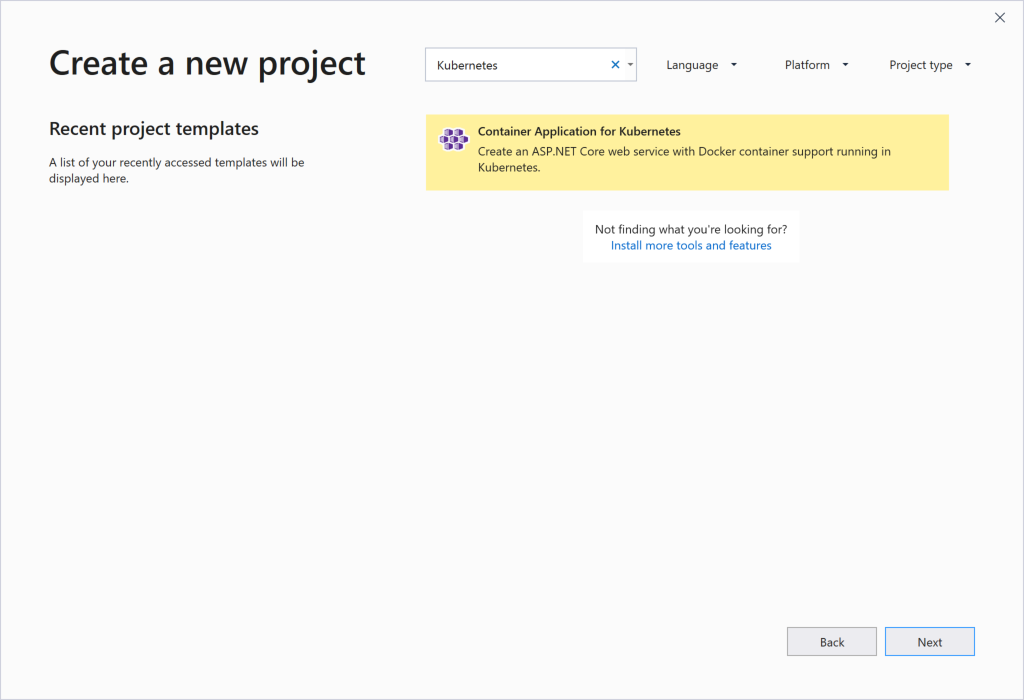
Adding Kubernetes support to a new project
To add Kubernetes support to a new project, open Visual Studio and select the Create a new project option. In the Create a new project window, search for Kubernetes and select the Container Application for Kubernetes project template.
Creating a Container Application for Kubernetes
Click Next and enter a project name, location, and solution name. Then, click Create. Select the ASP.NET Core application template you want to use for your project and click OK.
Visual Studio will automatically create a Dockerfile and Helm chart that you can use to build and deploy your new application to a Kubernetes cluster. You can modify these artifacts as needed.
Adding Kubernetes support to an existing project
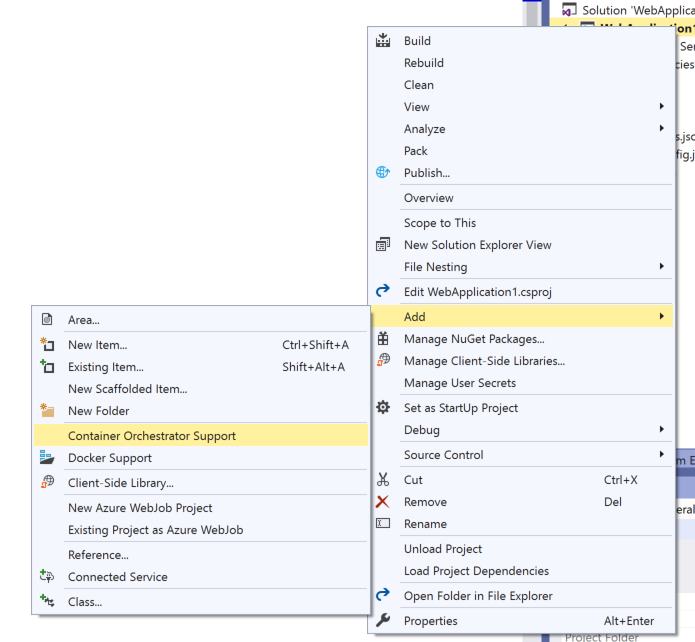
You can also add support for Kubernetes to an existing ASP.NET Core application. To do this, open the project in Visual Studio 2019. In Solution Explorer, right click on the project, point to Add, and click Container Orchestrator Support.
Adding container orchestrator support
In the Add Container Orchestrator Support dialog, choose Kubernetes/Helm and click OK.
Visual Studio will automatically create a Dockerfile and Helm chart (in a folder named charts) that you can use to build and deploy your application to a Kubernetes cluster. If either of these artifacts are already in place, they will not be overwritten. You can modify these artifacts as needed.
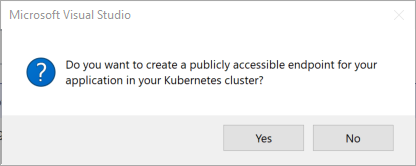
Creating a publicly accessible endpoint
When you add Kubernetes support to a new or existing project, Visual Studio will ask you if you want to create a publicly accessible endpoint for your application.
Publicly accessible endpoint prompt
If you click Yes, Visual Studio will configure the Helm chart for your application to create a Kubernetes ingress object when the application is deployed to a Kubernetes cluster. You can change this option at any time by modifying the Helm chart.
Debugging your application in Azure Kubernetes Service
Once you have added Kubernetes support to a new or existing project, you can easily build, run, and debug your application in a live Azure Kubernetes Service (AKS) cluster, using a feature called Azure Dev Spaces. This is useful for testing your project in the context of an actual Kubernetes cluster or for debugging a service that is part of a much larger application without having to replicate the entire application locally. Azure Dev Spaces also includes functionality that allows your development team to share an AKS cluster. For more information on Azure Dev Spaces, see the Azure Dev Spaces documentation.
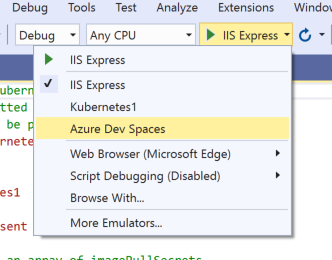
To get started, ensure that Azure Dev Spaces is selected as the debug launch target in Visual Studio.
Selecting Azure Dev Spaces as debug launch target
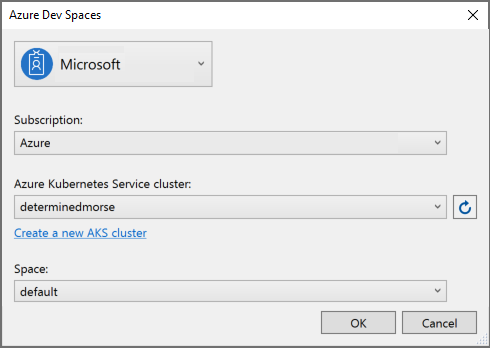
Before launching your project in Dev Spaces for the first time, configure the Azure subscription and AKS cluster that you wish to use. Also, select the space where you wish to run the project.
Configuring Azure Dev Spaces
Typically, your team runs the latest stable version of the entire application in the default space. Then, you run your version of the service you are working on in a child space of the default space. There is now no need to run the other services in the child space; Dev Spaces automatically routes calls from your service to the stable versions of the services running in default. For more information on how to set this up, see the team development tutorials in the Azure Dev Spaces documentation.
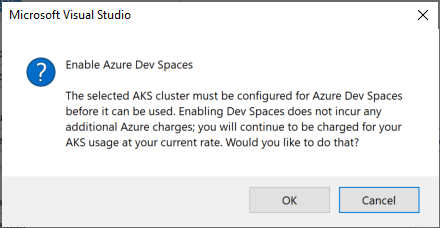
Once you have selected the correct subscription, cluster, and space, click OK to proceed with the Dev Spaces configuration. If you select a cluster that does not already have an associated Dev Spaces controller, click OK in the following dialog box to create one automatically.
Enable Dev Spaces dialog
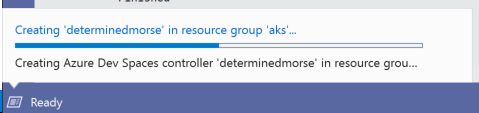
Controller creation takes about 2 minutes. You can click on the Background Tasks button in the lower left corner of the Visual Studio window to see the status.
Azure Dev Spaces controller creation status via Background Tasks
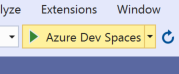
Once you have a Dev Spaces controller ready to go, press F5 or click the Azure Dev Spaces debug button on the toolbar to debug your project in AKS.
Azure Dev Spaces debug button
Dev Spaces will synchronize your code to Azure, build a container image containing your code, and deploy it to your AKS cluster using the Helm chart defined in your project. Visual Studio will open up a remote debug connection to the service running in the cluster so you can interact with it just as you would when debugging a service running locally.
Mobile Development with Xamarin
This release includes improvements to workload size and Android build performance and reliability, as well as enhancements for Xamarin.Android and Xamarin.Forms productivity.
The Xamarin workload is now just 7.69GB, a 2x reduction from Visual Studio 2017 version 15.9 and a 3x improvement over version 15.7.
The IntelliCode extension now supports Xamarin.Forms XAML.
File > New Project
We made performance improvements aimed at reducing the time it takes to create a new Xamarin project so you can start building your apps faster. We also now include the NuGet packages used by the templates as part of the workload installation in order to reduce package restore time, especially in low bandwidth or offline situations. These improvements reduce the time for a new Xamarin project to be completely loaded and restored by almost 50% in some cases.
Creating a new Xamarin project in Visual Studio version 15.9 (left) and Visual Studio 2019 (right)
Build progress indicator
You can now see more detailed build progress information when building your projects. Clicking the background tasks icon in the bottom left corner during a build will display the current build target that is running. This can be useful for determining if the build is still running but a target is taking a long time to complete.
Xamarin build progress indicator
Xamarin.Forms Previewer's Basic Preview mode
You no longer have to build your project for the Xamarin.Forms XAML Previewer to show you a preview of your code! If you have custom controls in your XAML file, you might need to build your project to preview those, or opt them into design time rendering.
Xamarin.Forms Previewer device drop-down
You can now swap between different Android and iOS devices to preview your Xamarin.Forms XAML on using our new device drop-down menu.
Xamarin.Forms Device Drop-Down
Xamarin.Forms Property Panel
You can now edit the most common attributes of Xamarin.Forms controls, cells, and layouts in a property panel and see those changes reflected immediately in your XAML.
Xamarin.Forms Property Panel
Xamarin.Forms Shell template
We updated the Xamarin.Forms templates to use the latest Xamarin.Forms release and also added a new template option for a Xamarin.Forms Shell app. Shell aims to reduce the complexity of apps while increasing developer productivity and focusing on rendering speed and memory consumption. This template gives you a bootstrapped Shell app for Android and iOS.
*Android Build Now Faster than Grabbing a Cup of Coffee*
You will now make use of Android's next generation packaging tooling. To enable this feature, add an MSBuild flag in your project's .csproj:
aapt2 divides Android packaging into two steps: Compile and Link. This improves performance for incremental builds and provides earlier error reporting. For example, if there are changes in a single file, you only need to recompile that file.
<AndroidUseAapt2>True</AndroidUseAapt2>
By enabling this tool in your projects, you enable enhanced performance at both build time and runtime. For more details on these properties, see our documentation on the Build Process in Xamarin.Android.
Android Emulator improvements
In Visual Studio 2019, Android emulator images are easier to create. We've also continued to work with the Windows team in the Windows 10 October 2018 Update, version 1809, to improve the performance of the Android emulator when running on Hyper-V.
New users can create their first image by simply pressing the run icon.
Our emulator acquisition experience automatically determines the best configuration for your setup and takes advantage of hardware acceleration (with Intel HAXM or Hyper-V) and quick boot by default.
When you want to create another image, you can select Create Android Emulator from the dropdown to open the Android Device Manager.
Speed up your build times with our improvements for build in Xamarin.Android
Fast Deployment has up until now provided faster incremental deployment times by skipping over rebuilding or redeploying the Android package (.apk file) in scenarios where no changes have been made to any assets, resources, shared native libraries packaged within the app, or user-defined classes that inherit from Java.Lang.Object.
Enhanced Fast Deployment expands support for fast deployment to cover both shared native libraries and classes that inherit from Java.Lang.Object. Fast deployment builds that use these new enhancements will only need to generate a new .apk file in a limited number of scenarios, such as when the AndroidManifest.xml file changes due to addition of a new Android.App.Application or Activity subclass.
These enhancements are not yet enabled by default in the current preview. To enable them, set the $(AndroidFastDeploymentType) MSBuild property to Assemblies:Dexes in your .csproj file:
Next-generation Dex Compiler(d8) and Code Shrinker(r8) support in Xamarin.Android
Xamarin.Android now supports the latest Android dex compiler(d8) and code shrinker (r8).
To enable these features, set the $(AndroidDexTool) and $(AndroidLinkTool) MSBuild property to d8 and r8 respectfully in your .csproj file
d8 is a next-generation dex compiler that runs faster and produces smaller .dex files with better runtime performance.
For more details on d8 and r8, check out our documentation.
Xamarin.Android Designer enhancements
We have made a number of productivity enhancements to the interactions in Split View.
Drag and drop directly from the toolbox to the source editor to help quickly scaffold your Android layouts.
Select elements directly from their XML definition span in the source editor. We implemented this by synchronizing the caret position with the corresponding Android view, allowing you to quickly access an element's properties in the property panel right from the editor.
Use an inline color preview to your XML code so you can see what colors are being used in your controls.
Use our quick info feature by hovering over a value to find out more about it, such as where it's defined or what the hexadecimal value for the color is.
*Quick Info in Action*
Xamarin.Android Designer improvements with initial support for constraint layouts
We’ve begun an effort to improve startup speed of the Android Designer. As part of this effort, we have also improved the messaging that the designer provides while it is loading.
Alongside these improvements, the Android Designer now natively supports Android Pie (9.0) and provides autocompletion for ConstraintLayout attributes.
Get better XML IntelliSense and Commenting optimizations with the Xamarin.Android Designer
When using IntelliSense to add a widget to a layout, a full snippet experience is now provided so that required attributes can be supplied from the start.
We have added smart commenting and uncommenting for Android XML layouts.
Be more productive by using Go-To-Definition and use XML IntelliSense within Android resource files and AndroidManifest.xml
You can now Ctrl + Click on resource URLs to navigate to the file or line where they are defined.
IntelliSense/Autocompletion is now supported for other Android XML files other than layouts (colors, strings, drawables, menu, Android manifest, etc.).
Universal Windows Platform
The IntelliCode extension now supports XAML.
To reduce Visual Studio setup complexity and size, Windows Phone emulators have been removed from Visual Studio installation. You will now need to download the emulators manually.
XAML design time tooling for UWP apps targeting Windows 10 SDKs before the Windows 10 Fall Creators Update (build 16299) has been removed. Retarget your applications to Windows 10 version 1709 or higher to use the XAML Designer, or use the XAML editor.
UWP test projects using project.json to define NuGet dependencies are no longer supported. You must upgrade your project to use the new PackageReference format.
You can continue to attach to JavaScript UWP apps as before, however the JavaScript profiling tools (Network ,CPU and Memory Profiler) are no longer available in Visual Studio 2019.
Office Tools Template Updates
In Visual Studio 2019, we made a few changes to the Office, SharePoint, and VSTO templates.
The SharePoint 2019 templates that were added in Visual Studio 2017 15.9 are also available in Visual Studio 2019.
We have removed support for SharePoint Sequential Workflow or State Machine Workflows. While you will not be able to create or open these workflows in Visual Studio 2019, you can continue to edit them in previous releases of Visual Studio.
Office 2010 templates will no longer be available. However, you can still open existing Office 2010 projects in Visual Studio 2019.
The Office 2013 and 2016 templates have been renamed to reflect that they support Office 2013 and above.
Team Explorer and Azure DevOps
We are releasing a new, streamlined, developer-centric experience when connecting Team Explorer to an Azure DevOps project.
Focus on relevant work items by filtering and pivoting your view based on work items assigned to you, ones that you're following, ones where you're mentioned in the discussion, and ones based on your activity.
Within each view, you can create a work item inline, perform simple inline edits, mark a work item as complete, and associate a work item to pending changes.
Create a local branch from a work item which will automatically relate the work item to the changes made to that local branch. This is the default experience. Should you want to switch to the legacy experience, you can by setting the Work Items experience in Visual Studio.
Note that this new experience is only true for Git repos. The new experience for TFVC repos will available in a following update.
Support for Microsoft Project has been removed from the Team Foundation Server Office Integration 2019 plug-in for Visual Studio 2019 due to a low adoption rate in Azure DevOps. You will now need to export your work items to Excel and manually paste them into Project.
Support for PowerPoint has been removed from the Team Foundation Server Office Integration 2019 plug-in for Visual Studio 2019. However, users can still create storyboards in PowerPoint and link them manually to work items in Azure DevOps.
Application Insights and HockeyApp
The Application Insights Trends window has been removed in Visual Studio 2019 in favor of alternatives that are more feature-rich. Instead, you can use the Application Insights Search window in Visual Studio or the rich set of diagnostics tools in Application Insights in the Azure portal.
The wizards for adding the HockeyApp SDK and creating new beta distributions have been removed. We instead recommend using Visual Studio App Center, the successor to HockeyApp. You can still use HockeyApp normally, except without these shortcuts in Visual Studio.
SSDT: Fix to improve performance of loading solutions with multiple projects.
SSDT: Fix for SQL files not always being deleted when performing a Schema Compare between a database and a project and a delete table is executed subsequently.
SSDT: Accessibility fixes to improve narration capabilities.
SSDT: Replaced older sqlncli driver with new Microsoft ODBC Driver for SQL Server.
We have fixed slow reload of multiple C# and Visual Basic projects.
When IntelliSense is present, when a user types Shift + Enter, the active selection will be completed and a new line inserted.
We have fixed a PMA issue where editor tooltips and light bulb doesn't render properly.
Notifications about crashes caused by extensions now show up again.
Notifications about performance of Visual Studio have been secured against tampering.
We have fixed an issue with toolbar rendering when dragged across displays.
We have fixed an issue with Tools Options rendering when running with per-monitor awareness enabled.
Various DpiHelper classes has been deprecated (extensibility).
We have fixed splash screen scaling to better match the primary monitor scale factor.
We have fixed an issue in settings import where warnings/errors were not always reported correctly.
We have fixed an issue where Tools Options reported software rendering regardless of rendering tier.
We have fixed an issue where the name of the open folder was not displayed in the title bar region.
We have fixed an issue with find in files positioning when per-monitor awareness is enabled.
We have fixed an issue with dock adorner rendering when per-monitor awareness is enabled.
You can now use Time Travel Debugging with the snapshot debugger on ASP.NET Apps running on an Azure VM. Please note that this feature may not work in all Azure regions at release.
We have updated the Dockerfile scaffolding in Visual Studio Tools for Kubernetes to use the Microsoft Container Registry instead of Docker Hub.
We have fixed an issue in Visual Studio Tools for Kubernetes where modifying Dockerfile.develop does not cause the service to be redeployed.
We have fixed an issue in Visual Studio Tools for Kubernetes where a service in an Azure Dev Spaces project could fail to start.
We have fixed an issue in Visual Studio Tools for Kubernetes where a service in an Azure Dev Spaces project stops running after debugging is stopped in Visual Studio.
We have fixed an issue in Visual Studio Tools for Kubernetes where a null reference error dialog is sometimes displayed when picking accounts in the Azure Dev Spaces Dialog.
We have fixed an issue in Visual Studio Tools for Kubernetes where the cluster selection dialog is displayed when adding Kubernetes orchestration support.
We have fixed rendering of the Import and Export Settings Wizard when running per-monitor aware
We have fixed sizing of the New Project Dialog when running per-monitor aware
We have made a set of visual refinements to the start window
Known Issues
See all existing known issues and available workarounds in Visual Studio 2019 version 16.0 by following the below link.
Feedback and suggestions
We would love to hear from you! For issues, let us know through the Report a Problem option in the upper right-hand
corner of either the installer or the Visual Studio IDE itself. The icon is located in the upper right-hand corner.
You can make a product suggestion or track your issues in the Visual Studio Developer Community, where you can ask questions, find answers, and propose new features.
You can also get free installation help through our Live Chat support.
Blogs
Take advantage of the insights and recommendations available in the Developer Tools Blogs site to keep you up-to-date on all new releases and include deep dive posts on a broad range of features.