หมายเหตุ
การเข้าถึงหน้านี้ต้องได้รับการอนุญาต คุณสามารถลอง ลงชื่อเข้าใช้หรือเปลี่ยนไดเรกทอรีได้
การเข้าถึงหน้านี้ต้องได้รับการอนุญาต คุณสามารถลองเปลี่ยนไดเรกทอรีได้
The Query Profiler in the MSSQL extension for Visual Studio Code captures and monitors database activity in real time using Extended Events. You can observe live T-SQL activity, identify slow operations, and find performance bottlenecks during development.
Query Profiler supports SQL Server (on-premises or in cloud environments), Azure SQL Database, and SQL database in Fabric endpoints. You can monitor active sessions, review execution details, and understand how your application interacts with your database during development and testing.

Tip
Query Profiler is currently in preview and might change based on feedback. Join the community at GitHub Discussions to share ideas or report issues.
Features
Query Profiler in the MSSQL extension provides the following capabilities:
- Capture real-time query and database activity in a live events grid.
- Configure new profiling sessions with template selection and session naming.
- Control the session lifecycle with Start, Pause, Resume, Stop, and Clear Data actions.
- Run multiple concurrent profiling sessions and switch between them with the session selector.
- Filter captured events by text, database name, duration, and other fields.
- Toggle auto-scroll to follow the latest events or inspect older entries.
- Export captured events to CSV.
- Open and view existing
.xelfiles in a read-only Profiler grid. - Automatically select the appropriate template for Azure SQL Database targets (
Standard_Azure). - Works on Windows, macOS, and Linux across all supported Visual Studio Code platforms.
Prerequisites
- Install the latest version of the MSSQL extension for Visual Studio Code.
- An active connection to a supported SQL Server instance or Azure SQL Database.
- Appropriate server permissions. You need the
ALTER ANY EVENT SESSIONpermission (or equivalent) to start a profiling session.
Launch Query Profiler
You can launch Query Profiler from the Connections view or the Command Palette.
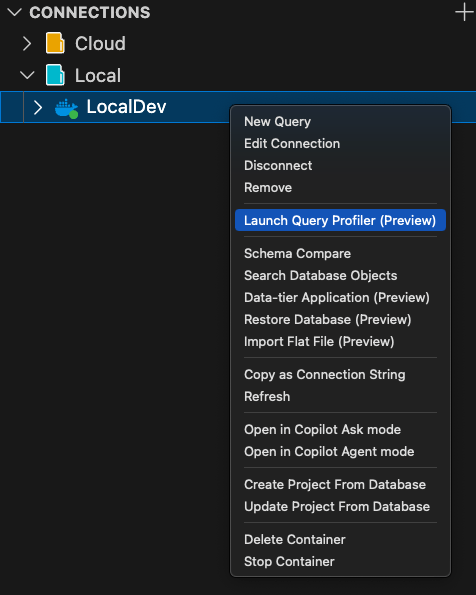
From the Connections view:
In the Connections view, right-click a SQL Server instance.
Select Launch Query Profiler (Preview).
From the Command Palette:
Open the Command Palette (Ctrl+Shift+P or Cmd+Shift+P).
Select MSSQL: Launch Query Profiler.
If no connection is currently active, select a connection when prompted.
The Query Profiler panel opens, tied to the selected connection.
Create a profiling session
When the Query Profiler panel opens with no active session, it shows the New Session screen.
Verify or change the Connection for the profiling session.
Select a Template from the dropdown list. Available templates depend on your connection target.
SQL Server (on-premises) templates:
Template Events captured Description Standard_OnPrem sql_batch_completed,sql_batch_starting,rpc_starting,rpc_completed,sp_statement_starting,sp_statement_completed,attention,existing_connection,login,logoutComprehensive profiling template that captures SQL batch and RPC activity, stored procedure statement-level events, and connection events. Provides the most detailed view of server activity. TSQL_OnPrem sql_batch_completed,sql_batch_starting,existing_connection,login,logoutLightweight template focused on T-SQL batch execution. Captures batch start and completion events without stored procedure or RPC detail, reducing overhead for scenarios where only top-level query activity is needed. TSQL_Locks sql_batch_completed,sql_batch_starting,lock_acquired,lock_released,existing_connection,login,logoutCaptures T-SQL batch events along with lock acquisition and release events. Useful for diagnosing blocking, deadlocks, and lock contention issues. TSQL_Duration sql_batch_completed(filtered: duration >= 1000 microseconds),sql_batch_starting,existing_connection,login,logoutCaptures T-SQL batch events but filters sql_batch_completedto only include batches that take 1 millisecond or longer. Useful for identifying slow queries while reducing noise from fast-executing statements.Azure SQL Database and SQL database in Fabric templates:
Template Events captured Description Standard_Azure sql_batch_completed,sql_batch_starting,rpc_starting,rpc_completed,attention,existing_connection,login,logoutStandard profiling template for Azure SQL Database. Captures SQL batch and RPC activity with connection events. Similar to Standard_OnPrem but without stored procedure statement-level events. TSQL_Azure sql_batch_completed,sql_batch_starting,existing_connection,login,logoutLightweight T-SQL profiling template for Azure SQL Database. Captures batch execution events without RPC or stored procedure detail. Note
Azure SQL Database and SQL database in Fabric templates create sessions scoped to the database (
ON DATABASE) rather than the server. Lock and duration-filtered templates aren't available for these connections.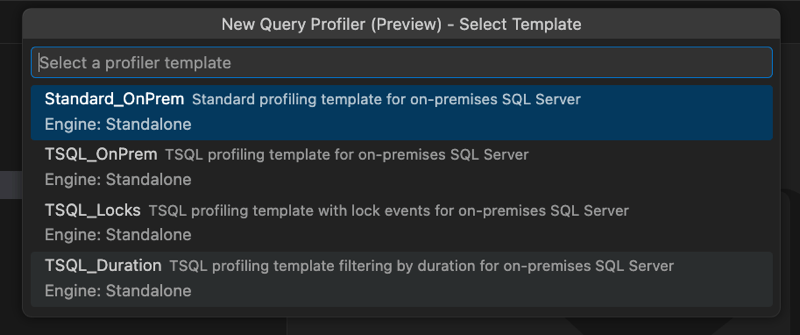
Enter a Session name. Press Enter to confirm or Escape to cancel.
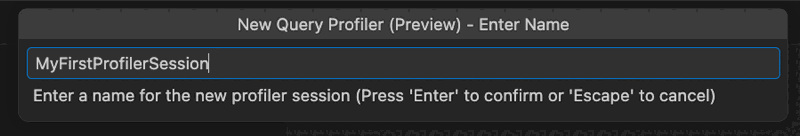


The panel transitions to the live events view, and a Profiler session is created through the SQL Tools Service.
Monitor live events
When you run a profiling session, the events grid streams captured events in chronological order. The grid displays the following columns based on the selected template:
- EventClass: Type of event captured, such as
sql_batch_startingorrpc_completed. - TextData: The T-SQL statement or event text.
- ApplicationName: The application that generated the event.
- LoginName: The login associated with the event.
- ClientProcessID: Client process identifier.
- SPID: Server process ID.
- StartTime: Timestamp of the event.
- CPU: CPU time consumed.
- Reads: Number of logical reads.
- Writes: Number of logical writes.
- Duration: Execution time of the event.
- DatabaseName: The database where the event occurred.
- HostName: The host machine that generated the event.
Toolbar actions
The toolbar provides the following controls for the active session:
| Action | Description |
|---|---|
| New Session | Opens the new session flow to create another profiling session. |
| Start | Resumes event streaming for a paused or stopped session. |
| Stop | Stops the profiling session. No new events arrive, but captured events remain visible for review, filtering, and export. |
| Pause | Temporarily stops updating the grid. The UI shows a Paused indicator. |
| Clear Data | Clears all rows from the current session's grid. If the session is still running, new events continue to populate the grid. |
| Clear All Filters | Removes all active column filters and restores the full event view. |
| Quick filter all columns... | Searches across all columns to quickly find matching events. |
| Export to CSV | Exports the current session's captured events to a CSV file. |
| Auto-scroll | Toggles whether the grid scrolls to the latest row when new events arrive. Auto-scroll is on by default for new sessions. |
Filter events
Use column filters to narrow the events grid and focus on relevant activity. Each column header includes a filter icon that opens a filter specific to that column's data type.
Filter by column values (for example, DatabaseName or ApplicationName)
Select the filter icon on a column header such as
DatabaseName.In the filter dropdown list, use the search box to locate values, or select and deselect specific entries from the checkbox list.
Select Apply to filter the grid. Select Clear to remove the filter for that column.


Filter by numeric values (for example, Duration)
Select the filter icon on a numeric column such as
Duration.Choose a comparison operator (for example,
=,>,<) and enter a numeric threshold.Select Apply to filter the grid.


When one or more filters are active, filter chips appear below the toolbar showing which columns are filtered. Select the X on a chip to remove that filter, or select Clear All Filters in the toolbar to reset all filters at once.

Note
Filters apply client-side to both the currently displayed events and new events streamed during the session.
Manage multiple sessions
Query Profiler supports running multiple profiling sessions concurrently, each with its own connection, template, and event buffer.
Select New Session from the toolbar to create another session. The new session can target the same or a different connection.
Use the Session selector dropdown list to switch between sessions. Each session displays its state (Running, Paused, or Stopped) with a visual indicator.
When you switch sessions:
- The events grid updates to show the selected session's captured events.
- The toolbar actions operate on the selected session.
Export captured events
You can export the captured events from a profiling session to a CSV file for offline review or sharing.
Select Export to CSV from the toolbar. Export is available whether the session is running, paused, or stopped.
Choose a location and filename for the CSV file.
The exported file contains the events currently visible in the session's grid.
Open an existing XEL file
You can open and review previously captured Extended Events trace files (.xel) in the Query Profiler grid.
Open the Command Palette (Ctrl+Shift+P or Cmd+Shift+P).
Select MSSQL: Open Profiler XEL file....
Browse to and select the
.xelfile you want to open.
The file opens in a read-only Profiler panel. Events are loaded and displayed in the same grid with filtering capabilities. Start, Pause, and Stop controls aren't available because the file isn't a live session.
Supported scenarios
Query Profiler works with the following SQL Server and Azure SQL targets:
| Target | Supported templates |
|---|---|
| SQL Server (on-premises, VMs, containers) | Standard_OnPrem, TSQL_OnPrem, TSQL_Locks, TSQL_Duration |
| Azure SQL Database | Standard_Azure |
Note
If you select an unsupported template or attempt a server-level session on Azure SQL Database, Query Profiler shows a targeted error message and suggests the appropriate template.
Limitations
- No AI or GitHub Copilot integration in this preview.
- No cross-database or cross-server correlation beyond what Extended Events and the current templates provide.
- No saving or loading of filter presets.
- No replay of traces or script generation from captured events.
- No offline analysis without an existing
.xelfile or a live connection. - Azure SQL Managed Instance endpoints aren't guaranteed to be supported in this preview.
Feedback and support
If you have ideas, feedback, or want to engage with the community, join the discussion at https://aka.ms/vscode-mssql-discussions. To report a bug, visit https://aka.ms/vscode-mssql-bug. To request a new feature, go to https://aka.ms/vscode-mssql-feature-request.