Scheduled analytics rules in Microsoft Sentinel
By far the most common type of analytics rule, Scheduled rules are based on Kusto queries that are configured to run at regular intervals and examine raw data from a defined "lookback" period. Queries can perform complex statistical operations on their target data, revealing baselines and outliers in groups of events. If the number of results captured by the query passes the threshold configured in the rule, the rule produces an alert.
This article helps you understand how scheduled analytics rules are built, and introduces you to all the configuration options and their meanings. The information in this article is useful in two scenarios:
Create an analytics rule from a template: use the query logic and the scheduling and lookback settings as defined in the template, or customize them to create new rules.
Create an analytics rule from scratch: build your own query and rule from the ground up. To do this effectively, you should have a thorough grounding in data science and Kusto query language.
Important
Microsoft Sentinel is now generally available within the Microsoft unified security operations platform in the Microsoft Defender portal. For more information, see Microsoft Sentinel in the Microsoft Defender portal.
Analytics rule templates
The queries in scheduled rule templates were written by security and data science experts, either from Microsoft or from the vendor of the solution providing the template.
Use an analytics rule template by selecting a template name from the list of templates and creating a rule based on it.
Each template has a list of required data sources. When you open the template, the data sources are automatically checked for availability. Availability means that the data source is connected, and that data is being ingested regularly through it. If any of the required data sources are not available, you won’t be allowed to create the rule, and you might also see an error message to that effect.
When you create a rule from a template, the rule creation wizard opens based on the selected template. All the details are automatically filled in, and you can customize the logic and other rule settings to better suit your specific needs. You can repeat this process to create more rules based on the template. When you reach the end of the rule creation wizard, your customizations are validated, and the rule is created. The new rules appear in the Active rules tab on the Analytics page. Likewise, on the Rule templates tab, the template from which you created the rule is now displayed with the In use tag.
Analytics rule templates are constantly maintained by their authors, either to fix bugs or to refine the query. When a template receives an update, any rules based on that template are displayed with the Update tag, and you have the chance to modify those rules to include the changes made to the template. You can also revert any changes you made in a rule back to its original template-based version. For more information, see Manage template versions for your scheduled analytics rules in Microsoft Sentinel.
After you familiarize yourself with the configuration options in this article, see Create scheduled analytics rules from templates.
The rest of this article explains all the possibilities for customizing the configuration of your rules.
Analytics rule configuration
This section explains the key considerations you need to take into account before you begin configuring your rules.
Analytics rule name and details
The first page of the analytics rule wizard contains the rule’s basic information.
Name: The name of the rule as it appears in the list of rules and in any rule-based filters. The name must be unique to your workspace.
Description: A free-text description of the purpose of the rule.
ID: The GUID of the rule as an Azure resource, used in API requests and responses, among other things. This GUID is assigned only when the rule is created, so it's displayed only when you're editing an existing rule. As it's a read-only field, it's displayed as grayed out and can't be changed. It doesn't yet exist when creating a new rule, either from a template or from scratch.
Severity: A rating to give the alerts produced by this rule. The severity of an activity is a calculation of the potential negative impact of the activity’s occurrence.
| Severity | Description |
|---|---|
| Informational | No impact on your system, but the information might be indicative of future steps planned by a threat actor. |
| Low | The immediate impact would be minimal. A threat actor would likely need to conduct multiple steps before achieving an impact on an environment. |
| Medium | The threat actor could have some impact on the environment with this activity, but it would be limited in scope or require additional activity. |
| High | The activity identified provides the threat actor with wide ranging access to conduct actions on the environment or is triggered by impact on the environment. |
Severity level defaults are not a guarantee of current or environmental impact level. Customize alert details to customize the severity, tactics, and other properties of a given instance of an alert with the values of any relevant fields from a query output.
Severity definitions for Microsoft Sentinel analytics rule templates are relevant only for alerts created by analytics rules. For alerts ingested from other services, the severity is defined by the source security service.
MITRE ATT&CK: A specification of the attack tactics and techniques represented by the activities captured by this rule. These are based on the tactics and techniques of the MITRE ATT&CK® framework.
The MITRE ATT&CK tactics and techniques defined here in the rule apply to any alerts generated by the rule. They also apply to any incidents created from these alerts.
For more information on maximizing your coverage of the MITRE ATT&CK threat landscape, see Understand security coverage by the MITRE ATT&CK® framework.
Status: When you create the rule, its Status is Enabled by default, which means it will run immediately after you finish creating it. If you don’t want it to run immediately, you have two options:
- Select Disabled, and the rule will be added to your Active rules tab. You can enable it from there when you need it.
- Schedule the rule to first run at a specific date and time. This method is currently in PREVIEW. See Query scheduling later on in this article.
Rule query
This is the essence of the rule: you decide what information is in the alerts created by this rule, and how the information is organized. This configuration has follow-on effects on what the resulting incidents look like, and how easy or difficult they are to investigate, remediate, and resolve. It's important to make your alerts as rich in information as possible, and to make that information easily accessible.
View or input the Kusto query that analyzes the raw log data. If you're creating a rule from scratch, it's a good idea to plan and design your query before opening this wizard. You can build and test queries in the Logs page.
Everything you type into the rule query window is instantly validated, so you find out right away if you make any mistakes.
Best practices for analytics rule queries
We recommend you use an Advanced Security Information Model (ASIM) parser as your query source, instead of using a native table. This will ensure that the query supports any current or future relevant data source or family of data sources, rather than relying on a single data source.
The query length should be between 1 and 10,000 characters and cannot contain "
search *" or "union *". You can use user-defined functions to overcome the query length limitation, as a single function can replace dozens of lines of code.Using ADX functions to create Azure Data Explorer queries inside the Log Analytics query window is not supported.
When using the
bag_unpackfunction in a query, if you project the columns as fields using "project field1" and the column doesn't exist, the query will fail. To guard against this happening, you must project the column as follows:project field1 = column_ifexists("field1","")
For more help building Kusto queries, see Kusto Query Language in Microsoft Sentinel and Best practices for Kusto Query Language queries.
Alert enhancement
If you want your alerts to surface their findings so that they can be immediately visible in incidents, and tracked and investigated appropriately, use the alert enhancement configuration to surface all the important information in the alerts.
This alert enhancement has the added benefit of presenting findings in an easily visible and accessible way.
There are three types of alert enhancements you can configure:
- Entity mapping
- Custom details
- Alert details (also known as dynamic content)
Entity mapping
Entities are the players on either side of any attack story. Identifying all the entities in an alert is essential for detecting and investigating threats. To ensure that Microsoft Sentinel identifies the entities in your raw data, you must map the entity types recognized by Microsoft Sentinel onto fields in your query results. This mapping integrates the identified entities into the Entities field in your alert schema.
To learn more about entity mapping, and to get complete instructions, see Map data fields to entities in Microsoft Sentinel.
Custom details
By default, only the alert entities and metadata are visible in incidents without drilling down into the raw events in the query results. To give other fields from your query results immediate visibility in your alerts and incidents, define them as custom details. Microsoft Sentinel integrates these custom details into the ExtendedProperties field in your alerts, causing them to be displayed up front in your alerts, and in any incidents created from those alerts.
To learn more about surfacing custom details, and to get complete instructions, see Surface custom event details in alerts in Microsoft Sentinel.
Alert details
This setting allows you to customize otherwise-standard alert properties according to the content of various fields in each individual alert. These customizations are integrated into the ExtendedProperties field in your alerts. For example, you can customize the alert name or description to include a username or IP address featured in the alert.
To learn more about customizing alert details, and to get complete instructions, see Customize alert details in Microsoft Sentinel.
Note
In the unified security operations platform, the Defender XDR correlation engine is solely in charge of naming incidents, so any alert names you customized may be overridden when incidents are created from these alerts.
Query scheduling
The following parameters determine how often your scheduled rule will run, and what time period it will examine each time it runs.
| Setting | Behavior |
|---|---|
| Run query every | Controls the query interval: how often the query is run. |
| Lookup data from the last | Determines the lookback period: the time period covered by the query. |
The allowed range for both of these parameters is from 5 minutes to 14 days.
The query interval must be shorter than or equal to the lookback period. If it's shorter, the query periods will overlap and this may cause some duplication of results. The rule validation will not allow you to set an interval longer than the lookback period, though, as that would result in gaps in your coverage.
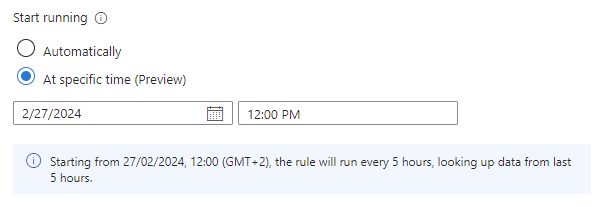
The Start running setting, now in PREVIEW, allows you to create a rule with status Enabled, but to delay its first execution until a predetermined date and time. This setting is helpful if you want to time the execution of your rules according to when data is expected to be ingested from the source, or to when your SOC analysts start their work day.
| Setting | Behavior |
|---|---|
| Automatically | The rule will run for the first time immediately upon being created, and after that at the interval set in the Run query every setting. |
| At specific time (Preview) | Set a date and time for the rule to first run, after which it will run at the interval set in the Run query every setting. |
The start running time must be between 10 minutes and 30 days after the rule creation (or enablement) time.
The line of text under the Start running setting (with the information icon at its left) summarizes the current query scheduling and lookback settings.
Note
Ingestion delay
To account for latency that may occur between an event's generation at the source and its ingestion into Microsoft Sentinel, and to ensure complete coverage without data duplication, Microsoft Sentinel runs scheduled analytics rules on a five-minute delay from their scheduled time.
For more information, see Handle ingestion delay in scheduled analytics rules.
Alert threshold
Many types of security events are normal or even expected in small numbers, but are a sign of a threat in larger numbers. Different scales of large numbers can mean different kinds of threats. For example, two or three failed sign-in attempts in the space of a minute is a sign of a user not remembering a password, but fifty in a minute could be a sign of a human attack, and a thousand is probably an automated attack.
Depending on what kind of activity your rule is trying to detect, you can set a minimum number of events (query results) necessary to trigger an alert. The threshold applies separately to each time the rule runs, not collectively.
The threshold can also be set to a maximum number of results, or an exact number.
Event grouping
There are two ways to handle the grouping of events into alerts:
Group all events into a single alert: This is the default. The rule generates a single alert every time it runs, as long as the query returns more results than the specified alert threshold explained in the previous section. This single alert summarizes all the events returned in the query results.
Trigger an alert for each event: The rule generates a unique alert for each event (result) returned by the query. This mode is useful if you want events to be displayed individually, or if you want to group them by certain parameters—by user, hostname, or something else. You can define these parameters in the query. |
Analytics rules can generate up to 150 alerts. If Event grouping is set to Trigger an alert for each event, and the rule's query returns more than 150 events, the first 149 events will each generate a unique alert (for 149 alerts), and the 150th alert will summarize the entire set of returned events. In other words, the 150th alert is what would have been generated if Event grouping had been set to Group all events into a single alert.
The Trigger an alert for each event setting might cause an issue where query results appear to be missing or different than expected. For more information on this scenario, see Troubleshooting analytics rules in Microsoft Sentinel | Issue: No events appear in query results.
Suppression
If you want this rule to stop working for a period of time after it generates an alert, turn the Stop running query after alert is generated setting On. Then, you must set Stop running query for to the amount of time the query should stop running, up to 24 hours.
Results simulation
The analytics rule wizard allows you to test its efficacy by running it on the current data set. When you run the test, the Results simulation window shows you a graph of the results the query would have generated over the last 50 times it would have run, according to the currently defined schedule. If you modify the query, you can run the test again to update the graph. The graph shows the number of results over the defined time period, which is determined by the query schedule you defined.
Here's what the results simulation might look like for the query in the screenshot above. The left side is the default view, and the right side is what you see when you hover over a point in time on the graph.
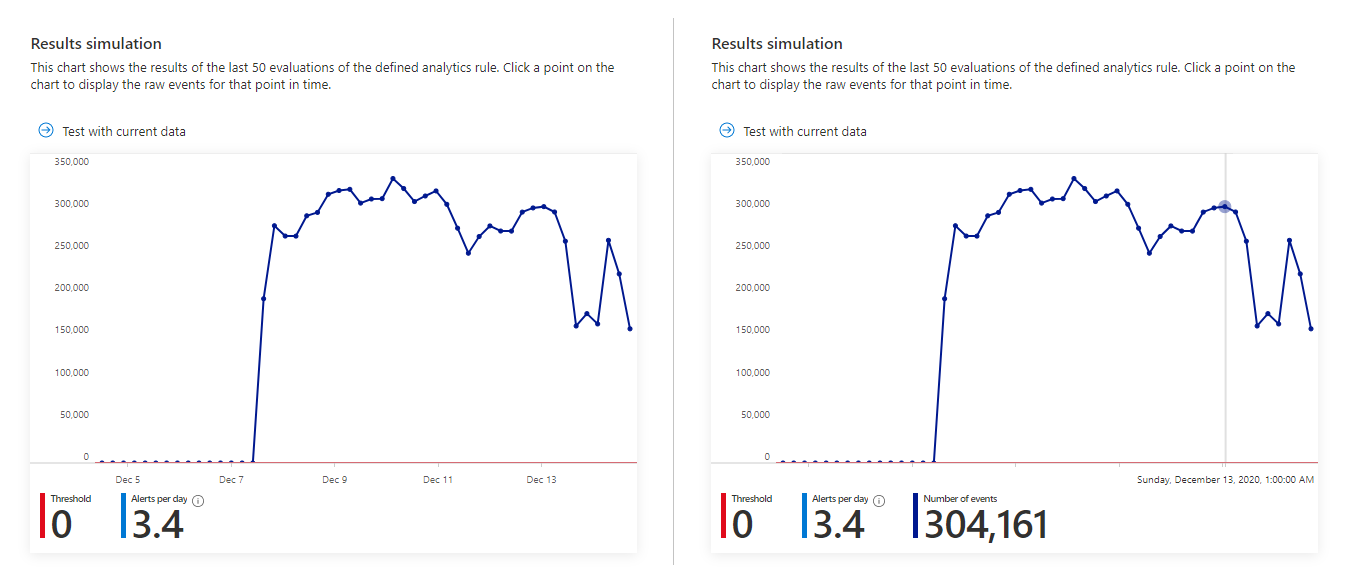
If you see that your query would trigger too many or too-frequent alerts, you can experiment with the scheduling and threshold settings and run the simulation again.
Incident settings
Choose whether Microsoft Sentinel turns alerts into actionable incidents.
Incident creation is enabled by default. Microsoft Sentinel creates a single, separate incident from each alert generated by the rule.
If you don’t want this rule to result in the creation of any incidents (for example, if this rule is just to collect information for subsequent analysis), set this to Disabled.
Important
If you onboarded Microsoft Sentinel to the unified security operations platform, Microsoft Defender XDR is responsible for creating incidents. Nevertheless, if you want Defender XDR to create incidents for this alert, you must leave this setting Enabled. Defender XDR takes the instruction defined here.
This is not to be confused with the Microsoft security type of analytics rule that creates incidents for alerts generated in Microsoft Defender services. Those rules are automatically disabled when you onboard Microsoft Sentinel to the unified security operations platform.
If you want a single incident to be created from a group of alerts, instead of one for every single alert, see the next section.
Alert grouping
Choose whether how alerts are grouped together in incidents. By default, Microsoft Sentinel creates an incident for every alert generated. You have the option of grouping several alerts together into a single incident instead.
The incident is created only after all the alerts have been generated. All of the alerts are added to the incident immediately upon its creation.
Up to 150 alerts can be grouped into a single incident. If more than 150 alerts are generated by a rule that groups them into a single incident, a new incident is generated with the same incident details as the original, and the excess alerts are grouped into the new incident.
To group alerts together, set the alert grouping setting to Enabled.
There are a few options to consider when grouping alerts:
Time frame: By default, alerts created up to 5 hours after the first alert in an incident are added to the same incident. After 5 hours, a new incident is created. You can alter this time period to anywhere between 5 minutes and 7 days.
Grouping criteria: Choose how to determine which alerts are included in the group. The following table shows the possible choices:
Option Description Group alerts into a single incident if all the entities match Alerts are grouped together if they share identical values for each of the mapped entities defined earlier. This is the recommended setting. Group all alerts triggered by this rule into a single incident All the alerts generated by this rule are grouped together even if they share no identical values. Group alerts into a single incident if the selected entities and details match Alerts are grouped together if they share identical values for all of the mapped entities, alert details, and custom details that you select for this setting. Choose the entities and details from the drop-down lists that appear when you select this option.
You might want to use this setting if, for example, you want to create separate incidents based on the source or target IP addresses, or if you want to group alerts that match a specific entity and severity.
Note: When you select this option, you must have at least one entity or detail selected for the rule. Otherwise, the rule validation fails and the rule is not created.Reopening incidents: If an incident has been resolved and closed, and later on another alert is generated that should belong to that incident, set this setting to Enabled if you want the closed incident re-opened, and leave as Disabled if you want the new alert to create a new incident.
The option to reopen closed incidents is not available if you onboarded Microsoft Sentinel to the unified security operations platform.
Automated response
Microsoft Sentinel lets you set automated responses to occur when:
- An alert is generated by this analytics rule.
- An incident is created from alerts generated by this analytics rule.
- An incident is updated with alerts generated by this analytics rule.
To learn all about the different kinds of responses that can be crafted and automated, see Automate threat response in Microsoft Sentinel with automation rules.
Under the Automation rules heading, the wizard displays a list of the automation rules already defined on the whole workspace, whose conditions apply to this analytics rule. You can edit any of these existing rules, or you can create a new automation rule that applies only to this analytics rule.
Use automation rules to perform basic triage, assignment, workflow, and closing of incidents.
Automate more complex tasks and invoke responses from remote systems to remediate threats by calling playbooks from these automation rules. You can invoke playbooks for incidents as well as for individual alerts.
For more information and instructions on creating playbooks and automation rules, see Automate threat responses.
For more information about when to use the incident created trigger, the incident updated trigger, or the alert created trigger, see Use triggers and actions in Microsoft Sentinel playbooks.
Under the Alert automation (classic) heading, you might see a list of playbooks configured to run automatically using an old method due to be deprecated in March 2026. You can't add anything to this list. Any playbooks listed here should have automation rules created, based on the alert created trigger, to invoke the playbooks. After you've done that, select the ellipsis at the end of the line of the playbook listed here, and select Remove. See Migrate your Microsoft Sentinel alert-trigger playbooks to automation rules for full instructions.
Next steps
When using Microsoft Sentinel analytics rules to detect threats across your environment, make sure you enable all rules associated with your connected data sources to ensure full security coverage for your environment.
To automate rule enablement, push rules to Microsoft Sentinel via API and PowerShell, although doing so requires additional effort. When using API or PowerShell, you must first export the rules to JSON before enabling the rules. API or PowerShell may be helpful when enabling rules in multiple instances of Microsoft Sentinel with identical settings in each instance.
For more information, see:
- Export and import analytics rules to and from ARM templates
- Troubleshooting analytics rules in Microsoft Sentinel
- Navigate and investigate incidents in Microsoft Sentinel
- Entities in Microsoft Sentinel
- Tutorial: Use playbooks with automation rules in Microsoft Sentinel
Also, learn from an example of using custom analytics rules when monitoring Zoom with a custom connector.
คำติชม
เร็วๆ นี้: ตลอดปี 2024 เราจะขจัดปัญหา GitHub เพื่อเป็นกลไกคำติชมสำหรับเนื้อหา และแทนที่ด้วยระบบคำติชมใหม่ สำหรับข้อมูลเพิ่มเติม ให้ดู: https://aka.ms/ContentUserFeedback
ส่งและดูข้อคิดเห็นสำหรับ