หมายเหตุ
การเข้าถึงหน้านี้ต้องได้รับการอนุญาต คุณสามารถลอง ลงชื่อเข้าใช้หรือเปลี่ยนไดเรกทอรีได้
การเข้าถึงหน้านี้ต้องได้รับการอนุญาต คุณสามารถลองเปลี่ยนไดเรกทอรีได้
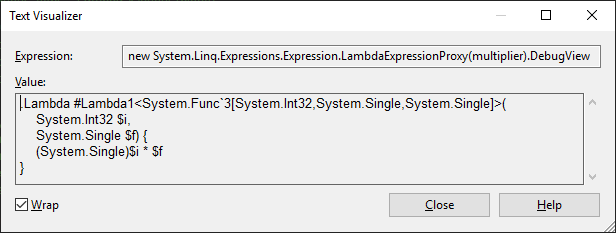
You can analyze the structure and content of expression trees when you debug your applications. To get a quick overview of the expression tree structure, you can use the DebugView property, which represents expression trees using a special syntax. DebugView is available only in debug mode.

Since DebugView is a string, you can use the built-in Text Visualizer to view it across multiple lines, by selecting Text Visualizer from the magnifying glass icon next to the DebugView label.
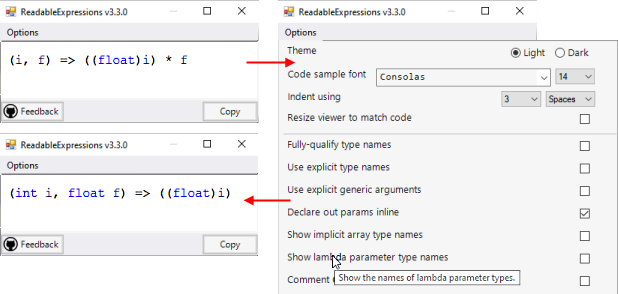
Alternatively, you can install and use a custom visualizer for expression trees, such as:
Readable Expressions (MIT license, available at the Visual Studio Marketplace), renders the expression tree as themeable C# code, with various rendering options:
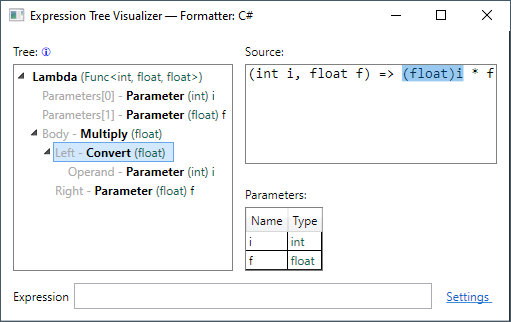
Expression Tree Visualizer (MIT license) provides a tree view of the expression tree and its individual nodes:
Open a visualizer for an expression tree
Select the magnifying glass icon that appears next to the expression tree in DataTips, a Watch window, the Autos window, or the Locals window. A list of available visualizers is displayed:

Select the visualizer you want to use.
See also
ทํางานร่วมกับเราใน GitHub
แหล่งที่มาสำหรับเนื้อหานี้สามารถพบได้บน GitHub ซึ่งคุณยังสามารถสร้างและตรวจสอบปัญหาและคำขอดึงข้อมูลได้ สำหรับข้อมูลเพิ่มเติม ให้ดูคู่มือผู้สนับสนุนของเรา