หมายเหตุ
การเข้าถึงหน้านี้ต้องได้รับการอนุญาต คุณสามารถลอง ลงชื่อเข้าใช้หรือเปลี่ยนไดเรกทอรีได้
การเข้าถึงหน้านี้ต้องได้รับการอนุญาต คุณสามารถลองเปลี่ยนไดเรกทอรีได้
By default, DevTools opens the Edge DevTools: Browser tab in Visual Studio Code. The alternative approach is to have DevTools open an external, automation-controlled Microsoft Edge window.
External browser window
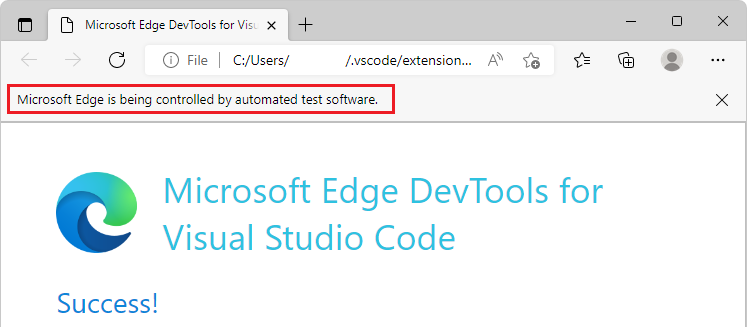
External browser window means that when you launch an instance of the browser by using the Edge DevTools extension, an entire Microsoft Edge window with full UI opens, controlled by DevTools test automation:
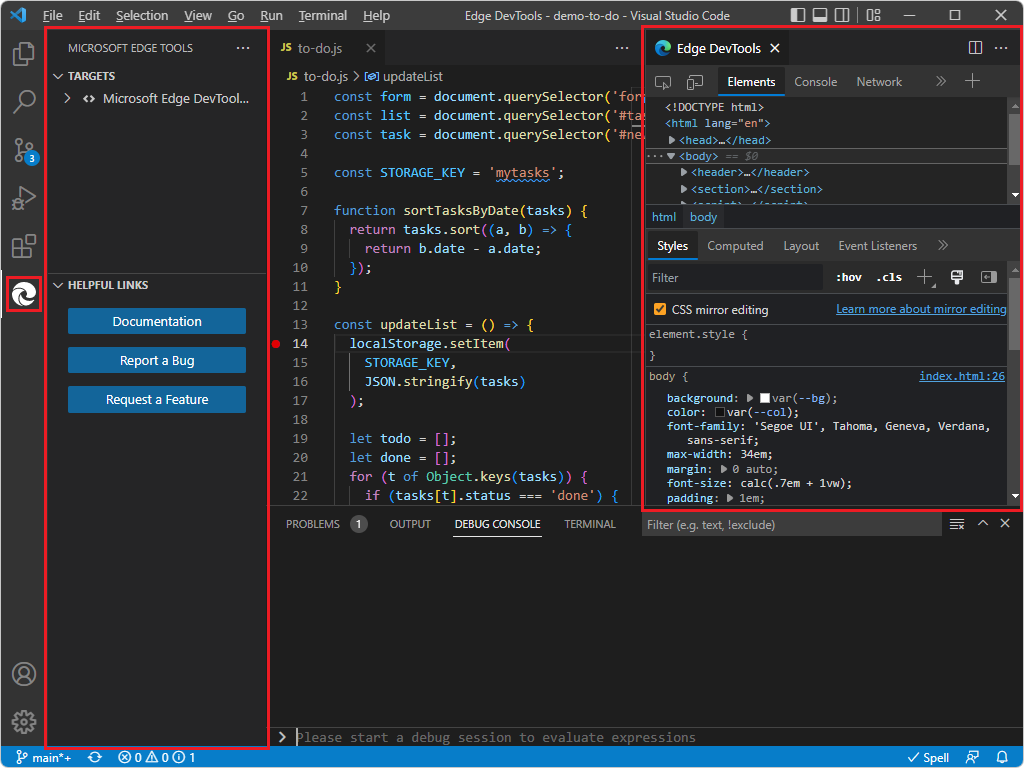
When the external browser window is open, the Edge DevTools: Browser tab doesn't open when you start DevTools:
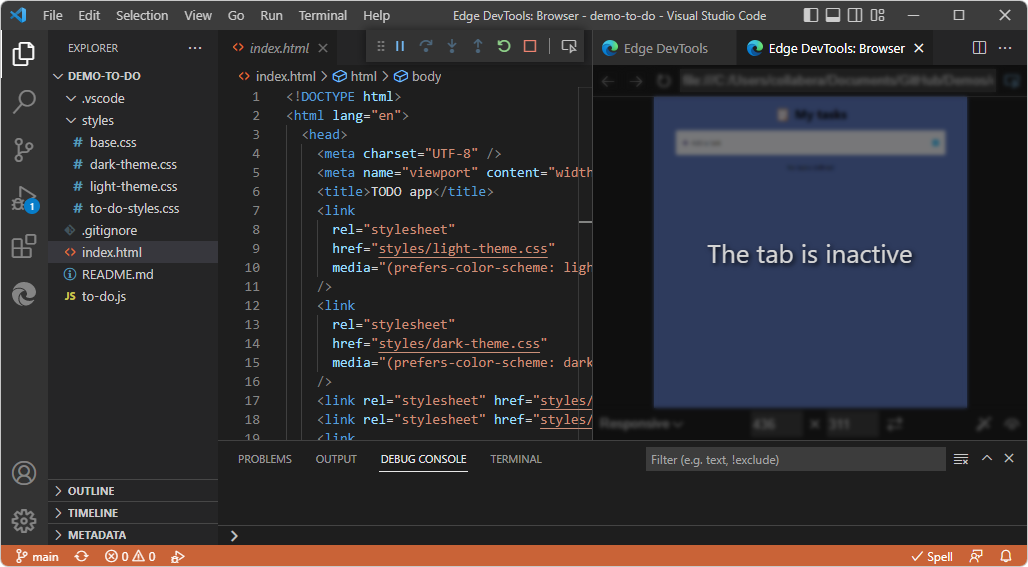
If you then click the Toggle screencast button in the Edge DevTools tab, the Edge DevTools: Browser tab opens, displaying The tab is inactive:
The embedded DevTools browser
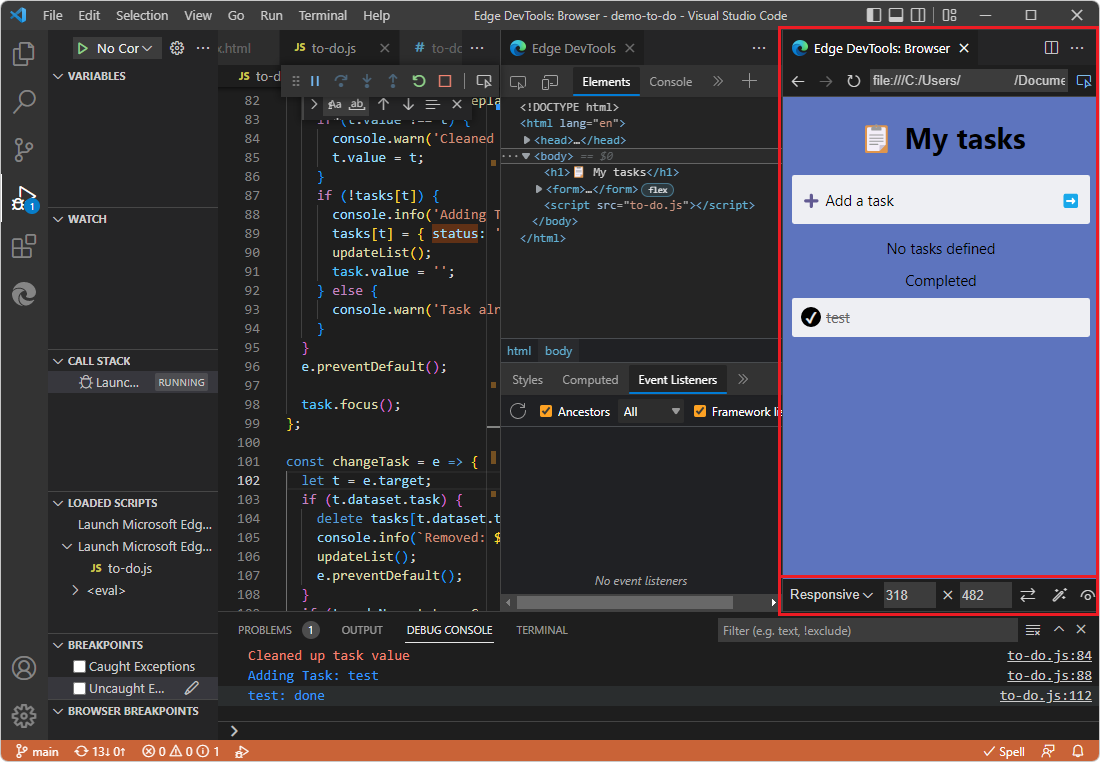
By default, DevTools opens the Edge DevTools: Browser tab in Visual Studio Code, rather than opening an external browser window. The Edge DevTools: Browser tab includes a device emulation toolbar at the bottom:
This tab is also called:
- The headless browser, in Settings.
- The screencast, in tooltips.
- The embedded browser.
- The DevTools browser.
- The embedded DevTools browser.
Limitations of the embedded DevTools browser
The embedded Edge DevTools Browser in the Visual Studio Code DevTools extension provides a simple preview with many restrictions, and doesn't support all the features of a real web browser. When you need a full-featured browser, use an external browser window instead of the embedded browser. The embedded DevTools browser is a browser instance that runs without a user interface, and from which screen captures are being streamed. Therefore, not all user interactions are implemented.
The embedded DevTools browser has limitations including the following:
- Drag-and-drop isn't supported.
onPasteCaptureandonPasteevents don't trigger.- The CSS
cursorproperty isn't respected. - There might be visual performance issues.
Changing the setting
To change or check the setting for which type of browser window to use:
In Visual Studio Code, select Activity Bar > Microsoft Edge Tools. The Microsoft Edge Tools Side Bar opens.
Hover to the right of Targets, and then click More Actions (...) > Open Settings.
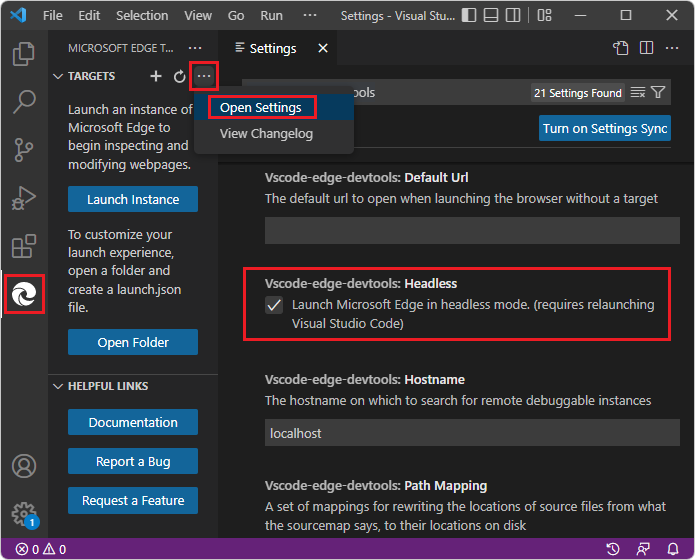
If you want to use the Edge DevTools: Browser tab in Visual Studio Code, select the Headless checkbox.
Or, if you want to use the external, automation-controlled browser window, clear the Headless checkbox.
Close DevTools. See Closing DevTools in Opening DevTools and the DevTools browser.
Open DevTools. See Opening DevTools and the DevTools browser.
See also
- Get started using the DevTools extension for Visual Studio Code
- Microsoft Edge DevTools extension for Visual Studio Code
- Debug Microsoft Edge in Visual Studio Code
External articles: