หมายเหตุ
การเข้าถึงหน้านี้ต้องได้รับการอนุญาต คุณสามารถลอง ลงชื่อเข้าใช้หรือเปลี่ยนไดเรกทอรีได้
การเข้าถึงหน้านี้ต้องได้รับการอนุญาต คุณสามารถลองเปลี่ยนไดเรกทอรีได้
![]()
This article describes how to work with the View menu in WinDbg.

The View menu opens a new window for each item or brings focus to the existing window if one is already open.
Command
Use Command to enter debugger commands. For more information about debugger commands, see Debugger commands.
Watch
Use Watch to watch local variables and registers.
Locals and Watch are both based on the data model that the dx command uses. Locals and Watch benefit from any NatVis or JavaScript extensions that you loaded. They also support full LINQ queries like the dx command. For more information about the data model, see WinDbg: Data model.
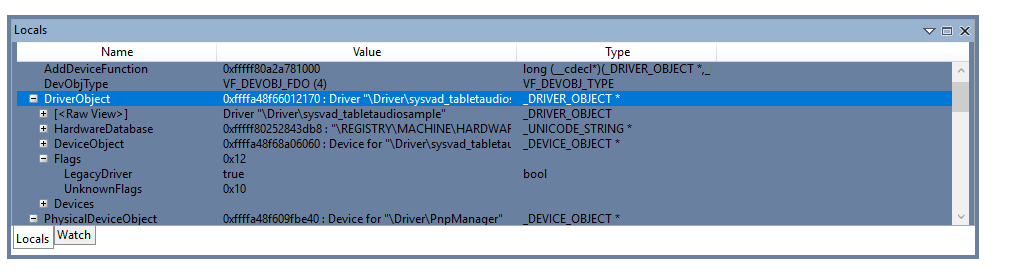
Locals
Locals displays information about all the local variables in the current scope. Locals highlights values that changed during the previous code execution.
Registers
Registers displays the contents of the processors registers when they're available. For more information about registers, see Registers and View and edit registers in WinDbg (Classic).
Memory
Use Memory to display memory locations. In addition to providing a memory address, you can use pseudo-register values such as $scopeip and $eventip to examine memory. Preappend the @ symbol to use pseudo-register values in Memory, for example, @$scopeip. For more information, see Pseudo-register syntax.
Stack
Use Stack to view the current call stack. Stack provides basic highlighting of the current frame.
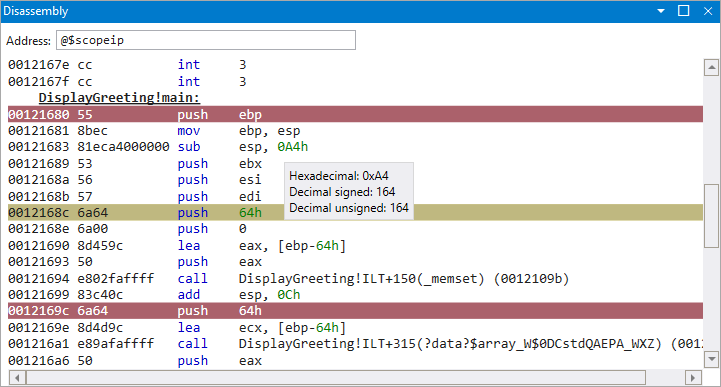
Disassembly
Disassembly highlights the current instruction and retains that position when you scroll.
Threads
Threads highlights the current thread.
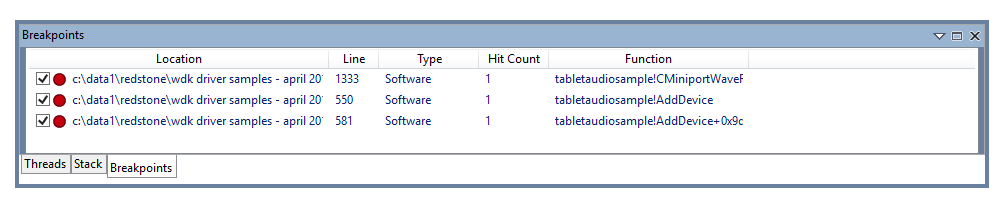
Breakpoints
Use Breakpoints to view, enable, and clear breakpoints.
Logs
Logs is for the WinDbg internals. You can view it to monitor long-running processes and to troubleshoot the debugger itself.
You can continue to create a traditional debugger command log by using the .logopen command. For more information, see Keep a log file in WinDbg.
Notes
Use Notes to open a note-taking window.
Timelines
Use Timelines to open or bring focus to the Timelines window. For more information on timelines, see WinDbg: Timelines.
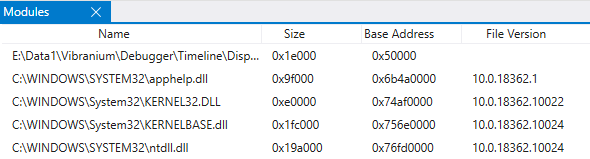
Modules
Use Modules to display loaded modules and their related information. Modules displays:
- The name of the module, including the path location.
- The size in bytes of the loaded module.
- The base address that the module is loaded at.
- The file version.
Layouts
Use Layouts to select from three window layouts.
Reset Windows
Use Reset Windows to reset the debugger windows to their default positions.
Accent color
Use Accent color to set the accent color for the debugger.