Create a Node.js app in Visual Studio Code
In this unit, you'll understand how to:
- Create a JavaScript application using Visual Studio Code and Cosmos DB.
- Use intellisense to help with writing code.
- Run the application using Node.js from within Visual Studio Code.
- Use integrated debugger to step through your code and examine variables as your code runs.
Create a JavaScript application for Node.js
You can create a new JavaScript application for Node.js from within Visual Studio Code using a terminal window. The npm init -y command creates a new file, named package.json in the application folder. This file contains metadata that you use to describe your application for the Node.js runtime.
Then you need to create a new file for your application code. When you save the file, make sure you give the file a .js extension (for JavaScript). You're now ready to start writing your JavaScript code.
Use IntelliSense to help write your code
As you write your code, IntelliSense can perform type checking and code completion. For example, as you create functions, define types, or even import a module into a JavaScript file, the items that you have added or imported become available to IntelliSense.
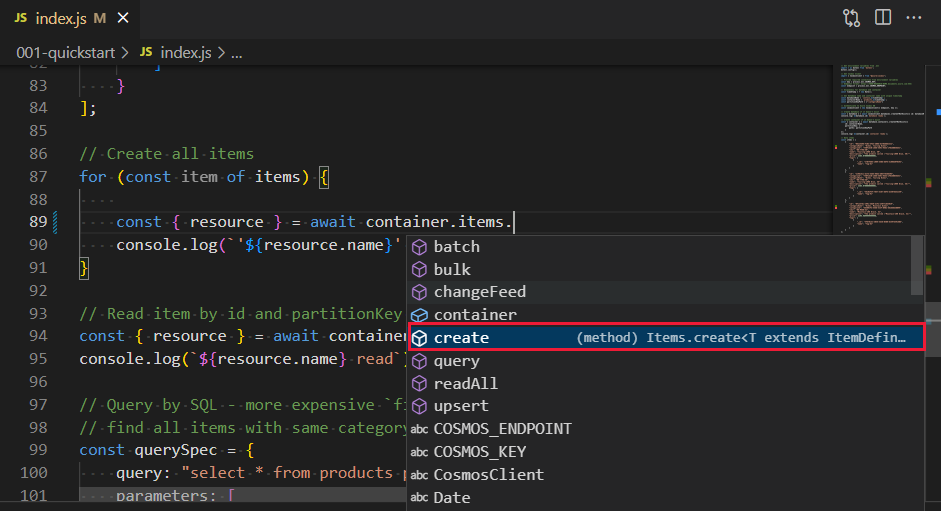
As you type, IntelliSense will use a combination of type checking and type inference to show suggestions appropriate to the current context. Type inference enables IntelliSense to present valid code completion suggestions as you write your code:
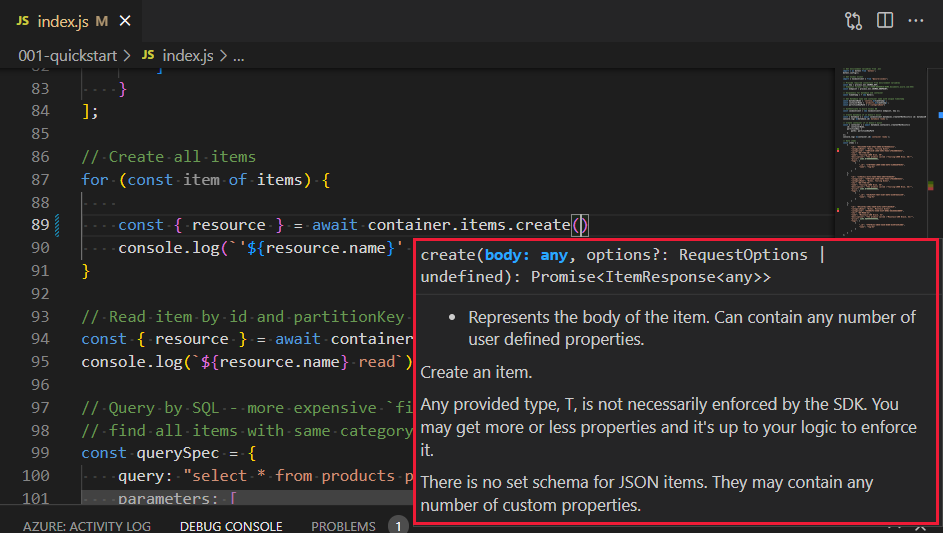
Type checking enables IntelliSense to show the parameters that a function call can take, and will type-check the expressions you provide for each function:
Other IntelliSense features available in Visual Studio Code include:
- Detecting unreachable code and unused variables. Statements that can never be run, and variables that are never used, are shown faded out in the editor.
- Peeking at definitions and references. The peek facility enables you to quickly view the definition of an object or function, even if it's in another file. Right-click a variable or function, and select Peek Definition or Peek References. The definition or references appear in a pop-up window.
- Go to a variable, function, or type definition. This feature enables you to move directly to the definition of a variable, function, or type in your code. This is useful if you need to change the definition of an item or modify a function. Right-click the code that references your variable or type, or that calls your function. Select Go To Definition, or Go To Type Definition.
- Suggesting possible refactoring of your code. An ellipsis (...) under an item indicates areas where IntelliSense has one or more suggestions. Select the ellipsis to view the suggestions. Select Quick Fix to implement the suggestion.
Run and debug a Node.js application
The simplest way to run a Node.js application from Visual Studio Code is to use the node command from a terminal window. For example, to run the code in a file named index.js, run node index.js.
You can use the native Node.js debugger (for example, node inspect index) from a terminal window, but Visual Studio Code provides an enhanced environment for stepping through and debugging Node.js applications.
Configure debugger in launch.json file
Before you use the Visual Studio Code debugger, you should configure it. To edit the debugger configuration settings, on the Run menu, select Add configuration. On the Select debugger option, select Node.js. The ./.vscode/launch.json file displays your new configuration.
{
    // Use IntelliSense to learn about possible attributes.
    // Hover to view descriptions of existing attributes.
    // For more information, visit: https://go.microsoft.com/fwlink/?linkid=830387
    "version": "0.2.0",
    "configurations": [
        {
            "type": "node",
            "request": "launch",
            "name": "Launch Program",
            "skipFiles": [
                "<node_internals>/**"
            ],
            "program": "${workspaceFolder}/index.js",
        }
    ]
}
For this Contoso application, with several code files to run, we'll add a couple of extra properties. Change the program property file name to ${file}. This allows you to debug the currently active JavaScript file. Add the args property when you need to pass in parameters to the application. These values are available from the process.argv property available in the Node.js runtime.
{
    // Use IntelliSense to learn about possible attributes.
    // Hover to view descriptions of existing attributes.
    // For more information, visit: https://go.microsoft.com/fwlink/?linkid=830387
    "version": "0.2.0",
    "configurations": [
        {
            "type": "node",
            "request": "launch",
            "name": "Launch Program",
            "skipFiles": [
                "<node_internals>/**"
            ],
            // ${file} is replaced with active file's name
            "program": "${workspaceFolder}/${file}",
            // these values are available as process.argv
            "args": ["abc", "1"],
        }
    ]
}
Set breakpoints
Before you begin to debug, you should set a breakpoint in your application code. To do this, click in the left margin by the statement at which you want to pause execution. A red dot will appear.
Start debugging
To start debugging, select Start Debugging on the Run menu or launch the debugger, F5. If you're using an external terminal, a new terminal window will appear. Debugger output will appear in the Output window in Visual Studio Code.
When the debugger reaches a breakpoint in your application, execution pauses, and the breakpoint statement is highlighted. Windows in the Run and debug explorer allow you to examine and set the values of local and global variables, and the call stack. You can also add Watch expressions, which are evaluated and displayed as execution proceeds.
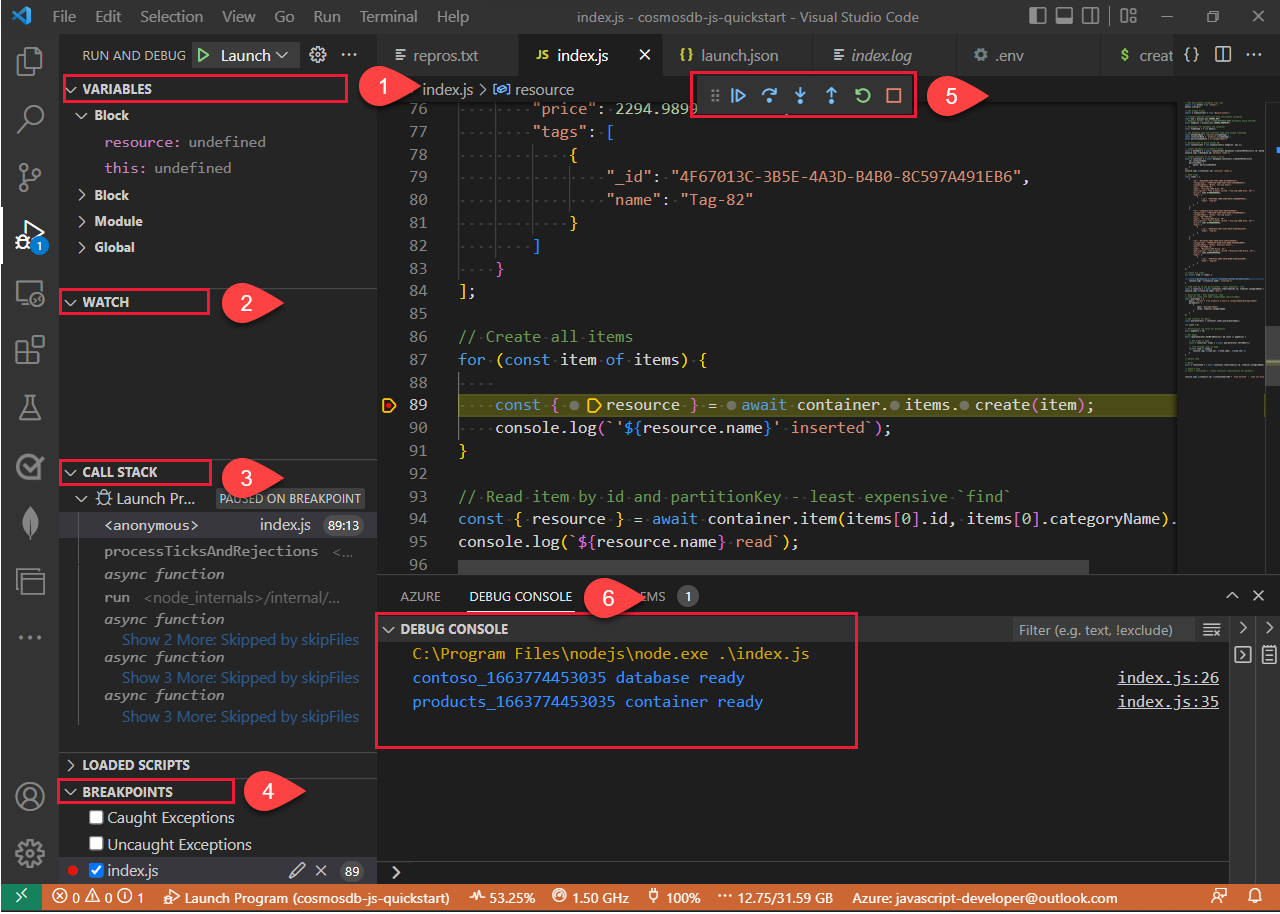
| Item | Description |
|---|---|
| 1 - Variables | All the variables in the local and global scope. |
| 2- Watch | Add any variables to watch during execution. |
| 3- Call stack | The execution stack of the application at the current point in time. |
| 4- Breakpoints | All the breakpoints set in the application. |
| 5- Debug toolbar | This toolbar contains commands that enable you to single-step through your code. If a statement contains a function call, you can step into that function, or step over it. The step-out command continues execution until the function finishes. You can also continue running the application, either until the debugger reaches another breakpoint or the application finishes. |
| 6 - Debug console | See any console statement values. |
As you add JavaScript code in the next few exercises, you may need to debug the code to determine what is wrong. Come back to this unit when necessary.