Monitor startup performance and restarts
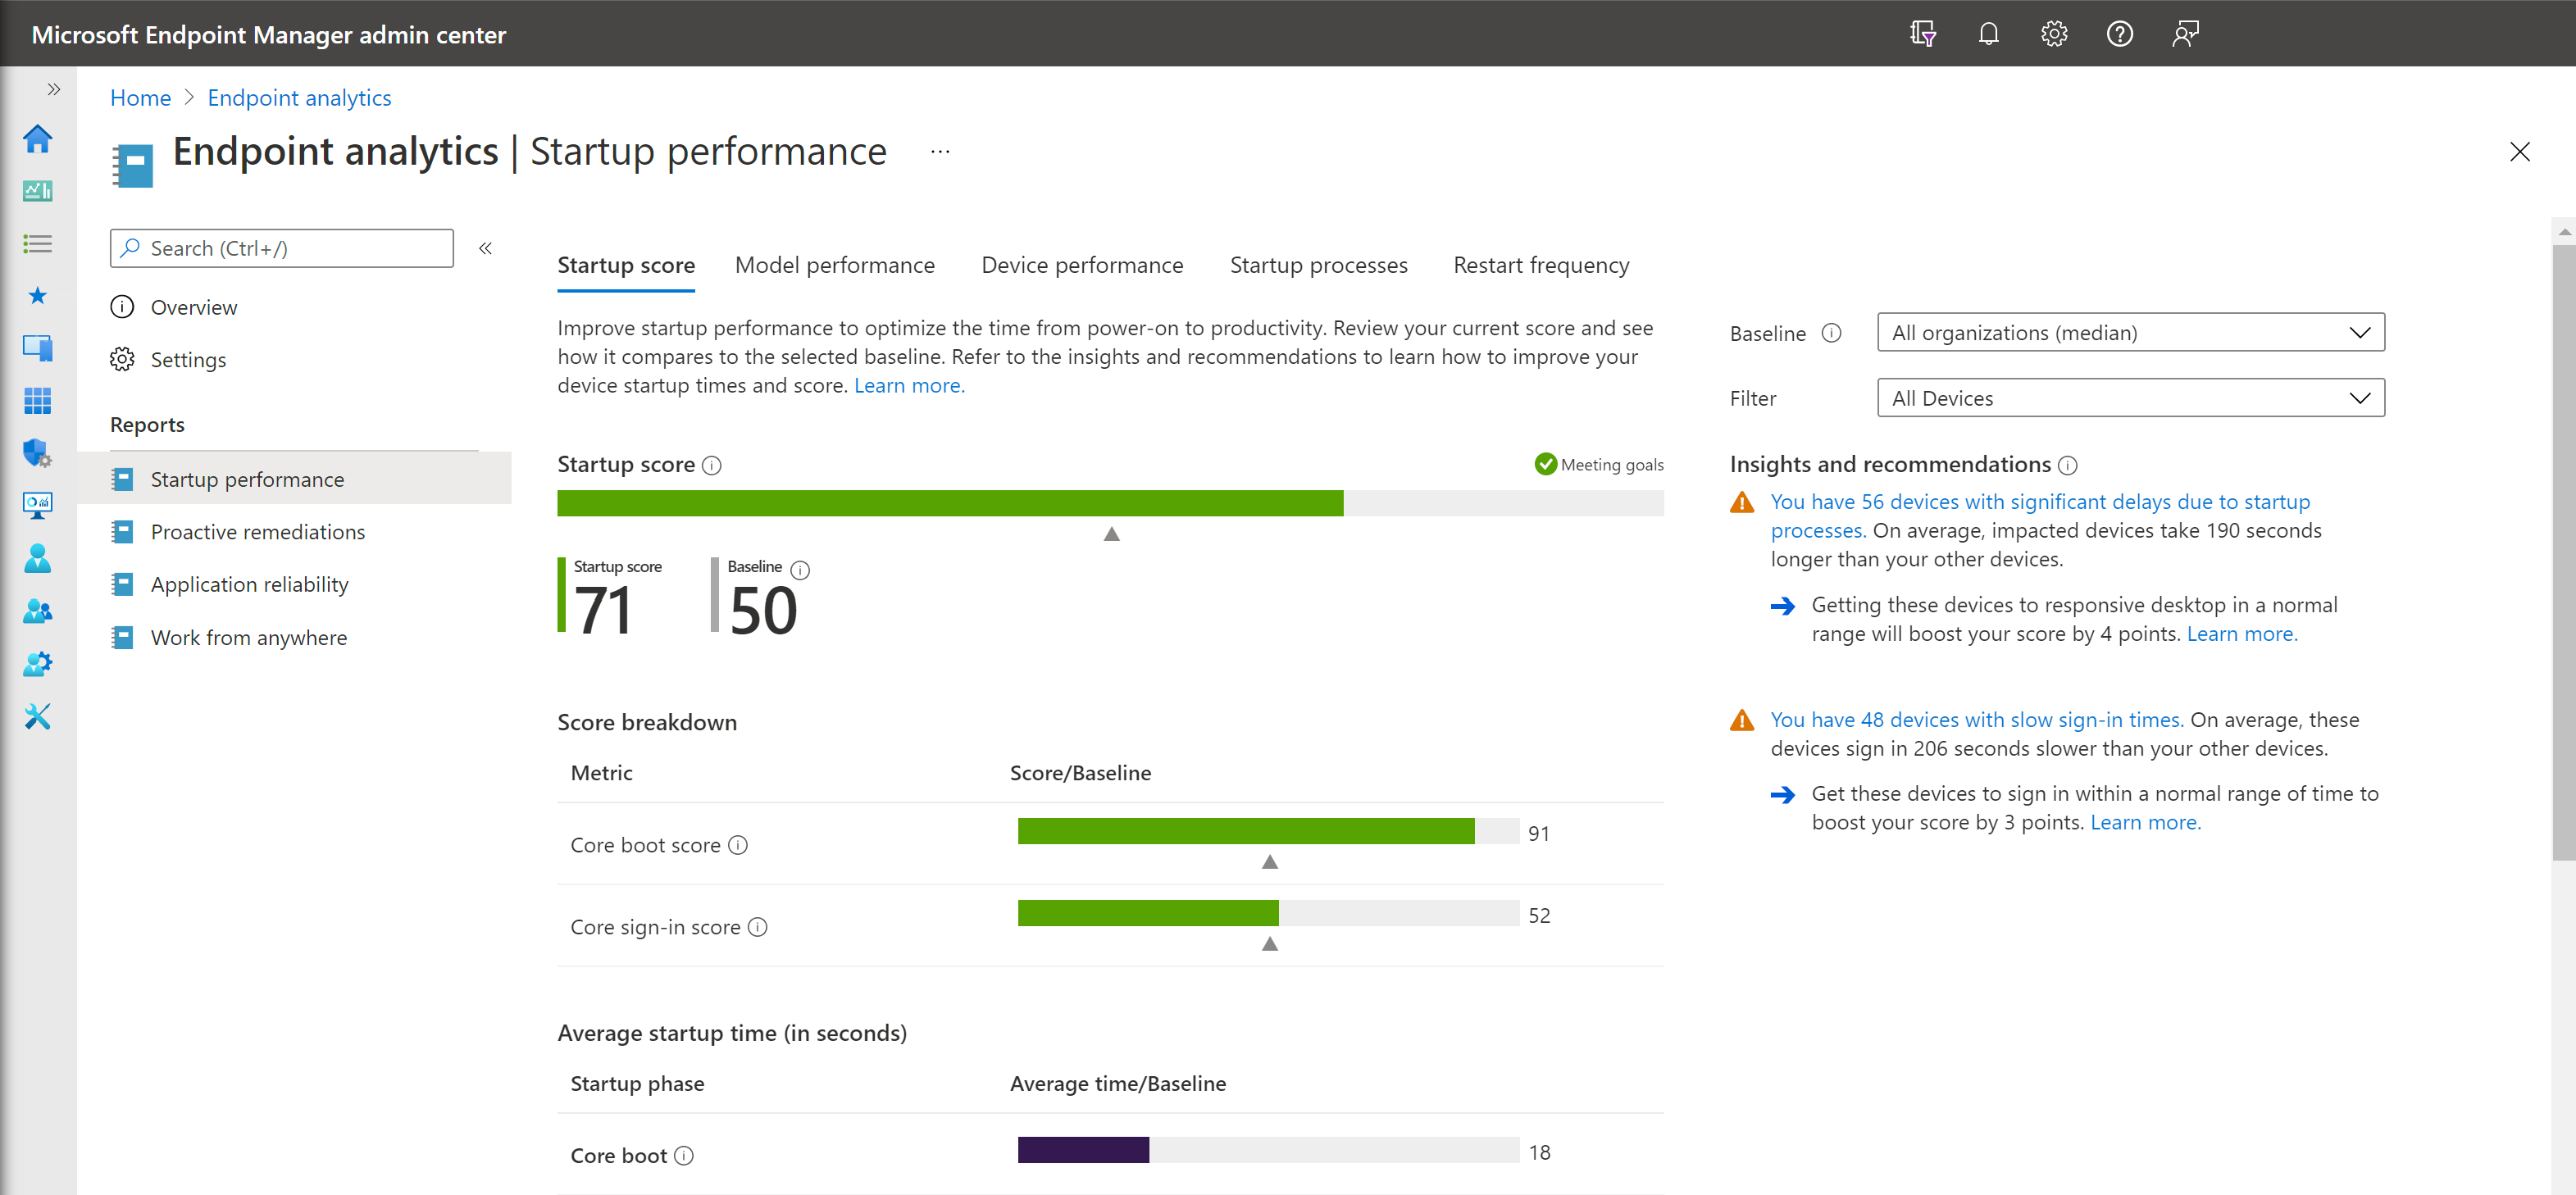
Startup processes can negatively affect the user experience by increasing the length of time that users must wait for the desktop to become responsive. The Startup performance score helps IT get users from power-on to productivity quickly, without lengthy boot and sign-in delays. The Startup score is a number between 0 and 100, and these scores are averaged to provide an overall tenant boot score. This score is a weighted average of Boot score and the Sign-in score, which are computed as follows:
- Boot score. Based on the time from power-on to sign in.
- Sign-in score. Based on the time from when credentials have been entered until the user can access a responsive desktop (meaning the desktop has rendered and the CPU usage has fallen below 50% for at least 2 seconds). Last sign-in time to each device is measured, excluding first sign-ins or sign-ins immediately after a feature update.

Insights
The Startup performance page also provides a prioritized list of Insights and recommendations. Insights include hard disk performance, delays caused by group policy, and slow boot times. If you select through to a particular device, you can see further details that help identify a solution.
The Startup performance page has reporting tabs that provide support for the insights, including:
Model performance. This tab lets you see the boot and sign-in performance by device model, which can help you identify if performance problems are isolated to particular models.
Device performance. This tab provides boot and sign-in metrics for all your devices. You can sort by a particular metric (for example, GP sign-in time) to see which devices have the worst scores for that metric to help with troubleshooting. You can also search for a device by name.
Startup processes. This tab will show you which processes are affecting the sign-in "time to responsive desktop" phase, that is - keeping the CPU above 50% after the desktop has rendered. The table only lists processes that affect a minimum of 10 devices in your tenant. When reviewing startup processes, the following data calculations are displayed:
- Device count. The count of devices that experienced a delay to a responsive desktop from the process.
- Median delay. The median delay time of the process for the counted devices.
- Total delay. The sum of the delays for all of the counted devices.
Restart frequency
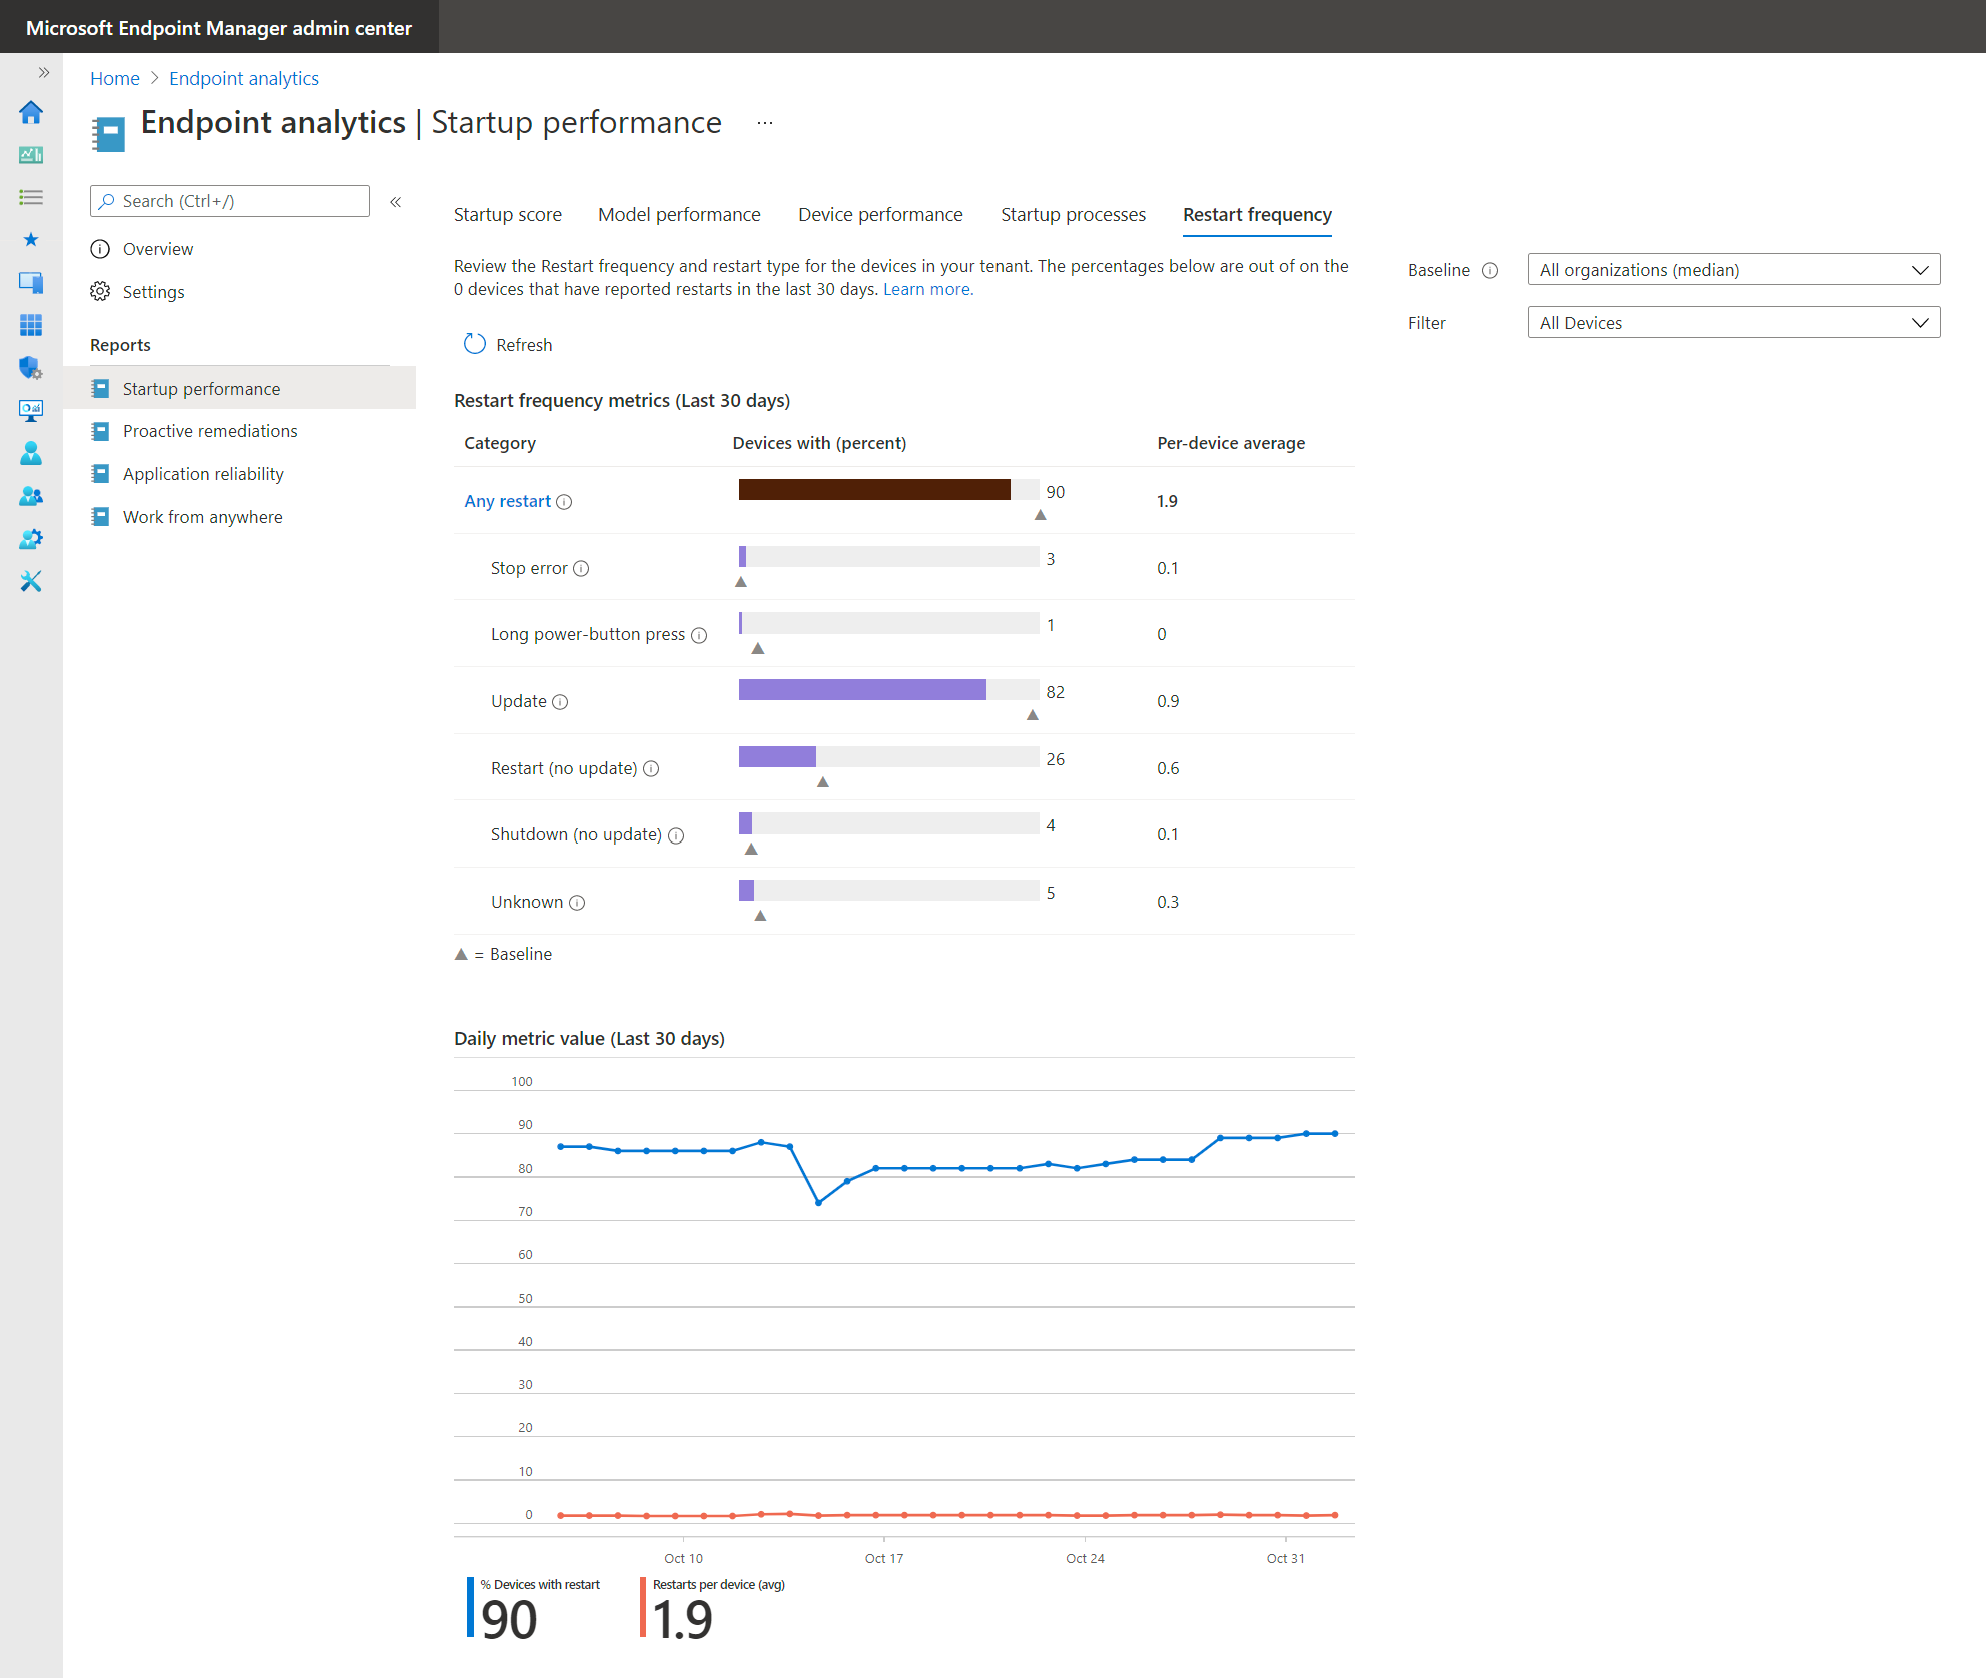
Frequent restarts can be just as impactful to the user experience since a device that reboots daily. Stop errors will have a poor user experience even if the boot times are fast. Each restart is categorized into one of six categories. They're described as either abnormal shutdowns or normal shutdowns.
Abnormal shutdowns. Where the shutdown or restart didn't go through the normal Windows shutdown process. They include the following:
- Stop errors. Blue screen errors. Stop errors should be infrequent, less than 2 per device per year is typical.
- Long power button press. When an end user holds the power button down to force a restart. These shutdowns should be less frequent than Stop errors.
- Unknown.Any abnormal shutdown that isn't one of the above shutdowns.
Normal shutdowns. Where the shutdown or restart went through the normal Windows shutdown process. They include the following:
- Update. The restart was done to finish installation of a Windows update. Ideally there should be around one of these restarts per device per month. Less than once per month is problematic since it indicates devices aren't getting patched. More than once per month is also problematic as it indicates users are enduring more update restarts than is typically necessary.
- Shutdown (no update). Typically means someone is trying to save battery or power and isn't indicative of a poor user experience.
- Restart (no update). Ideally this should be close to zero since there shouldn't be a reason to restart a device beyond monthly patching.
Device performance tab
In the device performance tab, two default columns have been added so you can review the total number of restarts and the number of Stop errors (blue screen errors) each device had in the last 14 days. Sort by these columns to find problematic devices. You can also use this tab to review the total number of devices that have sent restart records. For example, the screenshot below has 31 records, meaning 31 devices have sent restart data.
Model performance tab
In the model performance tab, you can review both the average number of restarts and the average number of Stop errors per model over the last 14 days. Sort by these columns to find problematic device models. Only models with at least 10 devices are shown to ensure the averages are done across enough devices to be meaningful.
Restart frequency tab
The restart frequency tab shows aggregates of restart frequency counts for each of the restart categories over the last 14 days. For each restart category, the number of devices with the event, and the average number of restarts (related to that category) per device.
The trend chart indicates how the rolling 14-day average changes over time. Clicking through the metrics table will take you to the Device performance tab, so you can quickly identify the devices with the most restarts.

Devices page
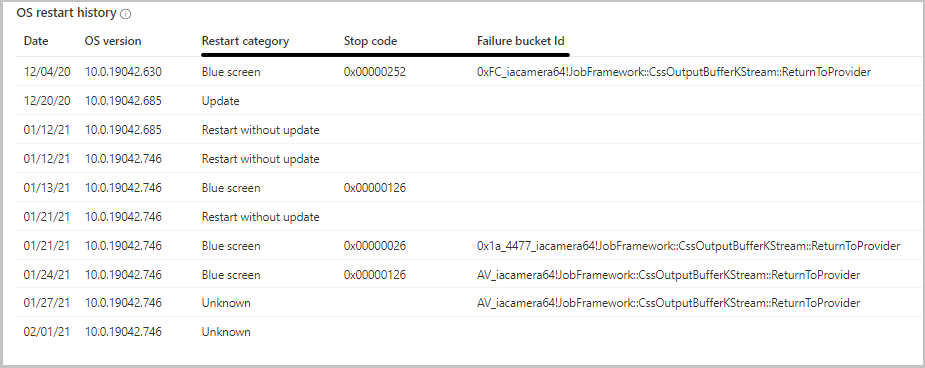
Navigating through to a particular device in the Device performance tab, takes you to the device's Startup performance tab. The OS restart history table contains detailed information on the history of events that can assist in diagnostics.

Note
The OS restart history table is truncated to the 10 most recent restarts that occurred in the last two months.
