Exercise - Summarize data using aggregate functions
We've used a meteorological dataset to compare the number of certain kinds of storm events in different US states for the year 2007, and visualized the results. Here, you'll explore other aggregation functions to describe the data.
Characterize storm types using the avg() function
In the last unit, you looked at the number of storms as a function of time and the damage caused by these storms. Let's look at other statistics that can help characterize the storms themselves.
First, you'll use the avg() function to calculate the average damage caused by storms in US dollars.
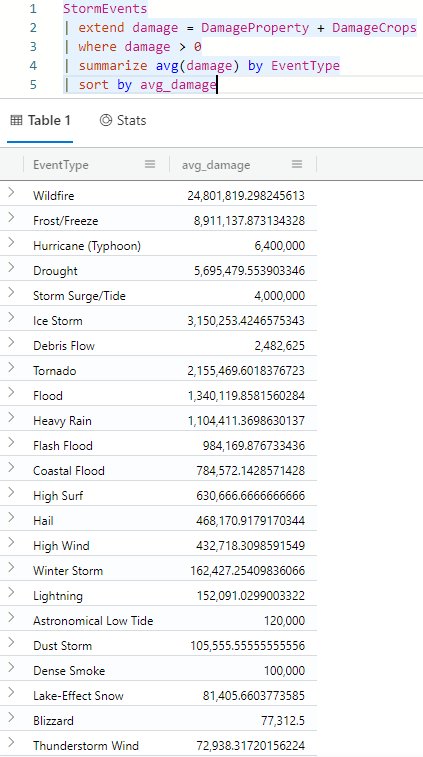
The following query creates a calculated column using the extend operator to add all values of damage, in this case DamageProperty and DamageCrops, in US dollars. The query then filters for events that caused damage greater than zero. Next, the query summarizes the average damage created by each type of storm. Finally, the results are sorted by the new average damage column.
Run the following query:
StormEvents
| extend damage = DamageProperty + DamageCrops
| where damage > 0
| summarize avg(damage) by EventType
| sort by avg_damage
You should get results that look like the following image:
A more concise way to run this query is to use the
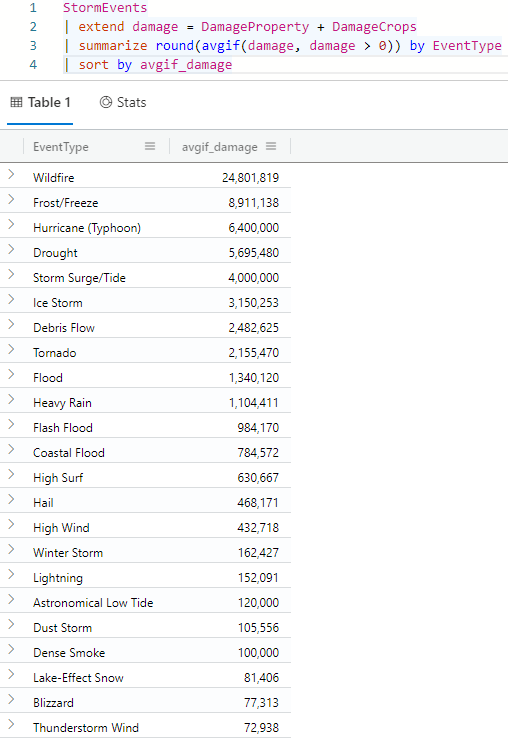
avgif()function. This function is similar to theavg()function, but only averages results for which the predicate is true. The input for this function is the column to evaluate and the condition on which to evaluate the value. So, the querywhere damage > 0 | summarize avg(damage) by EventTypeis equivalent tosummarize avgif(damage, damage > 0) by EventType.While we're at it, let's clean up the results by using the
round()function. This function rounds the results to the specified number of digits after the decimal point. In this example, you'll use the default rounding value of 0.Run the following query:
StormEvents
| extend damage = DamageProperty + DamageCrops
| summarize round(avgif(damage, damage > 0)) by EventType
| sort by avgif_damage
You should get results that look like the following image:
Find extremes using min() and max()
Let's now look at the damage extremes.
For absolute maximum or minimum values, use the min() and max() aggregation functions. Within these functions, you have to define the column on which to calculate the minimum or maximum value and the field on which to aggregate the data. The following query builds on the previously calculated damage column, adding min() and max() values for the same column.
Run the following query:
StormEvents
| extend damage = DamageProperty + DamageCrops
| where damage > 0
| summarize MaxDamage=max(damage), MinDamage=min(damage), AverageDamage=avg(damage) by EventType
| sort by MaxDamage
You should get results that look like the following image:
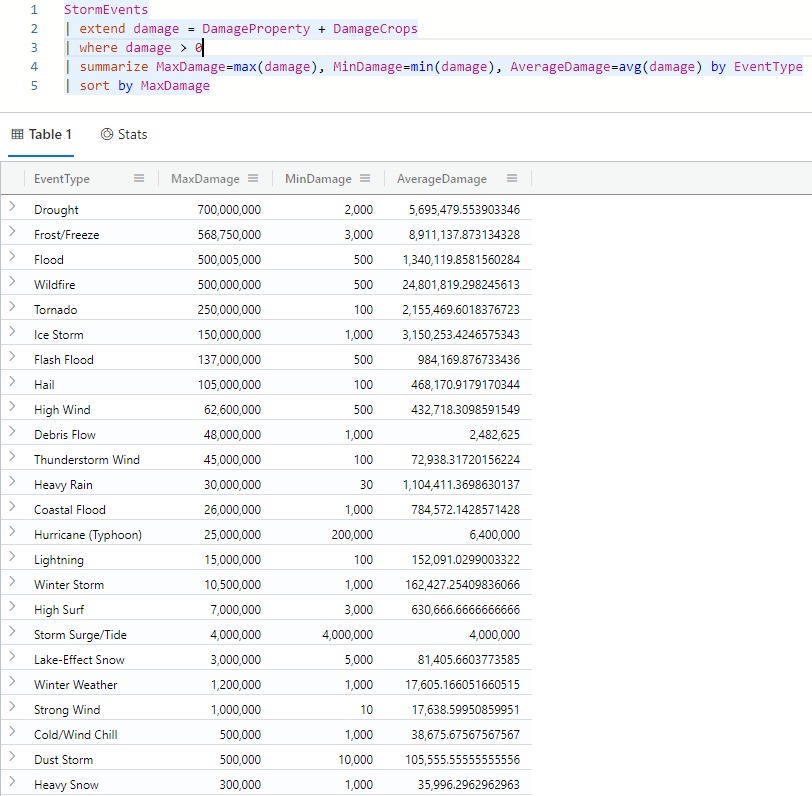
Take a look at the results. Notice that to make the column names friendlier, you renamed the summarized columns within the query to MinDamage and MaxDamage.
Try changing the query to use the
minif()andmaxif()functions. These functions are similar to themin()andmax()functions, but only return the minimum or maximum of the provided expression for records where the predicate returns true. Similarly, you can use thesumif()function to return the sum of the provided expression for records where the predicate returns true.
Use the percentiles() function
So far, you've calculated the min, max, and average values of damage caused by each event. To complete the picture of the distribution of these values, it can be useful to calculate the percentiles. Using the percentiles() function, you can define the input data and the percentiles to calculate. In the following example, you'll calculate the 5th, 20th, 50th, 80th, and 95th percentile values of damage for each event type.
Percentiles, which represent a frequency distribution, shouldn't be confused with percentages, which are a proportion of a whole.
Run the following query:
StormEvents
| extend damage = DamageProperty + DamageCrops
| where damage > 0
| summarize percentiles(damage, 5, 20, 50, 80, 95) by EventType
| sort by EventType asc
You should get results that look like the following image:
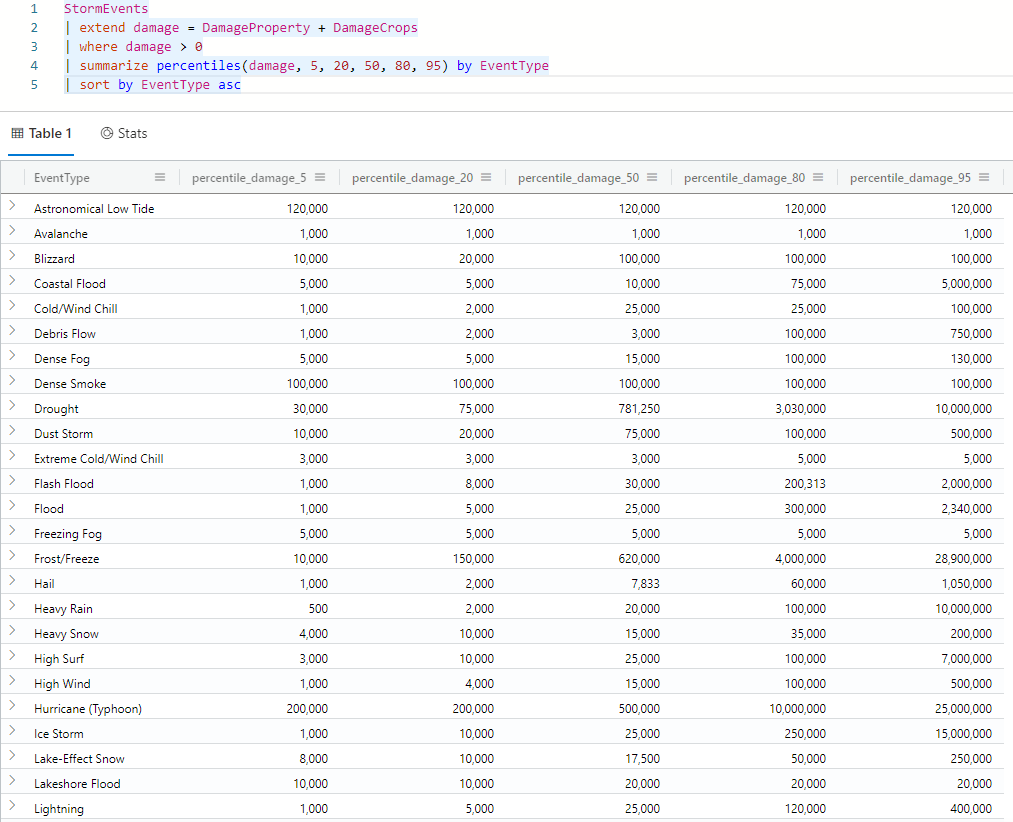
Take a look at the results. Can you identify the median damage caused by floods? The median value is equal to the 50th percentile.