Tutorial: Analyze data in Azure Monitor Logs using a notebook
Notebooks are integrated environments that let you create and share documents with live code, equations, visualizations, and text. Integrating a notebook with a Log Analytics workspace lets you create a multi-step process that runs code in each step based on the results of the previous step. You can use such streamlined processes to build machine learning pipelines, advanced analysis tools, troubleshooting guides (TSGs) for support needs, and more.
Integrating a notebook with a Log Analytics workspace also lets you:
- Run KQL queries and custom code in any language.
- Introduce new analytics and visualization capabilities, such as new machine learning models, custom timelines, and process trees.
- Integrate data sets outside of Azure Monitor Logs, such as an on-premises data sets.
- Take advantage of increased service limits using the Query API limits compared to the Azure portal.
In this tutorial, you learn how to:
- Integrate a notebook with your Log Analytics workspace using the Azure Monitor Query client library and the Azure Identity client library
- Explore and visualize data from your Log Analytics workspace in a notebook
- Ingest data from your notebook into a custom table in your Log Analytics workspace (optional)
For an example of how to build a machine learning pipeline to analyze data in Azure Monitor Logs using a notebook, see this sample notebook: Detect anomalies in Azure Monitor Logs using machine learning techniques.
Tip
To work around API-related limitations, split larger queries into multiple smaller queries.
Prerequisites
For this tutorial, you need:
An Azure Machine Learning workspace with a CPU compute instance with:
- A notebook.
- A kernel set to Python 3.8 or higher.
The following roles and permissions:
In Azure Monitor Logs: The Logs Analytics Contributor role to read data from and send data to your Logs Analytics workspace. For more information, see Manage access to Log Analytics workspaces.
In Azure Machine Learning:
- A resource group-level Owner or Contributor role, to create a new Azure Machine Learning workspace if needed.
- A Contributor role on the Azure Machine Learning workspace where you run your notebook.
For more information, see Manage access to an Azure Machine Learning workspace.
Tools and notebooks
In this tutorial, you use these tools:
| Tool | Description |
|---|---|
| Azure Monitor Query client library | Lets you run read-only queries on data in Azure Monitor Logs. |
| Azure Identity client library | Enables Azure SDK clients to authenticate with Microsoft Entra ID. |
| Azure Monitor Ingestion client library | Lets you send custom logs to Azure Monitor using the Logs Ingestion API. Required to ingest analyzed data into a custom table in your Log Analytics workspace (optional) |
| Data collection rule, data collection endpoint, and a registered application | Required to ingest analyzed data into a custom table in your Log Analytics workspace (optional) |
Other query libraries you can use include:
- Kqlmagic library lets you run KQL queries directly inside a notebook in the same way you run KQL queries from the Log Analytics tool.
- MSTICPY library provides templated queries that invoke built-in KQL time series and machine learning capabilities, and provides advanced visualization tools and analyses of data in Log Analytics workspace.
Other Microsoft notebook experiences for advanced analysis include:
1. Integrate your Log Analytics workspace with your notebook
Set up your notebook to query your Log Analytics workspace:
Install the Azure Monitor Query, Azure Identity and Azure Monitor Ingestion client libraries along with the Pandas data analysis library, Plotly visualization library:
import sys

!{sys.executable} -m pip install --upgrade azure-monitor-query azure-identity azure-monitor-ingestion

!{sys.executable} -m pip install --upgrade pandas plotly
Set the
LOGS_WORKSPACE_IDvariable below to the ID of your Log Analytics workspace. The variable is currently set to use the Azure Monitor Demo workspace, which you can use to demo the notebook.LOGS_WORKSPACE_ID = "DEMO_WORKSPACE"Set up
LogsQueryClientto authenticate and query Azure Monitor Logs.This code sets up
LogsQueryClientto authenticate usingDefaultAzureCredential:from azure.core.credentials import AzureKeyCredential from azure.core.pipeline.policies import AzureKeyCredentialPolicy from azure.identity import DefaultAzureCredential from azure.monitor.query import LogsQueryClient if LOGS_WORKSPACE_ID == "DEMO_WORKSPACE": credential = AzureKeyCredential("DEMO_KEY") authentication_policy = AzureKeyCredentialPolicy(name="X-Api-Key", credential=credential) else: credential = DefaultAzureCredential() authentication_policy = None logs_query_client = LogsQueryClient(credential, authentication_policy=authentication_policy)LogsQueryClienttypically only supports authentication with Microsoft Entra token credentials. However, we can pass a custom authentication policy to enable the use of API keys. This allows the client to query the demo workspace. The availability and access to this demo workspace is subject to change, so we recommend using your own Log Analytics workspace.Define a helper function, called
query_logs_workspace, to run a given query in the Log Analytics workspace and return the results as a Pandas DataFrame.import pandas as pd import plotly.express as px from azure.monitor.query import LogsQueryStatus from azure.core.exceptions import HttpResponseError def query_logs_workspace(query): try: response = logs_query_client.query_workspace(LOGS_WORKSPACE_ID, query, timespan=None) if response.status == LogsQueryStatus.PARTIAL: error = response.partial_error data = response.partial_data print(error.message) elif response.status == LogsQueryStatus.SUCCESS: data = response.tables for table in data: my_data = pd.DataFrame(data=table.rows, columns=table.columns) except HttpResponseError as err: print("something fatal happened") print (err) return my_data
2. Explore and visualize data from your Log Analytics workspace in your notebook
Let's look at some data in the workspace by running a query from the notebook:
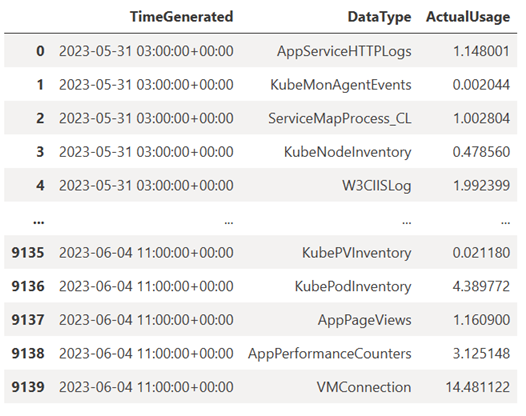
This query checks how much data (in Megabytes) you ingested into each of the tables (data types) in your Log Analytics workspace each hour over the past week:
TABLE = "Usage"

QUERY = f"""
let starttime = 7d; // Start date for the time series, counting back from the current date
let endtime = 0d; // today
{TABLE} | project TimeGenerated, DataType, Quantity
| where TimeGenerated between (ago(starttime)..ago(endtime))
| summarize ActualUsage=sum(Quantity) by TimeGenerated=bin(TimeGenerated, 1h), DataType
"""

df = query_logs_workspace(QUERY)
display(df)
The resulting DataFrame shows the hourly ingestion in each of the tables in the Log Analytics workspace:
Now, let's view the data as a graph that shows hourly usage for various data types over time, based on the Pandas DataFrame:
df = df.sort_values(by="TimeGenerated")
graph = px.line(df, x='TimeGenerated', y="ActualUsage", color='DataType', title="Usage in the last week - All data types")
graph.show()
The resulting graph looks like this:

You've successfully queried and visualized log data from your Log Analytics workspace in your notebook.

3. Analyze data
As a simple example, let's take the first five rows:
analyzed_df = df.head(5)
For an example of how to implement machine learning techniques to analyze data in Azure Monitor Logs, see this sample notebook: Detect anomalies in Azure Monitor Logs using machine learning techniques.
4. Ingest analyzed data into a custom table in your Log Analytics workspace (optional)
Send your analysis results to a custom table in your Log Analytics workspace to trigger alerts or to make them available for further analysis.
To send data to your Log Analytics workspace, you need a custom table, data collection endpoint, data collection rule, and a registered Microsoft Entra application with permission to use the data collection rule, as explained in Tutorial: Send data to Azure Monitor Logs with Logs ingestion API (Azure portal).
When you create your custom table:
Upload this sample file to define the table schema:
[
  {
    "TimeGenerated": "2023-03-19T19:56:43.7447391Z",
    "ActualUsage": 40.1,
    "DataType": "AzureDiagnostics"
  }
]
Define the constants you need for the Logs Ingestion API:
os.environ['AZURE_TENANT_ID'] = "<Tenant ID>"; #ID of the tenant where the data collection endpoint resides
os.environ['AZURE_CLIENT_ID'] = "<Application ID>"; #Application ID to which you granted permissions to your data collection rule
os.environ['AZURE_CLIENT_SECRET'] = "<Client secret>"; #Secret created for the application


os.environ['LOGS_DCR_STREAM_NAME'] = "<Custom stream name>" ##Name of the custom stream from the data collection rule
os.environ['LOGS_DCR_RULE_ID'] = "<Data collection rule immutableId>" # immutableId of your data collection rule
os.environ['DATA_COLLECTION_ENDPOINT'] =  "<Logs ingestion URL of your endpoint>" # URL that looks like this: https://xxxx.ingest.monitor.azure.com
Ingest the data into the custom table in your Log Analytics workspace:
from azure.core.exceptions import HttpResponseError
from azure.identity import ClientSecretCredential
from azure.monitor.ingestion import LogsIngestionClient
import json


credential = ClientSecretCredential(
    tenant_id=AZURE_TENANT_ID,
    client_id=AZURE_CLIENT_ID,
    client_secret=AZURE_CLIENT_SECRET
)

client = LogsIngestionClient(endpoint=DATA_COLLECTION_ENDPOINT, credential=credential, logging_enable=True)

body = json.loads(analyzed_df.to_json(orient='records', date_format='iso'))

try:
   response =  client.upload(rule_id=LOGS_DCR_RULE_ID, stream_name=LOGS_DCR_STREAM_NAME, logs=body)
   print("Upload request accepted")
except HttpResponseError as e:
    print(f"Upload failed: {e}")
Note
When you create a table in your Log Analytics workspace, it can take up to 15 minutes for ingested data to appear in the table.
Verify that the data now appears in your custom table.


Next steps
Learn more about how to:
Зворотний зв’язок
Очікується незабаром: протягом 2024 року ми будемо припиняти використання механізму реєстрації проблем у GitHub для зворотного зв’язку щодо вмісту й замінювати його новою системою зворотного зв’язку. Докладніше: https://aka.ms/ContentUserFeedback.
Надіслати й переглянути відгук про