Tutorial: Troubleshoot function inlining on build time
Use Build Insights Functions view to troubleshoot the impact of function inlining on build time in your C++ projects.
Prerequisites
- Visual Studio 2022 17.8 or greater.
- C++ Build insights is enabled by default if you install either the Desktop development with C++ workload or the Game development with C++ workload.
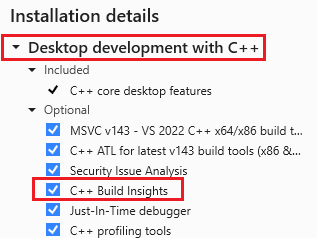
The list of installed components is shown. C++ Build Insights is highlighted and is selected which means it's installed.
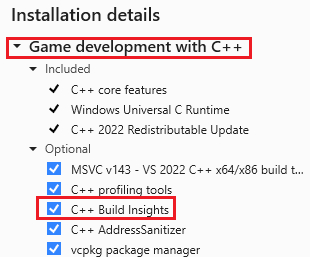
The list of installed components is shown. C++ Build Insights is highlighted and is selected which means it's installed.
Overview
Build Insights, now integrated into Visual Studio, helps you optimize your build times--especially for large projects like AAA games. Build Insights provides analytics such as Functions view, which helps diagnose expensive code generation during build time. It displays the time it takes to generate code for each function, and shows the impact of __forceinline.
The __forceinline directive tells the compiler to inline a function regardless of its size or complexity. Inlining a function can improve runtime performance by reducing the overhead of calling the function. The tradeoff is that it can increase the size of the binary and impact your build times.
For optimized builds, the time spent generating code contributes significantly to the total build time. In general, C++ function optimization happens quickly. In exceptional cases, some functions can become large enough and complex enough to put pressure on the optimizer and noticeably slow down your builds.
In this article, learn how to use the Build Insights Functions view to find inlining bottlenecks in your build.
Set build options
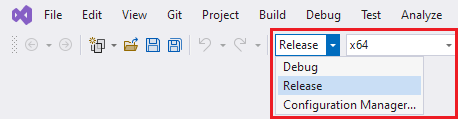
To measure the results of __forceinline, use a Release build because debug builds don't inline __forceinline since debug builds use the /Ob0 compiler switch, which disables that optimization. Set the build for Release and x64:
- In the Solution Configurations dropdown, choose Release.
- In the Solution Platforms dropdown, choose x64.
Set the optimization level to maximum optimizations:
In the Solution Explorer, right-click the project name and select Properties.
In the project properties, navigate to C/C++ > Optimization.
Set the Optimization dropdown to Maximum Optimization (Favor Speed) (
/O2).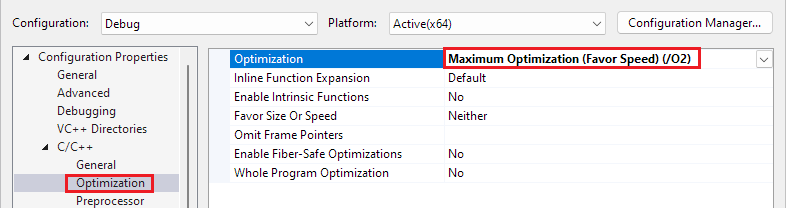
Click OK to close the dialog.
Run Build Insights
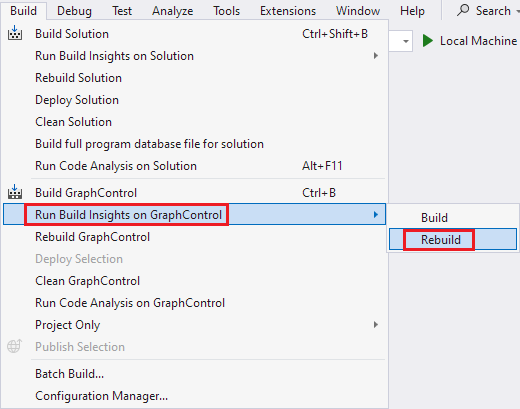
On a project of your choosing, and using the Release build options set in the previous section, run Build Insights by choosing from the main menu Build > Run Build Insights on Selection > Rebuild. You can also right-click a project in the solution explorer and choose Run Build Insights > Rebuild. Choose Rebuild instead of Build to measure the build time for the entire project and not for just the few files may be dirty right now.
When the build finishes, an Event Trace Log (ETL) file opens. It's saved in the folder pointed to by the Windows TEMP environment variable. The generated name is based on the collection time.
Function view
In the window for the ETL file, choose the Functions tab. It shows the functions that were compiled and the time it took to generate the code for each function. If the amount of code generated for a function is negligible, it won't appear in the list to avoid degrading build event collection performance.
In the Function Name column, performPhysicsCalculations() is highlighted and marked with a fire icon.:::
The Time [sec, %] column shows how long it took to compile each function in wall clock responsibility time (WCTR). This metric distributes the wall clock time among functions based on their use of parallel compiler threads. For example, if two different threads are compiling two different functions simultaneously within a one-second period, each function’s WCTR is recorded as 0.5 seconds. This reflects each function’s proportional share of the total compilation time, taking into account the resources each consumed during parallel execution. Thus, WCTR provides a better measure of the impact each function has on the overall build time in environments where multiple compilation activities occur simultaneously.
The Forceinline Size column shows roughly how many instructions were generated for the function. Click the chevron before the function name to see the individual inlined functions that were expanded in that function how roughly how many instructions were generated for each.
You can sort the list by clicking on the Time column to see which functions are taking the most time to compile. A 'fire' icon indicates that cost of generating that function is high and is worth investigating. Excessive use of __forceinline functions can significantly slow compilation.
You can search for a specific function by using the Filter Functions box. If a function's code generation time is too small, it doesn't appear in the Functions View.
Improve build time by adjusting function inlining
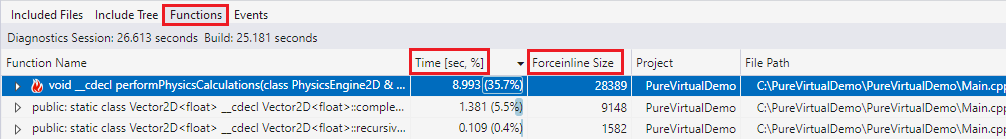
In this example, the performPhysicsCalculations function is taking the most time to compile.
In the Function Name column, performPhysicsCalculations() is highlighted and marked with a fire icon.
Investigating further, by selecting the chevron before that function, and then sorting the Forceinline Size column from highest to lowest, we see the biggest contributors to the problem.
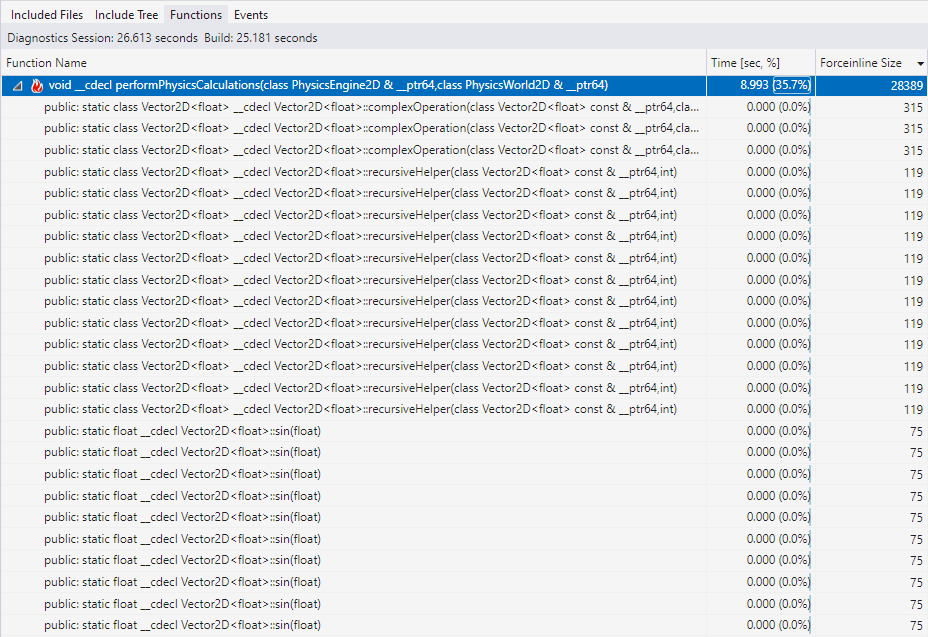
performPhysicsCalculations() is expanded and shows a long list of functions that were inlined inside it. There are multiple instances of functions such as complexOperation(), recursiveHelper(), and sin() shown. The Forceinline Size column shows that complexOperation() is the largest inlined function at 315 instructions. recursiveHelper() has 119 instructions. Sin() has 75 instructions, but there are many more instances of it than the other functions.
There are some larger inlined functions, such as Vector2D<float>::complexOperation() and Vector2D<float>::recursiveHelper() that are contributing to the problem. But there are many more instances (not all shown here) of Vector2d<float>::sin(float), Vector2d<float>::cos(float), Vector2D<float>::power(float,int), and Vector2D<float>::factorial(int). When you add those up, the total number of generated instructions quickly exceeds the few larger generated functions.
Looking at those functions in the source code, we see that execution time is going to be spent inside loops. For example, here's the code for factorial():
static __forceinline T factorial(int n)
{
    T result = 1;
    for (int i = 1; i <= n; ++i) {
        for (int j = 0; j < i; ++j) {
            result *= (i - j) / (T)(j + 1);
        }
    }
    return result;
}
Perhaps the overall cost of calling this function is insignificant compared to the cost of the function itself. Making a function inline is most beneficial when the time it takes to call the function (pushing arguments on the stack, jumping to the function, popping return arguments, and returning from the function) is roughly similar to the time it takes to execute the function, and when the function is called a lot. When that's not the case, there may be diminishing returns on making it inline. We can try removing the __forceinline directive from it to see if it helps the build time. The code for power, sin() and cos() is similar in that the code consists of a loop that will execute many times. We can try removing the __forceinline directive from those functions as well.
We rerun Build Insights from the main menu by choosing Build > Run Build Insights on Selection > Rebuild. You can also right-click a project in the solution explorer and choose Run Build Insights > Rebuild. We choose Rebuild instead of Build to measure the build time for the entire project, as before, and not for just the few files may be dirty right now.
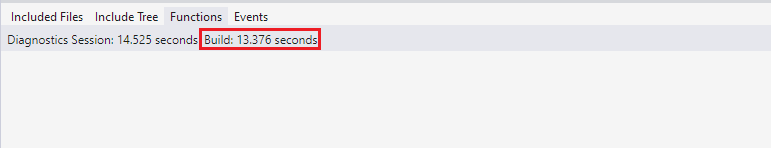
The build time goes from 25.181 seconds to 13.376 seconds and the performPhysicsCalculations function doesn't show up anymore in the Functions view because it doesn't contribute enough to the build time to be counted.
In the Function Name column, performPhysicsCalculations() is highlighted and marked with a fire icon.:::
The Diagnostics Session time is the overall time it took do the build plus any overhead for gathering the Build Insights data.
The next step would be to profile the application to see if the performance of the application is negatively impacted by the change. If it is, we can selectively add __forceinline back as needed.
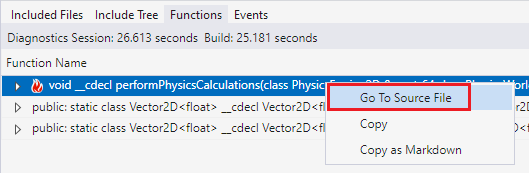
Navigate to the source code
Double-click, right-click, or press Enter while on a file in the Functions view to open the source code for that file.
Tips
- You can File > Save As the ETL file to a more permanent location to keep a record of the build time. You can then compare it to future builds to see if your changes are improving build time.
- If you inadvertently close the Build Insights window, reopen it by finding the
<dateandtime>.etlfile in your temporary folder. TheTEMPWindows environment variable provides the path of your temporary files folder. - To dig into the Build Insights data with Windows Performance Analyzer (WPA), click the Open in WPA button in the bottom right of the ETL window.
- Drag columns to change the order of the columns. For instance, you may prefer moving the Time column to be the first column. You can hide columns by right-clicking on the column header and deselecting the columns you don't want to see.
- The Functions view provides a filter box to find a function that you're interested in. It does partial matches on the name you provide.
- If you forget how to interpret what the Functions view is trying to show you, hover over the tab to see a tooltip that describes the view. If you hover over the Functions tab, the tooltip says: "View that shows statistics for functions where the children nodes are force-inlined functions."
Troubleshooting
- If the Build Insights window doesn't appear, do a rebuild instead of a build. The Build Insights window doesn't appear if nothing actually builds; which may be the case if no files changed since the last build.
- If the Functions view doesn't show any functions, you may not be building with the right optimization settings. Ensure that you're building Release with full optimizations, as described in Set build options. Also, if a function's code generation time is too small, it doesn't appear in the list.
See also
Inline functions (C++)
Faster C++ builds, simplified: a new metric for time
Build Insights in Visual Studio video - Pure Virtual C++ 2023
Troubleshoot header file impact on build time
Functions View for Build Insights in Visual Studio 2022 17.8
Tutorial: vcperf and Windows Performance Analyzer
Improving code generation time with C++ Build Insights