Tutorial: Troubleshoot header file impact on build time
Use Build Insights Included Files and Include Tree views to troubleshoot the impact of #include files on C and C++ build times.
Prerequisites
- Visual Studio 2022 17.8 or greater.
- C++ Build Insights is enabled by default if you install either the Desktop development with C++ workload using the Visual Studio installer:
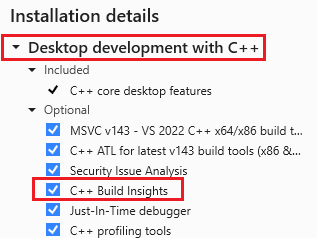
The list of installed components is shown. C++ Build Insights is highlighted and is selected which means it's installed.
Or the Game development with C++ workload:
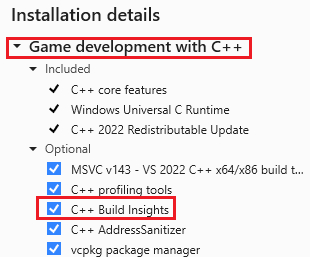
The list of installed components is shown. C++ Build Insights is highlighted and is selected which means it's installed.
Overview
Build Insights, now integrated into Visual Studio, helps you optimize your build times--especially for large projects like triple-A games. When a large header file is parsed, and especially when it's repeatedly parsed, there's an impact on build time.
Build Insights provides analytics in the Included Files view, which helps diagnose the impact of parsing #include files in your project. It displays the time it takes to parse each header file and a view of the relationships between header files.
In this article, learn how to use the Build Insights Included Files and Include Tree views to identify the most expensive header files to parse and how to optimize build time by creating a precompiled header file.
Set build options
Before gathering Build Insights data, set the build options for the type of build you want to measure. For example, if you're concerned about your x64 debug build time, set the build for Debug and x64:
In the Solution Configurations dropdown, choose Debug.
In the Solution Platforms dropdown, choose x64.
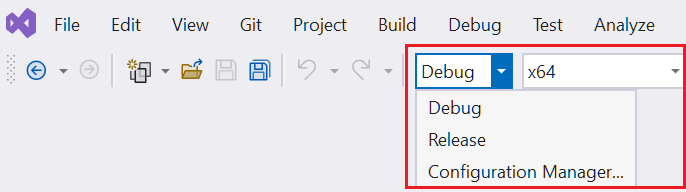
The Solution Configuration dropdown is shown. It has options for Debug, Release, and Configuration manager. The Solution Platform dropdown is set to x64.
Run Build Insights
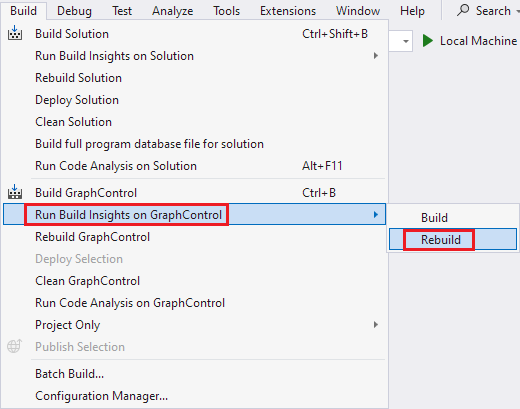
On a project of your choosing, and using the Debug build options set in the previous section, run Build Insights by choosing from the main menu Build > Run Build Insights on Selection > Rebuild. You can also right-click a project in the solution explorer and choose Run Build Insights > Rebuild. Choose Rebuild instead of Build to measure the build time for the entire project and not for just the few files may be dirty right now.
When the build finishes, an Event Trace Log (ETL) file opens. It's saved in the folder pointed to by the Windows TEMP environment variable. The generated name is based on the collection time.
Included Files view
The trace file shows the build time--which for this example was 16.404 seconds. The Diagnostics Session is the overall time taken to run the Build Insights session. Choose the Included Files tab.
This view shows the time spent processing #include files.
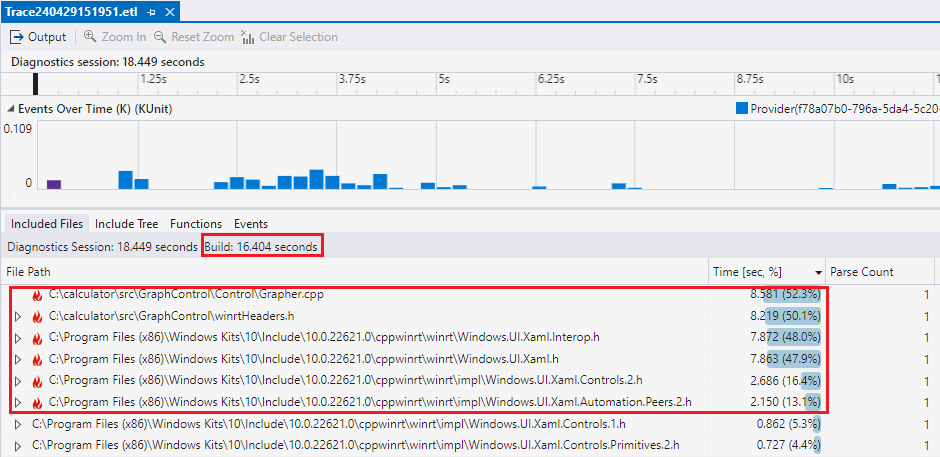
In the file path column, several files with a fire icon are highlighted because they take over 10% of the build time to parse. winrtHeaders.h is the biggest one at 8.581 seconds or 52.3% of the 16.404-second build time.
In the File Path column, some files have a fire icon next to them to indicate that they take up 10% or more of the build time.
The Time [sec, %] column shows how long it took to compile each function in wall clock responsibility time (WCTR). This metric distributes the wall clock time it takes to parse files based on their use of parallel threads. For example, if two different threads are parsing two different files simultaneously within a one-second period, each file's WCTR is recorded as 0.5 seconds. This reflects each file's proportional share of the total compilation time, taking into account the resources each consumed during parallel execution. Thus, WCTR provides a better measure of the impact each file has on the overall build time in environments where multiple compilation activities occur simultaneously.
The Parse Count column shows how many time the header file was parsed.
The first header file highlighted in this list is winrtHeaders.h It takes 8.581 seconds of the overall 16.404-second build time, or 52.3% of the build time. The next most expensive is Windows.UI.Xaml.Interop.h, and then Windows.Xaml.h.
To see which file includes winrtHeaders.h, click the chevron next to it. The Parse Count column can be helpful by pointing out how many times a header file is included by other files. Perhaps a header file is included multiple times, which could be a sign that it's a good candidate for a precompiled header file or refactoring.
The Translation Unit column shows which file was being processed when the included file was processed. In this example, winrtHeaders.h was included while Grapher.cpp was compiled:
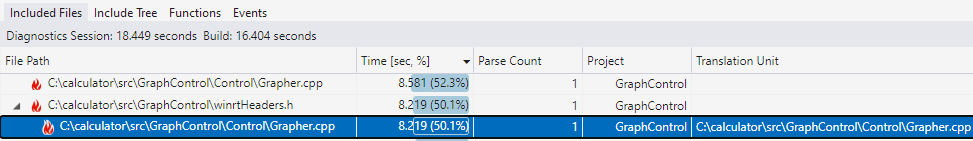
An example ETL file showing the includes files for a sample project. In the file path column, winrtHeaders.h is selected and expanded. It takes 8.219 seconds to build which is 50.1% of the build time. Its child node is Grapher.cpp, which is also listed as the translation unit."
The translation unit column can help disambiguate which file was being compiled in cases where a header file is included many times and you want to find out where that happens the most.
We know that winrtHeaders.h is expensive to parse, but we can learn more.
Include Tree view
In this view, the children nodes are the files included by the parent node. This can help you understand the relationships between header files and identify opportunities to reduce the number of times a header file is parsed.
Select the Include Tree tab in the ETL file to see the Include Tree view:
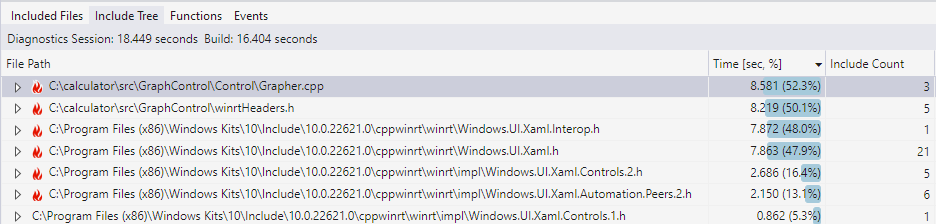
Shows the include tree for a project. In the file path column, each file that includes other files is listed, along with how many files it includes and the time to parse it.
In this view, the File Path column shows each file that includes other files. The Include Count lists how many files this header file includes. The time to parse this file is listed, and when expanded, lists the time to parse each individual header file that this header file includes.
Earlier, we saw that parsing winrtHeaders.h is time consuming. In the Filter Files text box, if we enter winrtHeaders.h, we can filter the view to only the entries that contain winrtHeaders.h in the name. Clicking the chevron next to winrtHeaders.h shows which files it includes:
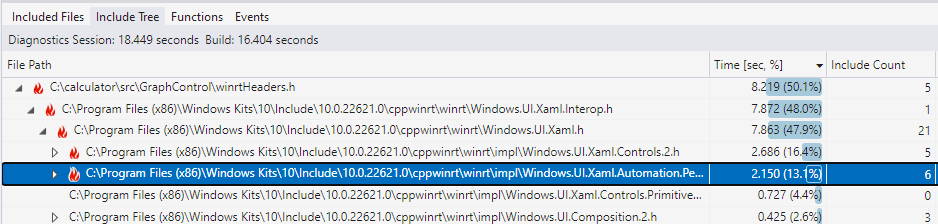
The file path column lists each file that includes other files, along with how many files it includes and the time it took to parse it. winrtHeaders.h is selected and expanded to show the files it includes. Windows.UI.Xaml.Interop.h is one of those files and is expanded to show Windows.UI.Xaml.Interop.h that is expanded to show the header files it includes.
We see that winrtHeaders.h includes Windows.UI.Xaml.Interop.h. Remember from the Included Files view that this was also time consuming to parse. Click the chevron next to Windows.UI.Xaml.Interop.h to see that it includes Windows.UI.Xaml.h, which includes 21 other header files, two of which are also on the hot list.
Having identified some of the most expensive header files to parse, and seeing that winrtHeaders.h is responsible for bringing them in, suggests that we can use a precompiled header to make including winrtHeaders.h faster.
Improve build time with precompiled headers
Because we know from the Included Files view that winrtHeaders.h is time consuming to parse, and because we know from the Include Tree view that winrtHeaders.h includes several other header files that are time consuming to parse, we build a Precompiled header file (PCH) to speed that up by only parsing them once into a PCH.
We add a pch.h to include winrtHeaders.h, which would look like this:
#ifndef CALC_PCH
#define CALC_PCH

#include <winrtHeaders.h>

#endif // CALC_PCH
PCH files must be compiled before they can be used, so we add a file to the project, arbitrarily named pch.cpp, that includes pch.h. It contains one line:
#include "pch.h"
Then we set our project to use the PCH. That's done in project properties via C/C++ > Precompiled Headers and setting Precompiled Header to Use (/Yu) and Precompiled Header File to pch.h.
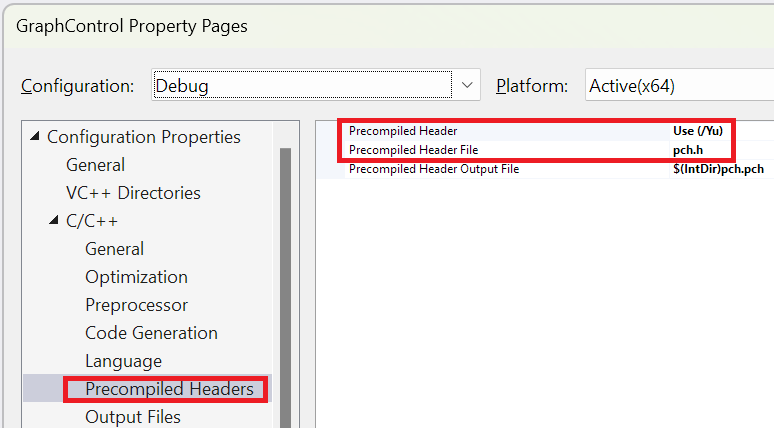
Precompiled Header is set to: Use (/Yu). The Precompiled Header File is set to pch.h.
To use the PCH, we include it as the first line in the source files that use winrtHeaders.h. It must come before any other include files. Or, for simplicity, we could modify the project properties to include pch.h at the beginning of every file in the solution by setting the project property: C/C++ > Advanced > Forced Include File to pch.h:
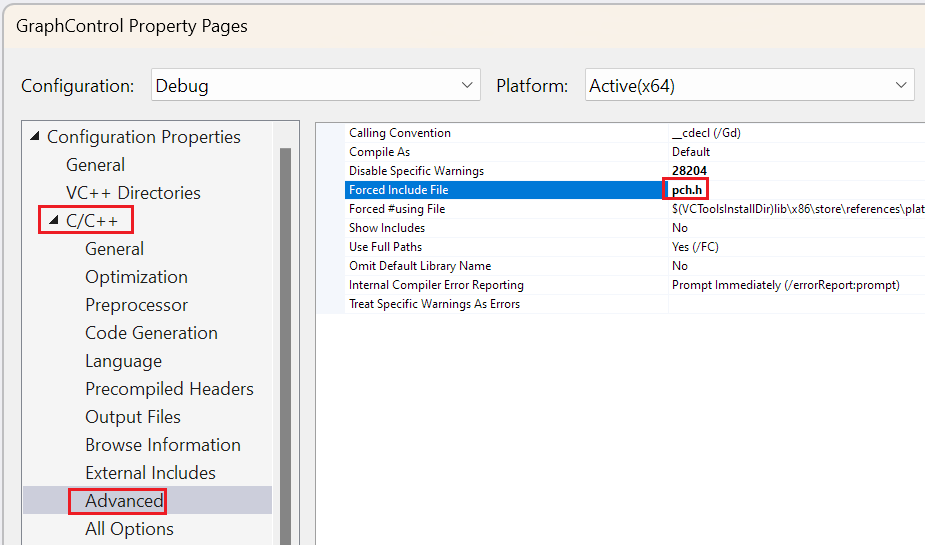
Forced Include File is set to pch.h.
Since the PCH includes winrtHeaders.h, we could remove winrtHeaders.h from all the files that currently include it. It's not strictly necessary because the compiler realizes that winrtHeaders.h is already included and doesn't parse it again. Some developers prefer to keep the #include in the source file for clarity, or in case the PCH is likely to be refactored and may not include that header file anymore.
Test the changes
We first clean the project to make sure we're comparing building the same files as before. To clean just one project, right-click the project in the Solution Explorer and choose Project only > Clean only <prj name>.
Because this project now uses a precompiled header (PCH), we don't want to measure the time spent building the PCH because that only happens once. We do this by loading the pch.cpp file and choosing Ctrl+F7 to build just that file. We could also compile this file by right-clicking pch.cpp in the Solution Explorer and choosing Compile.
Now we rerun Build Insights in the Solution Explorer by right-clicking the project and choosing Project Only > Run Build Insights on Build. You can also right-click a project in the solution explorer and choose Run Build Insights > Build. We don't want Rebuild this time because that will rebuild the PCH, which we don't want to measure. We cleaned the project earlier, which means that a normal build compiles all the project files we want to measure.
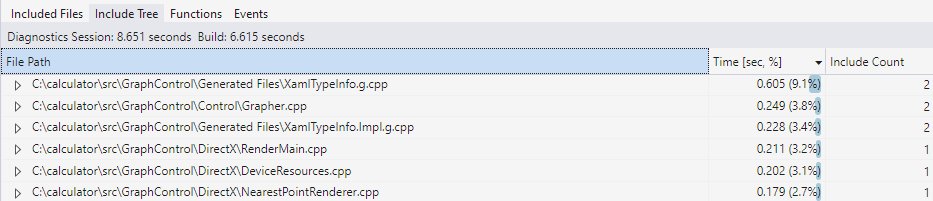
When the ETL files appear, we see that build time went from 16.404 seconds to 6.615 seconds. Put winrtHeaders.h into the filter box and nothing appears. This is because the time spent parsing it is now negligible since it's being pulled in by the precompiled header.
This example uses precompiled headers because they're a common solution before C++20. However, starting with C++20, there are other, faster, less brittle, ways to include header files--such as header units and modules. For more information, see Compare header units, modules, and precompiled headers.
Navigate between views
There are some navigation features for both the Included Files and Include Tree views:
- Double-click a file (or press Enter) in either the Included Files or Include Tree to open the source code for that file.
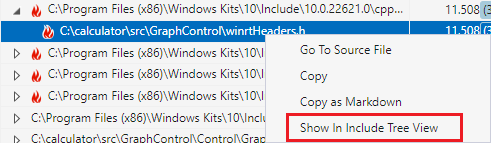
- Right-click on a header file to find that file in the other view. For example, in the Included Files view, right-click on
winrtHeaders.hand choose Find in Include Tree to see it in the Include Tree view.
Or, you can right-click a file in the Include Tree view to jump to it in the Included Files view.
Tips
- You can File > Save As the ETL file to a more permanent location to keep a record of the build time. You can then compare it to future builds to see if your changes are improving build time.
- If you inadvertently close the Build Insights window, reopen it by finding the
<dateandtime>.etlfile in your temporary folder. TheTEMPWindows environment variable provides the path of your temporary files folder. - To dig into the Build Insights data with Windows Performance Analyzer (WPA), click the Open in WPA button in the bottom right of the ETL window.
- Drag columns to change the order of the columns. For instance, you may prefer moving the Time column to be the first column. You can hide columns by right-clicking on the column header and deselecting the columns you don't want to see.
- The Included Files and Include Tree views provide a filter box to find a header file that you're interested in. It does partial matches on the name you provide.
- Sometimes the parse time reported for a header file is different depending on which file includes it. This can be due to the interplay of different
#defines that affect which parts of the header are expanded, file caching, and other system factors. - If you forget what the Included Files or Include Tree view is trying to show you, hover over the tab to see a tooltip that describes the view. For example, if you hover over the Include Tree tab, the tooltip says: "View that shows include statistics for every file where the children nodes are the files included by the parent node."
- You may see cases (like
Windows.h) where the aggregated duration of all the times for a header file is longer than the duration of the entire build. What’s happening is that headers are being parsed on multiple threads at the same time. If two threads simultaneously spend one second parsing a header file, that's 2 seconds of build time even though only one second of wall clock time has gone by. For more information, see wall clock responsibility time (WCTR).
Troubleshooting
- If the Build Insights window doesn't appear, do a rebuild instead of a build. The Build Insights window doesn't appear if nothing actually builds; which may be the case if no files changed since the last build.
- If a header file you're interested in doesn't appear in the Included Files or Include Tree views, it either didn't build or its build time isn't significant enough to be listed.
See also
Compare header units, modules, and precompiled headers
Build Insights in Visual Studio video - Pure Virtual C++ 2023
Faster C++ builds, simplified: a new metric for time
Tutorial: Troubleshoot function inlining on build time
Tutorial: vcperf and Windows Performance Analyzer
Зворотний зв’язок
Очікується незабаром: протягом 2024 року ми будемо припиняти використання механізму реєстрації проблем у GitHub для зворотного зв’язку щодо вмісту й замінювати його новою системою зворотного зв’язку. Докладніше: https://aka.ms/ContentUserFeedback.
Надіслати й переглянути відгук про