Create Data Activator alerts from a Real-Time Dashboard
You can create Data Activator alerts from several data sources in Microsoft Fabric. This article explains how to create Data Activator alerts from a Real-Time dashboard. For more information, see What is Data Activator?.
Alert when conditions are met in a Real-Time Dashboard
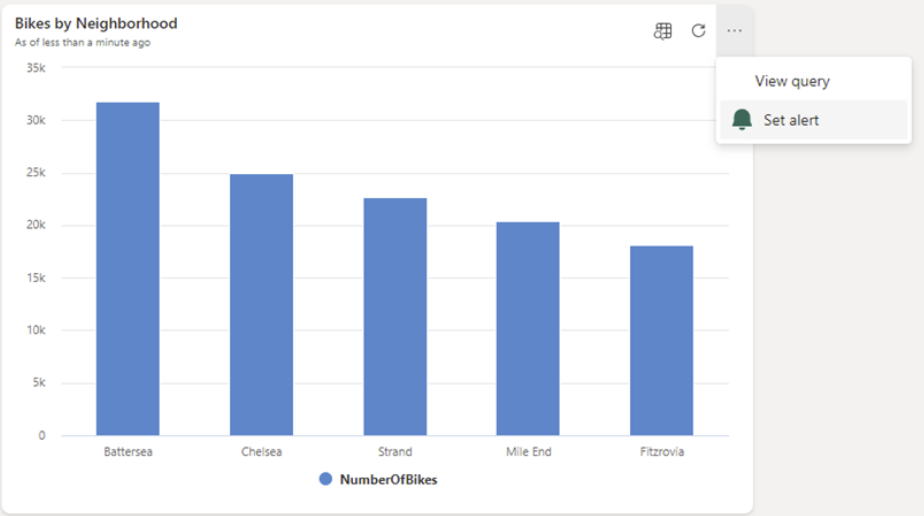
You can use Data Activator to trigger notifications when conditions are met on data in a Real-time Dashboard. For example, if you have a Real-Time Dashboard displaying real-time availability of bicycles for hire in multiple locations, you can trigger an alert if there are too few bicycles available in any one location. You can send alert notifications either to yourself, or to others in your organization, via either email or Microsoft Teams.
Prerequisites
- A workspace with a Microsoft Fabric-enabled capacity
- A Real-Time Dashboard with at least one tile displaying data
Select Set alert on a tile in your Real-Time Dashboard
To begin creating a trigger from a Real-Time Dashboard:
- Browse to your Real-Time Dashboard.
- Toggle from viewing> editing mode in the toolbar.
- Choose a tile on the Real-Time Dashboard for Data Activator to monitor.
- Select the More menu (...) at the top-right of the tile, and select Set Alert. You can also use the Set Alert button in the Real-Time Dashboard toolbar.
Define alert conditions
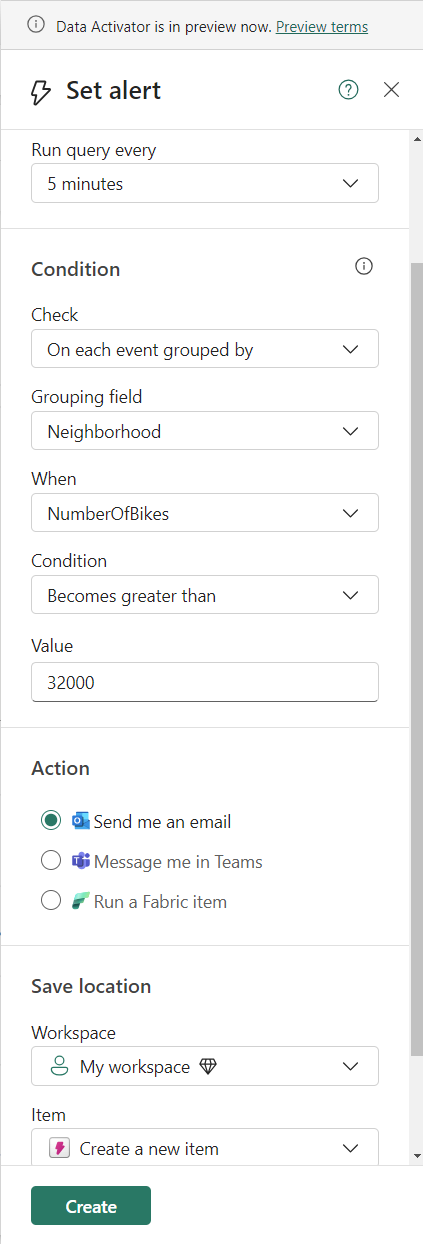
Next, define your alert conditions. In the Set Alert pane that appears, take the following steps:
- In the Conditions dropdown and the *Actions" text box, specify your alert condition.
- In the Action section, specify whether you want your alert via email or Microsoft Teams.
- In the Where to save section, specify where to save your Data Activator alert. You can choose an existing reflex item, or you can create a new reflex item.
- Select Create to create your Data Activator trigger.
Optional: Edit your trigger in Data Activator
When your trigger is ready, you'll receive a notification with a link to your trigger. You can click the link to edit your trigger in Data Activator. Editing your trigger can be useful if you want to do one of the following:
- Add other recipients to your alert.
- Define a more complex alert condition than is possible in the Set alert pane.
For information on how to edit triggers in Data Activator, see Create triggers in design mode .
Limitations on charts with a time axis
If you have a chart with a time axis in Power BI or in a Real-Time Dashboard, then Data Activator will read the measure value exactly once for each point on the time axis. If the measure value for a given time point changes after Data Activator reads it, then Data Activator will ignore the changed value.
Limitation example
The following example illustrates this limitation. In this example, a chart shows number of items sold over time. Data Activator first reads the chart in the morning of 3 January. At this time, the chart shows 10 items sold so far for 3 January:
| Date | Number of items sold |
|---|---|
| 1 January | 20 |
| 2 January | 18 |
| 3 January | 10 |
Later in the day of 3 January, more items get sold. The chart updates to reflect this, and the number of items sold for 3 January now reads 15:
| Date | Number of items sold |
|---|---|
| 1 January | 20 |
| 2 January | 18 |
| 3 January | 15 (changed from earlier in the day) |
Data Activator ignores the changed value, because it has already read a value of 10 earlier in the day.
How to work around this limitation
The most common reason that a measure value can change over time is that the most recent point on the time axis is subject to change. The worked example above is an example of this situation: since the most recent point on the time axis represents the current date, the number of sales can increase throughout the day. The number of items sold on previous days never change, because these dates are in the past. When this situation occurs, there are two ways you can work around it:
- Exclude the current date/time from the chart: you can add a relative time filter to your chart to exclude the current date or time from your chart. That way, Data Activator will see values only once they are final and no longer subject to change.
- Use a card or KPI visual to track the value for the current date: the limitation described here only applies to charts with a time axis. So if you want to alert on values for the current date or time, then you can use a KPI or card visual that shows the value for the current date or time. For example, you could have a KPI visual that displays "sales so far for today". Data Activator will be able to read and respond to changes in this value throughout the day.
Related content
- What is Data Activator?
- Get started with Data Activator
- Assign data to objects in Data Activator
- Create Data Activator triggers in design mode
- Detection conditions in Data Activator
- Use Custom Actions to trigger Power Automate Flows
- Data Activator tutorial using sample data
- What is Microsoft Fabric?
Зворотний зв’язок
Очікується незабаром: протягом 2024 року ми будемо припиняти використання механізму реєстрації проблем у GitHub для зворотного зв’язку щодо вмісту й замінювати його новою системою зворотного зв’язку. Докладніше: https://aka.ms/ContentUserFeedback.
Надіслати й переглянути відгук про