The Case of the High CPU Web Server
This week I was off to Phoenix, AZ again, but for a different customer this time. Phoenix is very hot this time of year – I think it got to about 110 degrees Fahrenheit hot enough to literally cook an egg on the sidewalk and likely burn it. ;-)
When I got the dispatch for this ROSS (Remote On-Site Service), the IIS6 Windows Server 2003 32-bit web server was performing very slowly and was leaking memory very quickly. I was asked to assist with the memory leak and its performance.
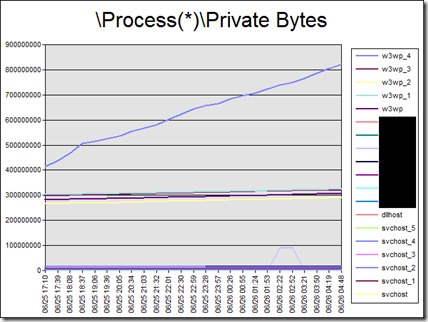
Before my flight to Phoenix, I picked up a few perfmon logs from the customer and analyzed them using my PAL tool (https://pal.codeplex.com) to see if we are really dealing with a memory leak. Confirmed! The “\Process(w3wp#4)\Private Bytes” counter showed a steep increasing trend. Here is a chart showing the increasing trend of Private Bytes in one of the IIS worker processes labeled as w3wp_4.
A steady increasing trend in Private Bytes of a process is an indicator of a memory leak because this is the amount of committed memory that is not shared with any other process. It is normal for processes to consume memory, then release it when it is under less load and it is common for a process to consume memory when it initially starts This is why we look for an increasing trend over a long period of time where the process does not eventually release that memory. In any case, I confirmed the memory leak and the customer also had entries in the Application Event Log of out of memory exceptions (OOM) which means the process eventually ran out of it’s virtual address space - 2GBs in this case because it is a 32-bit server. “\Process(*)\Virtual Bytes” would tell us if the process is close to running out of virtual address space.
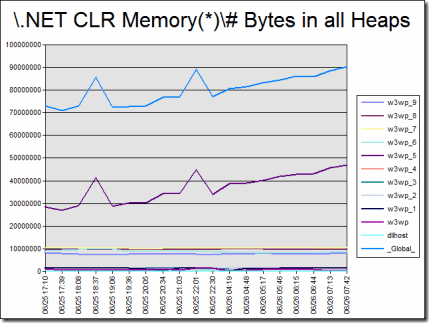
Since this is an ASP.NET v2.0 application, I also checked “\.NET CLR Memory(w3wp#4)\# Bytes in all Heaps” to see if it is on an increasing trend as well. Here is the chart.
As you can see, there might be .NET leaks in other processes, but not the w3wp#4 process that we are seeing the most Private Bytes consumption. This tells me that the leak is not in ASP.NET, but likely due to a native (non-.NET) DLL loaded in memory of this process.
The best tool for memory leak troubleshooting is Microsoft DebugDiag, so I was mentally prepared to use it to troubleshoot this issue. DebugDiag was written by Microsoft Support Professionals to assist customers with memory leaks. It is freely available from Microsoft.com.
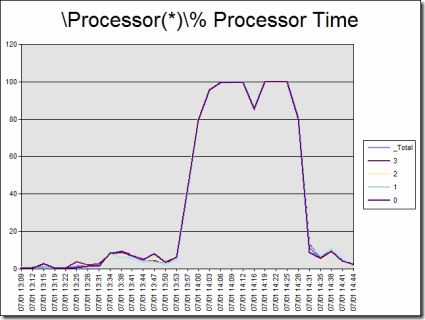
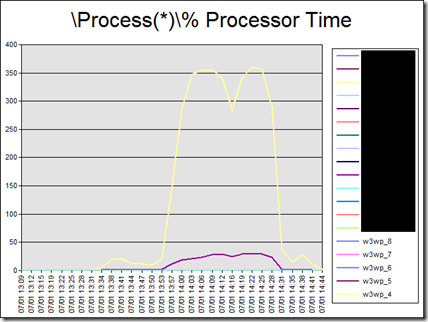
Once I arrived onsite and watched the server’s behavior when under load, I found something completely unexpected. The web server went to 100% CPU as soon as significant load hit it. The memory leak still existed, but the web server response times increased to greater than 60 seconds before the worker process ran out of memory. This told me that while the memory leak is certainly a problem to deal with, but it is *not* the cause of the server’s poor performance right now - it’s a CPU issue now. Here is a chart showing the high CPU consumption.
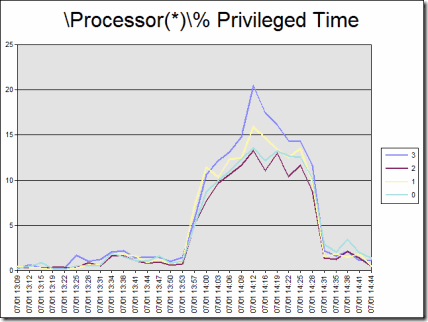
The processors can only be in one of two modes: privileged mode (kernel) or user mode when doing work. High privileged mode CPU issues (more than 30% of CPU time in privileged mode) means the system is spending too much time doing operating system sub routines such as disk I/O, network I/O, thread context switching, bad drivers, etc.
The chart above shows that there is significant Privileged mode CPU time, but it is less than 30% on average – meaning 70% of the time is in user mode (code processing), so our best bet is to see what process(es) are consuming the CPU and find out what they are running.
The chart above shows all of the possible CPU (400% in this case since there is 4 processors) is consumed by w3wp#4. This means we need to profile this process to see what the threads are doing.
Back in the day (and still today), we would get several process dumps of the process and look at the call stacks of the threads. This is similar to taking a picture of an employee working. If you take a picture of the employee at work, then you can get a good idea of what the employee is doing most of the day, right? Suppose the employee was working *very* hard up all night working, and you took their picture when they finally got a chance to sit down – did you properly capture the image of the person’s work ethic? <Brian Regan> I submit you did not!</Brian Regan> Therefore, you take several pictures of the employee throughout the work day hoping to get a good idea what they do all day. This is why we try to capture several process dumps to try to get a relatively accurate idea of what the process is spending all of it’s time on. This method is still valid and used today, but it is invasive (pauses the process when it dumps) and creates large files (DMP files the same size as the private bytes of the process).
By the way, I enjoyed this customer visit a lot because my contact and I were cracking a lot of Brian Regan (comedian) jokes most of the day – I just hope no one was basing our work ethic by our jokes. ;-)
Process profilers are more effective than process dumps in this specific case because they sample the call stacks of the process extremely often. This would be the equivalent of recording the employee with a camcorder all day versus taking pictures of him/her here and there. In this case, we used the Visual Studio 2005 command line Profiler as our tool of choice. We chose the command line version of the profiler because we don’t need or want the full Visual Studio IDE installed on the web server. The command line profiler is able to gather the data, allowing us to analyze it on that server or another computer with the full Visual Studio suite installed for analysis.
We used nearly the exact steps found in the following How To article I wrote:
How To Identify Functions causing a High User-mode CPU Bottleneck for Server Applications in a Production Environment
https://www.codeplex.com/PerfTesting/Wiki/View.aspx?title=How%20To%3a%20Identify%20a%20Disk%20Performance%20Bottleneck%20Using%20SPA&referringTitle=How%20Tos
The one thing that was critical for us, but not covered in the above HowTo guide is that we needed to use the /PACKSYMBOLS parameter, so that the symbols of the application are added to the VSP output file. Symbols are needed to resolve memory offsets to function calls. Maybe I’ll explain symbols in one of my later blog entries.
Here is an example of how to use the PackSymbols parameter to add the symbols to the VSP output file:
vsperfreport /SUMMARY:ALL /packsymbols w3wp.vsp
Originally, the HowTo article (above) was supposed to be in the Microsoft Patterns & Practices Web Performance Testing book, but it was cut because it deals more with performance analysis than testing methodology. I’ve been trying to encourage them to write a book on performance analysis with me, but we’ll see. Maybe all of my blog entries will eventually be compiled into a book.
Due to customer privacy, I cannot and will not post the function calls that we found. With that said, we generally found a lot of time spent in .NET reflection (a method of querying a .NET assembly) and in the creation of dynamic .NET assemblies. Also, please don’t think that I do this alone. I had a lot of help from my PFE colleagues on this one such as Rob Maushardt, Frank “Tag” Taglianetti, Norman Drews, and Matt Perez.
To help further isolate the processor utilization in IIS we also used a tool called the Microsoft Server Performance Advisor (SPA) which is a free download from Microsoft.com for Windows Server 2003 and part of the operating system in Windows 2008 and later. The SPA tool uses performance counter log and Event Tracing for Windows (ETW) to provide detailed information about IIS’s inner workings. Here is a clipping from the SPA report showing a very high amount of CPU consumption by the Default.aspx page.
For more information on how to use the Microsoft Server Performance Advisor (SPA) tool, see my How To article:
How to Identify a Disk Performance Bottleneck Using the Microsoft Server Performance Advisor (SPA) Tool
https://www.codeplex.com/PerfTesting/Wiki/View.aspx?title=How%20To%3a%20Identify%20a%20Disk%20Performance%20Bottleneck%20Using%20SPA1&referringTitle=How%20Tos
Once we had the functions found on the stack the most and cross referenced them with the code in Default.aspx, the customer was able to focus their efforts on specific areas of their code. Unfortunately, there was no quick fix for this performance issue and the customer has a lot of work ahead of them. At the very least, they are on the road to recovery and they know how to identify and alleviate these issues on their own now.
References
Microsoft Server Performance Advisor (SPA)
https://www.microsoft.com/downloads/details.aspx?FamilyID=09115420-8c9d-46b9-a9a5-9bffcd237da2&DisplayLang=en
How to Identify a Disk Performance Bottleneck Using the Microsoft Server Performance Advisor (SPA) Tool
https://www.codeplex.com/PerfTesting/Wiki/View.aspx?title=How%20To%3a%20Identify%20a%20Disk%20Performance%20Bottleneck%20Using%20SPA1&referringTitle=How%20Tos
How To: Identify Functions causing a High User-mode CPU Bottleneck for Server Applications in a Production Environment
https://www.codeplex.com/PerfTesting/Wiki/View.aspx?title=How%20To%3a%20Identify%20a%20Disk%20Performance%20Bottleneck%20Using%20SPA&referringTitle=Techniques%20for%20Performance%20Testing
Comments
- Anonymous
December 11, 2009
Thanks for this article and your blog. I go to it often..
- Stowy
- Anonymous
November 29, 2014
Really useful article, thanks very much.
