Logical Disk Free Space Monitor
Throughout my years working with MOM and Operations Manager 2007, periodically I hear complaints about Operations Manager not alerting on low disk space conditions, or that administrators are receiving false alerts. Just about every time I've been called upon for this type of issue, it turned out to be thresholds not being adjusted properly, not that Operations Manager didn’t do it’s job correctly.
Before I get into this deeply, I want to iterate the importance of having a good disk free space monitoring definition in place. I have seen so many companies struggle with disk free space monitoring, when they really don’t need to. The problem almost always starts with not having a good discussion around your free space requirements, defining the thresholds for server roles and types, and then executing on the design.
This is a basic requirement for monitoring operational health of every server role in your infrastructure. Whether we’re talking about file servers, database servers, web servers or application servers, it is a mistake to put this on the back-burner and not define your requirements as soon as possible for each server role.
Two types of monitoring
My standpoint from a disk space monitoring perspective is simple, and it is aligned with the intent and purpose of Operations Manager. It’s two-fold.
Reactive and Proactive
Although it may seem elementary, let me explain the difference between reactive and proactive monitoring, and how it relates to the Logical Disk Free Space Monitor.
There are two scenarios when it comes to state changes in monitors, and each of these can be paired up with either reactive or proactive type monitoring.
Two-State Monitor = Reactive Only
This monitor has only two states. Healthy is required for one of the states. The other state can be warning or critical. In my opinion, a two-state monitor almost always defines some type of reactive monitoring scenario. In other words, a component being monitored by a two-state monitor is either healthy, or an administrator needs to take immediate action in order to correct the problem. This is synonymous to ON and OFF. There is no period of time where this component is in a degraded state, but still functioning, that allows an administrator to take remediation actions to correct the issue before it worsens.
Three-State Monitor = Reactive and Proactive
This monitor has three states. Healthy, Warning and Critical. The rules are similar to the Two-State monitor, as far as Healthy and Critical states are concerned. However, there is an additional state that connotes a degraded condition. In a degraded condition, the service or component is still functioning, but there are problems on the horizon if the administrator doesn’t plan to take remediation actions at the earliest convenience.
With this additional Warning (or degraded) state, we lend another type of monitoring to our operational monitoring; Proactive. Although this borders on both Reactive and Proactive, this is still very much proactive, in my opinion, because the administrator is informed of a degraded condition before is turns critical.
How does this relate the Logical Disk Free Space monitor? Well, this is a Three-State monitor. Hence, we are provided with the best of both worlds from an operational standpoint. Both Proactive and Reactive.
Another part of Proactive monitoring is provided by the reporting feature in Operations Manager. This goes above and beyond the capabilities of having a monitor warn your staff of a degraded state. This arms you with the capability to perform trend analysis of your applications and hardware, allowing your company to use this information for planning and provisioning resources in your infrastructure.
My argument
I have been in my share of arguments around monitoring disk space, usually relating to general recommendations for the threshold types used in this monitor. One of the most heated arguments I’ve heard around these thresholds, is to only use one type of threshold; either the MB threshold or the Percentage threshold. My argument has always been to use both these threshold types, and not to generalize an entire IT infrastructure based on a single threshold type.
By using only one threshold type, I don’t see how anyone could encompass the array of disk sizes and different types of server roles in the environment, and define a disk free space monitoring solution using only one threshold type. In my opinion, using only one threshold type generalizes all the unique attributes that make up the infrastructure as a whole. All I ask is that you read this article before making a decision as to how you’re going to use this monitor.
The problem
I’ve done my time going through the ranks of systems administration. And this includes carrying a pager, and reacting to alerts from that pager, 24/7. This being the case, I know one thing for sure. And that is…
I do not want to be stirred out of a deep sleep, pulled away from my family or have my golf game interrupted, in order to check on an alert that was triggered, only to find there was plenty of free space on the server I was alert on.
Sound familiar? I bet it does.
If you answer yes to any of the below questions, your reactive thresholds are not adjusted correctly.
1. At the earliest convenience, do you adjust the threshold for that instance? Or, just disable monitoring for that drive and be done with it (I have seen this done).
2. Do you have a routine down, and you know exactly when that alert will trigger, so you auto-respond to that alert without actually checking it? Or have you started ignoring alerts altogether?
5. Do you end up just checking on that server every day when you come in and when you leave, and see that it’s grown by 100MB each day, just waiting to bring it up in a meeting to allocate more drive space?
Whatever the case may be, you know that this drive is not in a critical state and there is no need to be alarmed yet. Growth of that particular disk has always averaged around 100MB a day, and you know the SAN group will not allocate more space until it’s down to 10GB free.
Make your case
To the on-call admin wearing the pager, listen up. I’m offering this argument to you, so you can then present your ideas to the operations monitoring group.
First thing you’ll want to do is download the Logical Disk Free Space Monitor Calculator (attached to bottom of article). Also grab this query, to help map out what your current disk sizes look like. A method I often use is, plug in the largest disk size, the smallest disk size, and the average disk size in the the calculator. Then start playing with the thresholds in the calculator to determine your unique threshold requirements for both System and Non-System drives.
First things first. How does the Logical Disk Free Space monitor work, when using both the MB and % threshold types? Here’s how.
The moment BOTH thresholds are exceeded, the state of that monitor will change.
Some basics of the monitor. This monitor is targeted to each type of Windows Server (2000, 2003 and 2008). Just keep that in mind when adjusting thresholds.
This is a double-threshold, three-state monitor. However, being that there two types of thresholds (MB and %), there is actually four thresholds that need to be set for this monitor.
Go ahead and open up the monitor properties and take a peak at the thresholds. To do this, go to the Authoring space.

Click on Monitors, then click Scope.

Type Logical Disk in the Look for input box, and check all three targets (for each type). Then click okay.

If you expand each of the types, as shown in the image below for 2003 type, you’ll find the monitor. Do not confuse the Free Space monitor with the Availability monitor.
Open the properties of the monitor.

As you’ll see, these thresholds are also split into to types of drives; System and non-System. This may sound confusing, but it’s really quite simple and there is good reason for it. As you might expect, System type drives host the operating system. Non-System type drives are all other drives.
And here are the tabs showing the properties of the monitor.

The reason for the two types of drives is because, drives that host the operating system are usually well-defined with specific volume sizes. These drives usually do not fluctuate in free space. And if they do, we monitor that. But, the monitoring is generally much more strict and will match as closely as possible to a true warning or critical state for the operating system to function properly.
In other words, a System type drive with 500MB of free space is okay. This drive doesn’t need to generate an alert unless it drops below, for example, 200MB. That’s when we would actually do something to free up some space. That’s when we need to be paged. That truly warrants an alarm.
Out of the box, the System type drive thresholds are as follows.
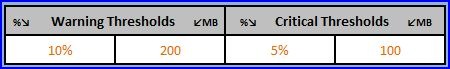
Also by default, this monitor generates an alert when it changes to critical. What this means to you, is you’ll see a state change in the Operations Console when the drive hosting the operating system drops below 200MB. This state will persist, allowing you to catch this warning state in the console before it reaches critical state, or until someone moves some files off and creates more free space.
There is a state view specifically for monitoring Logical Disk free space in the Microsoft Windows Server node of the monitoring pane in the Operations Console. You can also create a view in My Workspace to spot check a specific set of servers for drives in a Warning state once each day. This is part of the proactive monitoring I mentioned.
So, when the drive hosting the operating system drops below 100MB, you’ll get a page and an alert in the Operations Console. Again, this is when action must be taken with urgency. Hence, critical or reactive.
Out of the box, the non-System type drive thresholds are as follows.
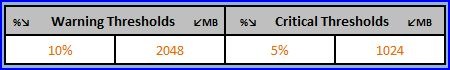
As far as non-System type drives, this is usually the tricky threshold that needs to be discussed with your operations team. This is when you can put my disk space calculator to use.
I’m not going to get into semantics about all the different server roles and make recommendations for types of server roles. I’ll just note that the type of server is an important factor in determining disk space monitoring requirements. For instance, database servers will usually have different disk space monitoring thresholds than file servers.
I will, however, be using a file share server role in an example. This is only to get you thinking in the right direction, and is not intended to be a recommendation.
Scenario:
The company has 40 Windows Server 2003 File Share Servers. The majority of these servers have a 40GB system drive, hosting the operating system, with the exception of a handful of servers that were installed in 2003. At the time, the standard build was a 20GB system drive.
For the file shares, most later model servers have one 800GB volume. There are quite a few servers with two 300GB volumes. Then there are a few older model servers, which have two or four 80GB volumes.
The questions that need to be answered are:
What is a warning state?
This is the state in which your administrators need to be informed of a degraded situation. At this state of the monitor, there is time to take action to resolve the issue before it turns into a critical state. In other words, this the proactive threshold.
What is a critical state?
This is the state in which your administrators need to be alerted of a critical situation. In this state, an alert will be raised in the Operations Console and a page will be sent to your on-call administrator. This state connotes an urgent issue, and action must be taken at once. In other words, this is the reactive threshold.
These questions need to be answered for both types of drives.
System Drives
In your meeting with the operations monitoring team, these thresholds and state were discussed, and everyone agreed upon the following. Regardless of the size of the system drive, 20GB or 40GB, and considering the operating system drive usually doesn’t fluctuate, and the fact that nobody should be storing data on those drives anyway, a warning should be raised when free space drops to 500MB.
This should give administrators adequate elbow room to proactively monitor for warning conditions and take remediation actions at the soonest opportunity.
Everyone also agreed that we only need an on-call admin to be paged if a drive hosting the operating system drops below 100MB. This is considered critical, as this will affect operating system performance and render it unresponsive soon, and we want someone paged to move files off that drive immediately.
Using the calculator, you determine that the thresholds for the system drive should be adjusted as follows.

Note that only a single threshold needed to be adjusted. The critical MB threshold, by default, meets our requirements. And both the warning and critical % thresholds, by default, meet our requirements. We need to create an override, for the file share servers, only for the warning MB threshold.
Here’s what it looks like in the calculator.

Remember, our decision was based on MB thresholds only. We did not even care about % free space.
Given that 10% and 5%, for warning and critical, are well over our defined 500MB and 100MB, respectively, given our drive sizes, we don’t need to play with the % thresholds. Technically, these % thresholds will be exceeded on our 40GB drives at 4GB and 2GB, for warning and critical.
Remember that both MB and % need to be exceeded, in order for a state change to occur. So, again, we only need to create an override for the warning MB threshold. And that override setting is 500MB.
Non-System Drives
Remember, most later model servers have one 800GB volume. There are a few with two 300GB volumes. Then there are a few older model servers, which have two or four 80GB volumes.
As I mentioned earlier, these non-system drives are usually a bit trickier to find a good balance. This is because there is a vast difference in volume sizes, and we’re trying to wrap our heads around a happy medium.
In the meeting with the operations monitoring team, we discussed only using the % threshold, and setting it at 10% and 5% for warning and critical, respectively. This didn’t go over very well. Because, again, we don’t want to wake our on-call admin up in the middle of the night because there was only 40GB left on a file share. That’s not exactly an urgent issue. Plus, we already know about that server and we’re expecting addition drive space to be allocated on Wednesday. We knew this because we saw the state change in the Operations Console when that volume dropped to 80GB two weeks ago.
We discussed only using the MB thresholds, adjusting them to 20GB and 4GB, for warning and critical, respectively. This didn’t go over well, because we really don’t want to wake the on-call admin again when one of the smaller 80GB drives drops to 4GB free space. These are not high volume drives, and when they are out of space we plan to move that data off to a larger volume anyway.
Rather than jumbling with these numbers, you break out the calculator, plug in the volume sizes (800, 300 and 80GB), and start plugging in some threshold values. After a few iterations, everyone liked the following thresholds.

Notice in the middle columns in the calculator, that the 800GB drive changes state for both warning and critical on only the MB threshold value. The 80GB drive changes state for both warning and critical on only the % threshold. The 300GB actually will use the % threshold value for the warning state change, and the MB threshold value for the critical state change.
This is a great balance for these file share servers. Each size volume has an adequate warning threshold, to allow plenty of time to proactively monitor these warning states and take action at the earliest convenience.
This also generates a critical state, subsequently generating an alert in the Operations Console and paging the on-call admin. These are all truly critical states, that require immediate action.
This meets all our requirements to expedite warning and critical states appropriately. And, most importantly, you’re on-call admin will appreciate that we have a good definition around monitoring disk space. Now he’s taking these pages seriously, and isn’t bothered for non-critical conditions.
Using Views for Proactive Monitoring
With well defined thresholds around disk free space monitoring, allowing for ample time to take action without urgency, we can use the Logical Disk state view in the Operations Console to proactively monitor free disk space. Checking this state view once per day will be a part of the daily routine.
You can find this state view here.

What we’re looking for here are servers in a warning state. If you have hundred, or thousands of servers, you can make this easier to look at by sort by the State column header.
If you want a more targeted view, containing only file share servers in a warning state, you can create a new state view in My Workspace. Here’s an example of such view.

So, not only are we monitoring for reactive conditions, we are also proactively monitoring disk space by means of establishing well defined thresholds for the Logical Disk Free Space monitor.
Again, as I mentioned earlier, another important piece of proactive monitoring is the report feature in Operations Manager. We can take proactive measures much further by using the reporting component. This will give us even richer information, like trend analysis for future planning and provisioning of resources.
I hope now you have a good understanding of how this monitor works. Along with the given example, and the free space calculator, you should now be armed and ready to tackle these disk free space alerts that have been so troubling for so many…especially for those on-call administrators.
Get the Logical Disk Free Space Calculator here
Comments
Anonymous
January 01, 2003OpsMgr 2007 R2 on Windows 2003 setup steps guide download (6.7 M)
Use Server Manager, Add Features
Anonymous
January 01, 2003
Hi - You should be able to see your override values if you select override summary from properties or fly-out menu by right-clicking on the monitor.Anonymous
January 01, 2003
okay, if I can't have a view specifically for disk space state, now I have to create 3 views for logical disk- 2000, 2003, 2008? I can't combines these classes into one?Anonymous
January 01, 2003
Hi Hufe, Take a look at this post here: http://blogs.technet.com/jonathanalmquist/archive/2009/04/08/exclude-drive-from-logical-disk-free-space-monitoring-part-1.aspx Use the exact same method to achieve what you're trying to do. -JonathanAnonymous
January 01, 2003
I'm not sure. Are you looking at the default value, or the applied value?Anonymous
January 01, 2003OpsMgr 2007 R2 on Windows 2003 setup steps guide download (6.7 M)
Use Server Manager, Add Features
Anonymous
January 01, 2003
The comment has been removedAnonymous
January 01, 2003
The comment has been removedAnonymous
January 01, 2003
Really helpt me a lot. Thanks for this very clear en well documented articleAnonymous
January 01, 2003
ahh, of course. I wanted to replicate this view so that I can restrict the content to certain groups. Thank you very much Jonathan.Anonymous
January 01, 2003
Paul, First, to answer your question...no. I do not recommend configuring thresholds for each disk size. This isn't manageable. The whole idea behind this post is that we do NOT need to configure thresholds for each disk size. The calculator tool here is to help identify a "happy balance" for ALL your disk sizes. The intent is to configure acceptable default thresholds (both % and MB) for all disk drives in your environment. As noted in the post, I recommend setting these thresholds for TYPES of servers, as disk drive space thresholds on particular server types may be different than other server types. Other than specifying for server type, the idea is to set the default thresholds on the monitor that offers a good balance for ALL disk drive sizes. Please use the disks sizes query I supplied in the post to determine what are the disk sizes in your environment, as this will help determine these thresholds. I recommend plugging in the smallest and largest disk size, as well as the average disk size, into the calculator. This has worked well with my customers. What we're trying to determine here is a good default threshold for both threshold types (% and MB). This is very specific to your needs. That's why I do not give recommendations here. Instead, I give you the knowledge and tools for you to determine what is best. -JonathanAnonymous
January 01, 2003
The comment has been removedAnonymous
January 01, 2003
Hi Dom - I know there are some problems with disks being undiscovered/rediscovered in some failover situations, but I don't recall hearing of your specific issue before. Without ranting, I personally think there should be a dedicated disk monitoring MP, and should have better workflows built around different types of disks to cover situations like this. Would love to write this, but would take time...Anonymous
January 01, 2003
The comment has been removedAnonymous
January 01, 2003
jdear, There really is no good solution to create state views based on specific monitor state, since state views are based on class, not on a per-monitor basis. -JonathanAnonymous
January 01, 2003
I see that you answered a question previously about the possibility of multiple notifications being triggered from a severity change on an alert. I understand that this won't work by simply creating 2 different subscriptions, but is there another way to achieve this? I want to send out emails when a warning alert is generated, and send out a message to our pagers when an alert moved to critical. (I hope this doesn't double-post. I waited hours, and nothing showed up.) Great post by the way. Well explained.Anonymous
January 01, 2003
I too need to create a view for servers with disk space in non-healthy state. But targeting Logical Disk also will get disk performance states, which I do not want included in the View that is meant for disk space state only. How do I get around this? thanks.Anonymous
January 01, 2003
The comment has been removedAnonymous
January 01, 2003
this was a good info for this subjectAnonymous
January 01, 2003
@Casey - Thanks for the note. I attached the calculator to the bottom of the post.Anonymous
January 01, 2003
Hi Machaibar, Yes, you can do this by overriding the "Alert on State" parameter and setting it to "The monitor is in a critical or warning health state". -JonathanAnonymous
January 01, 2003
Hey Paul - That's one way to go about it, but in my experience the method you describe causes a lot of additional override management for the SCOM admin. One of the reason we have the two threshold types is to reduce the number of overrides we need to create to cover all disk sizes. Thanks for the input!Anonymous
January 01, 2003
@Mark67 - if you are savvy with authoring MP's, you could "forklift" the logical disk free space monitor and put into your own custom MP - twice. So, name one Free Space Critical and the other Free Space Warning. Setup the monitors just as they are in the vendor MP, and set your thresholds. Now subscriptions will generate notifications both on warning and critical. There are probably other ways to do it, I'm sure, but this is the route I would take if I needed to tackle your problem. In my opinion, it's better to change monitoring than it is to change other moving parts - like notificaiton channels and getting fancy with extensibility.Anonymous
January 01, 2003
jdear, You can create a state view and scope it to Logical Disk, which is in the Windows Core Library. This will pick up the state of Windows 2003 and 2008 Logical Disks. But, just so you know, this view actually already exists in the Monitoring pane under Microsoft Windows Server > Logical Disk State view. -JonathanAnonymous
January 01, 2003
I can see Health state, but what if i want to use with specific size (bytes) > certain size 30 gb. I tried using [>30000000000] , and its not working at all. Please advise. Many thanksAnonymous
January 01, 2003
@Tyler We can include columns in state views for data that is discovered. Disk free space is not discovered data. It is, however, collected as performance data. So you could create a performance view that shows, for example, LogicalDisk% Free Space. -JonathanAnonymous
January 01, 2003
Jonathan, thank you so much for this post. It is really helpful! I have a question and maybe you can help me with this as well. I successfully configured Override for all objects of class Windows Server Logical Disk. I changed the default values of Warning and Error % Threshold, Warning and Error MBytes Threshold for System drives. I put it into new management pack. But when i open properties of Logical Disk Free Space monitor, and then go to System Drive % tab or System Drive MBytes tab, i see the same default values of threshold. It seems that nothing have changed. Is it possible to view the changes on this tab? Maybe i did something wrong? Thank you for your help!Anonymous
April 29, 2009
Best on this problem I have seen so far. Thankyou for your efforts Jonathan. John BradshawAnonymous
June 10, 2009
Could you go into more detail on exactly how you setup your monitors and overrides in OpsMgr? Are you running multiple monitors for each disk size?Anonymous
July 16, 2009
The comment has been removedAnonymous
July 31, 2009
Bravo, thank you for the writeup. This made monitoring the disk space very clear.Anonymous
February 18, 2010
Totally agree on the proactive approach. But how can I change the percentage of one particular disk (disk used by windows backup)?Anonymous
March 18, 2010
Hello Jo, Thanks for the nice post, i do have some questions though: 1- Any special add to this post Incase of clusterd disks? 2- And how SCOM will react in the in-active nodes for example regarding the clusted disks?Anonymous
March 18, 2010
The comment has been removedAnonymous
April 23, 2010
Hi Jonathan, Thanks for the clarifications. I have one question. Is there a way to get email notification when the warning threshold is met rather than having to go in to the console to check it?Anonymous
May 26, 2010
I have the issue that when overriding the alert on state to "warning or critical", that no notifications are send when the alert is changing from warning to critical. Is this by design when you use the override functionality or can this be prevented in a way?Anonymous
July 21, 2010
is there a way to create a view that actually SHOWS the free space (MB free) for each of the servers? It would be great to be able to add that as a column and be able to sort on that data (whether in "My Workspace" or in the Logical Disk State view.Anonymous
September 09, 2010
Nicely written and very helpful. Gd show.Anonymous
February 04, 2011
The comment has been removedAnonymous
May 27, 2011
awesome! very helpful !Anonymous
May 29, 2011
Hi Jonathan, Where we can find the ALERT ON STATEoption in SCOM? to set the the warning level as critical one, so that we can get mail in he warning level only...Anonymous
July 02, 2011
Great post Jonathan! I look forward to putting it into practice. The links to your calculator are dead. Is there anywhere else I can pick it up from?Anonymous
March 16, 2012
The comment has been removedAnonymous
June 01, 2012
Hello, How are the "System Drive" of a Cluster are treated? I have a C: Drive on a Cluster node where all active drives and services have failed over the other node.This C: drive seems to be seen as a non-system drive now as the threshold for the disk space % and MB are sending alerts accordingly to this non-system monitor. Is it expected? Thanks, DomAnonymous
February 19, 2013
Hi Jonathana, Please let me know whether this is possible to set up the logical disk monitor for the below conditions. < 100 GB - generate warning at 20%, and alert at 10% > 100 GB .and. < 1 TB - generate warning at 10%, and alert at 5% > 1 TB - generate warning at 5%, and alert at 2% If a drive size is changed due to resizing on the SAN, SCOM needs to automatically detect the new size, and apply the correct rule.Anonymous
May 29, 2013
When I try to change the threshold range nothing happens, I change it, click close, open it again and the value is still the default!