Lưu ý
Cần có ủy quyền mới truy nhập được vào trang này. Bạn có thể thử đăng nhập hoặc thay đổi thư mục.
Cần có ủy quyền mới truy nhập được vào trang này. Bạn có thể thử thay đổi thư mục.
The Azure Data Explorer web UI has a samples gallery where you can view built-in dashboards without the need to create your own cluster and database or ingest data. By using dashboards, you can manipulate different parameters and visuals to gain insights from your data.
In this quickstart, you learn how to access and explore the built-in dashboards in the Azure Data Explorer web UI samples gallery. You don't need knowledge of Kusto Query Language (KQL) to create and modify your dashboards, but it can be used for further customization.
Prerequisites
A Microsoft account or a Microsoft Entra user identity to sign in to the help cluster. An Azure subscription isn't required.
Explore sample dashboards
Sign in to the Azure Data Explorer web UI by using your Microsoft account or Microsoft Entra user identity.
In the Home page, select Explore sample dashboards.
In the Explore sample dashboards dialog box, choose a sample dashboard, and then select Explore. To match the previous example, select the Metrics sample dashboard.
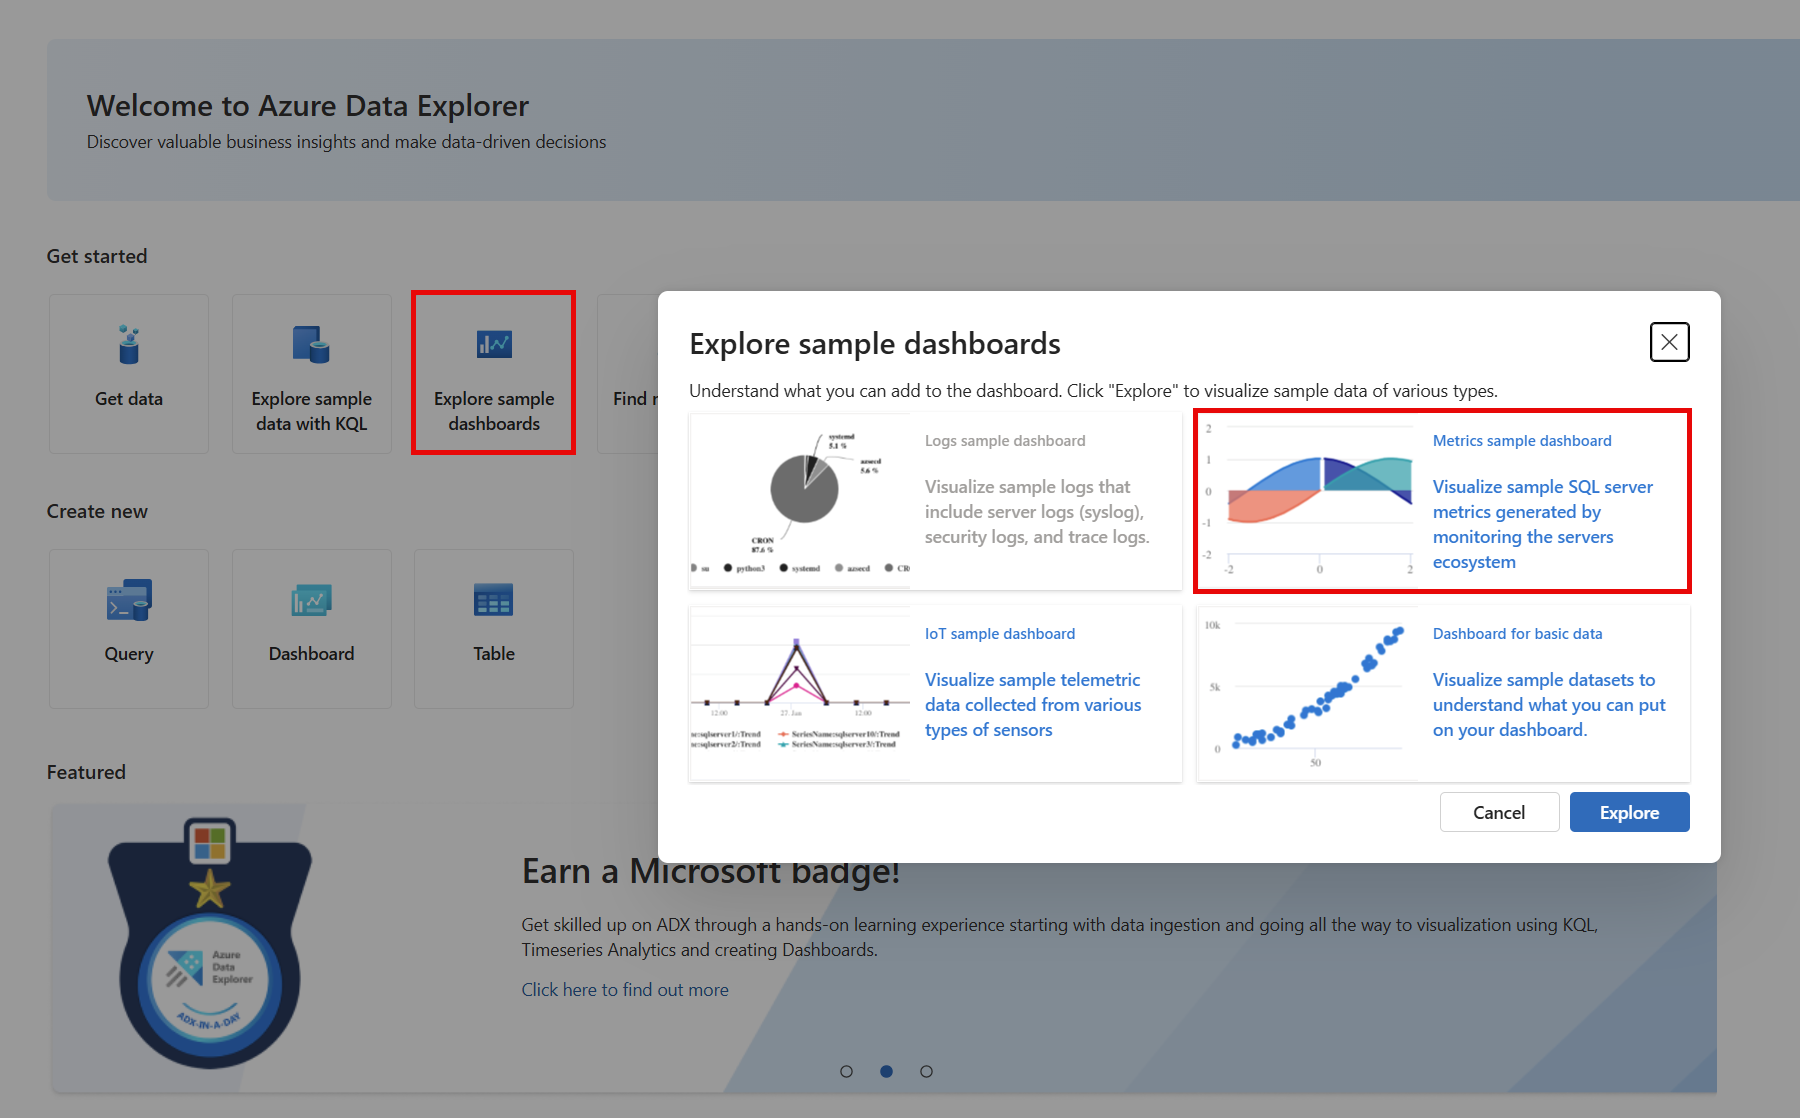
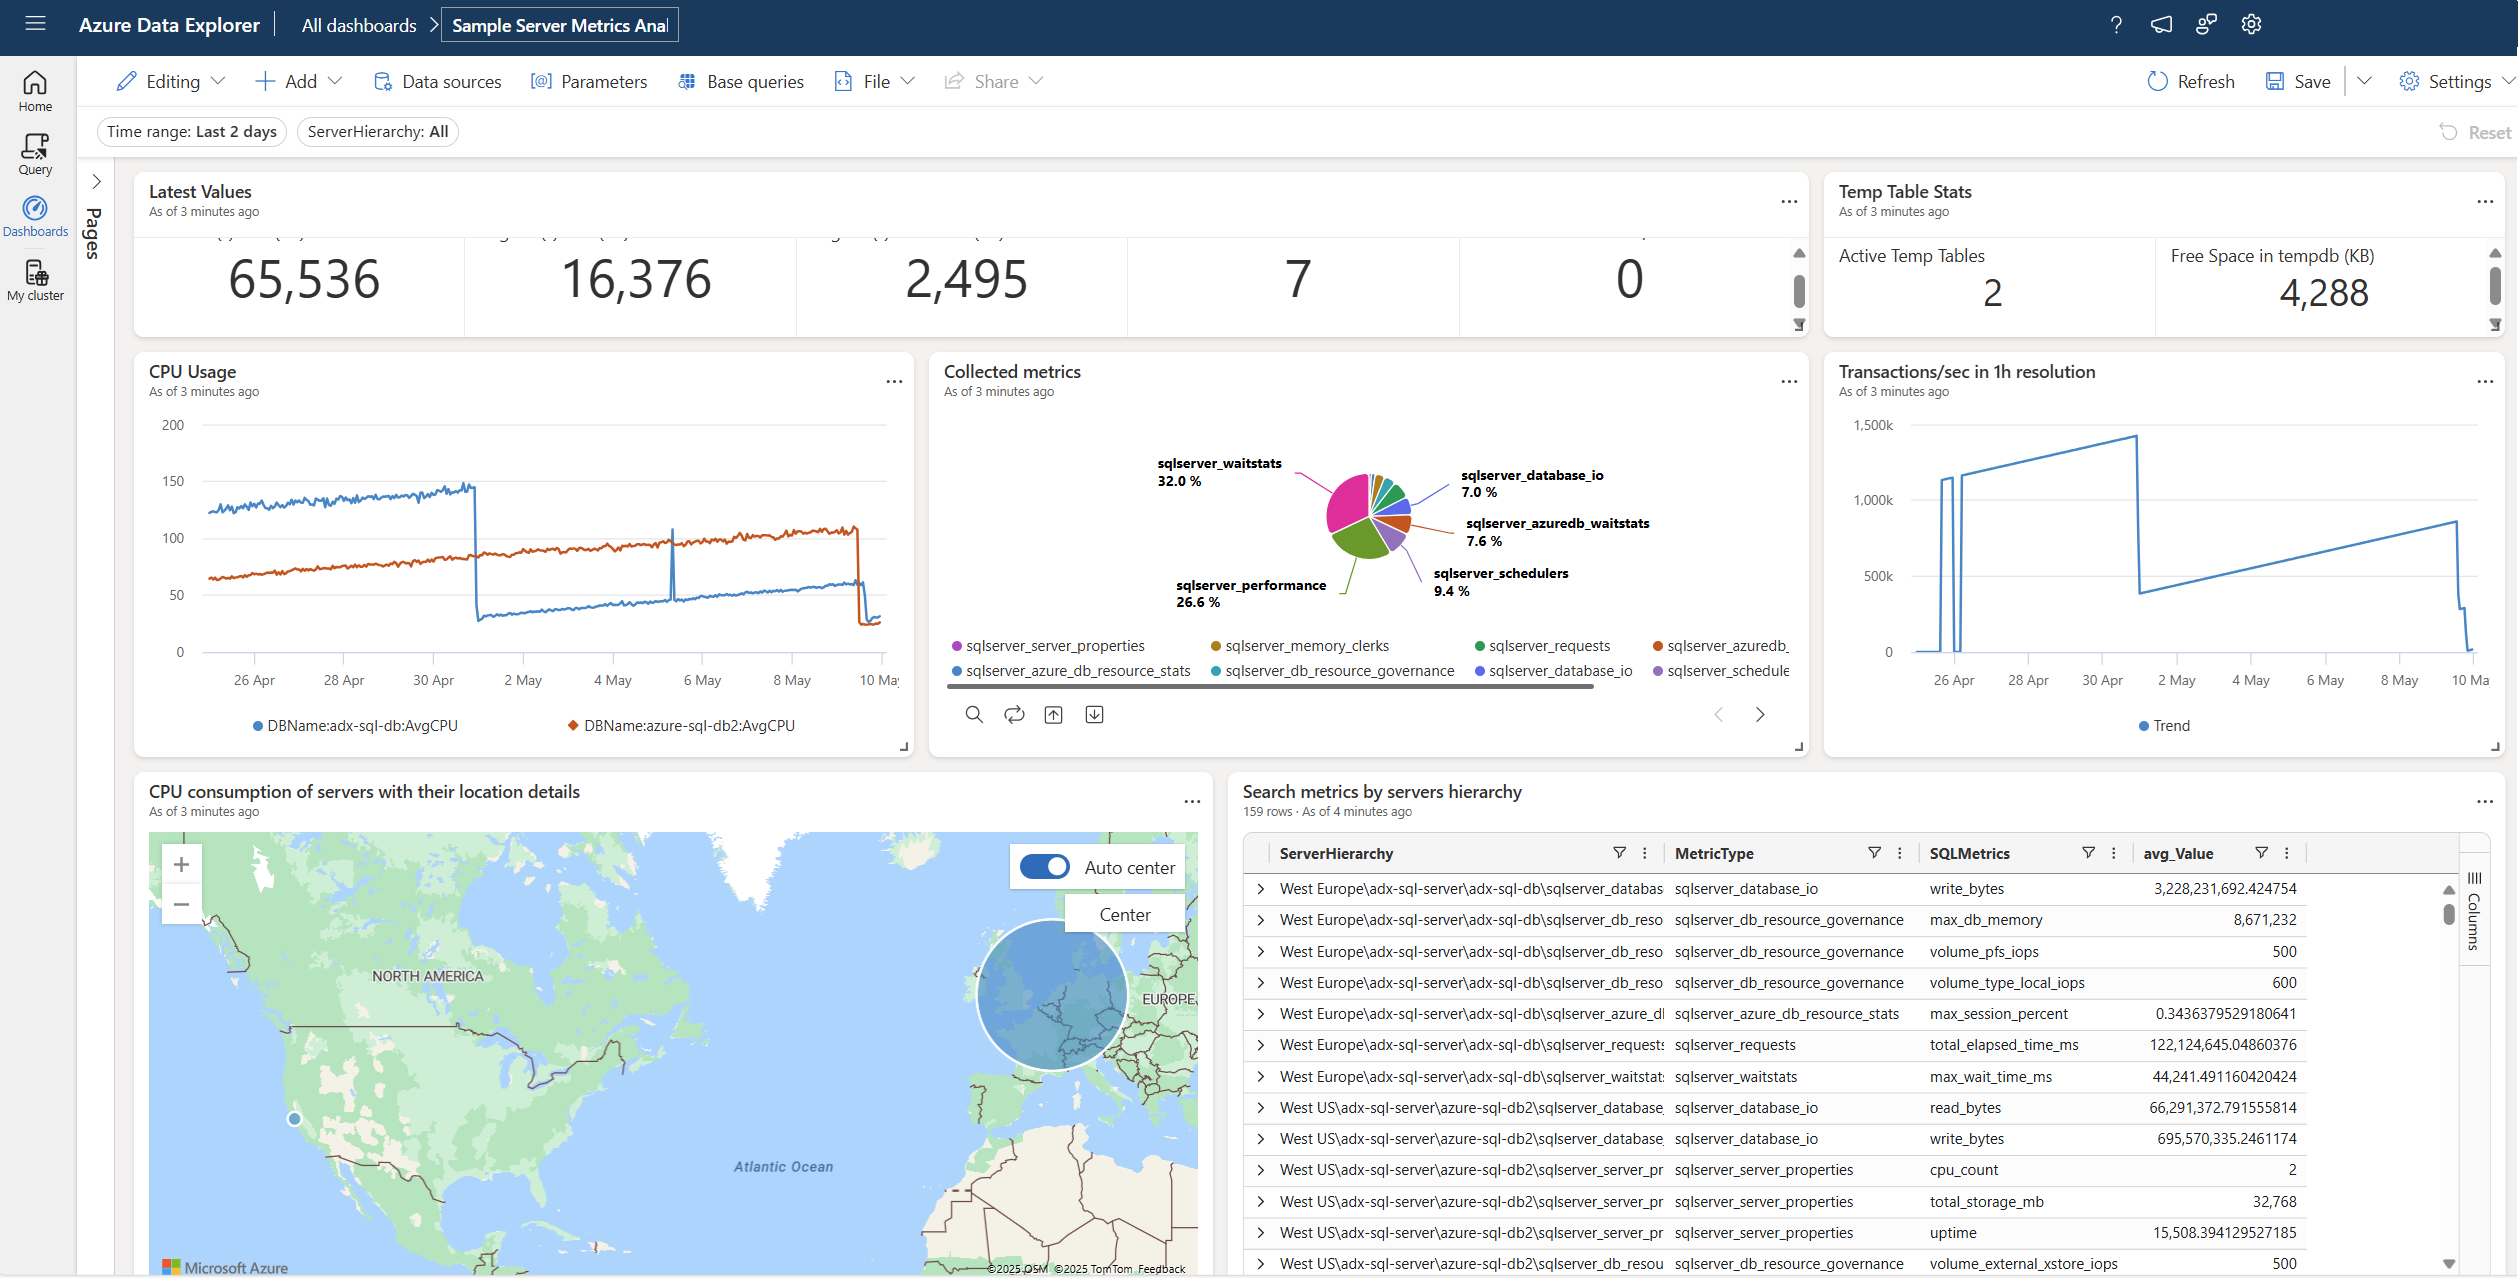
The dashboard opens in edit mode and presents various preconfigured tile options for customization.
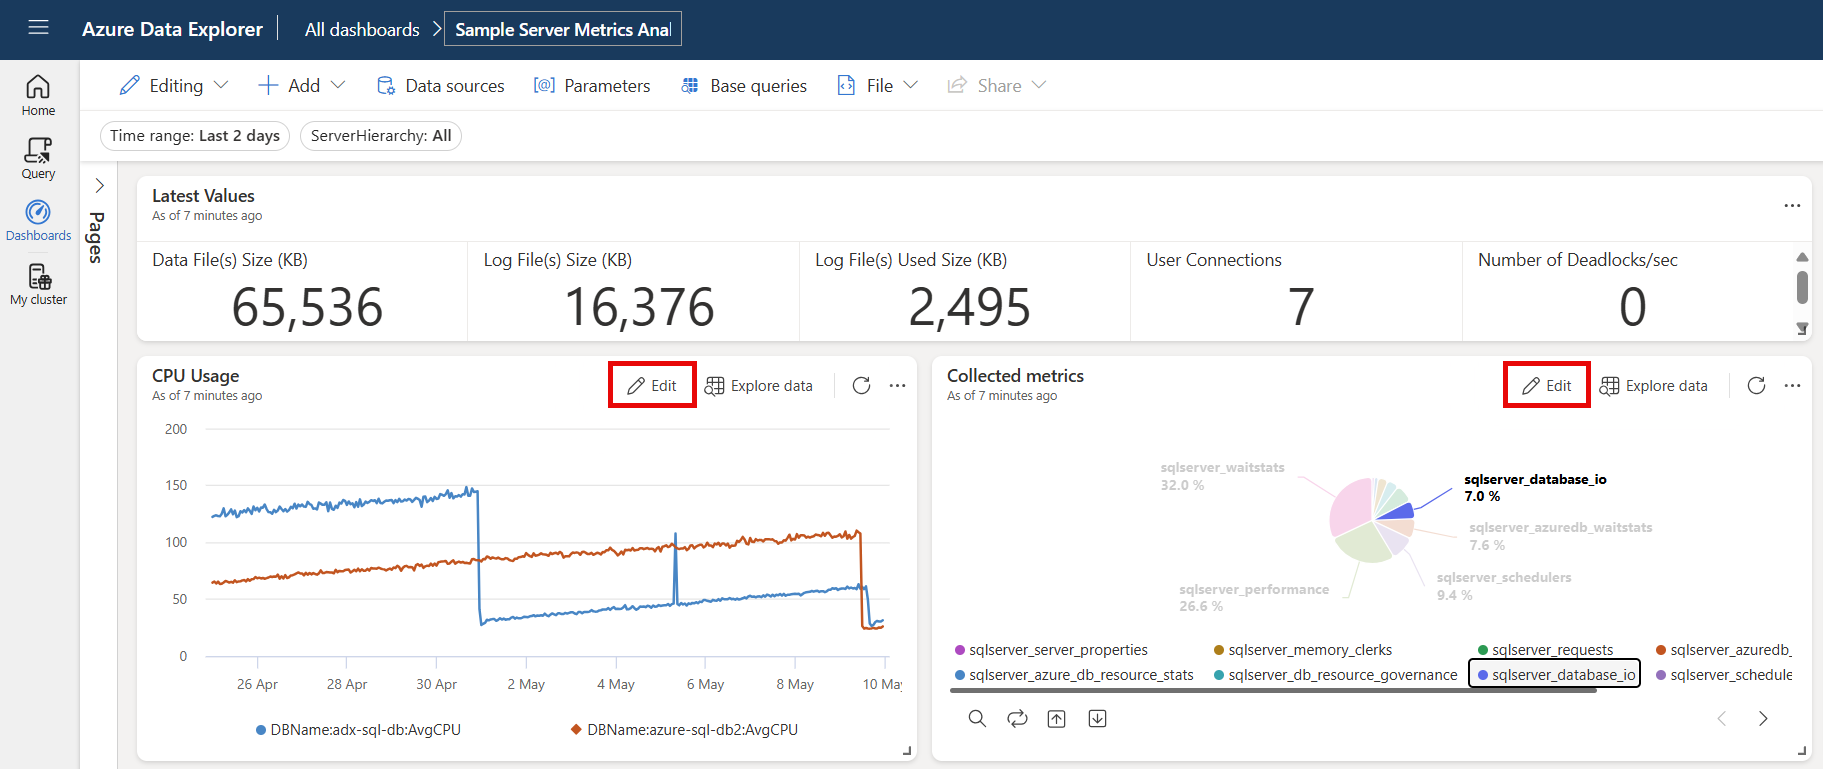
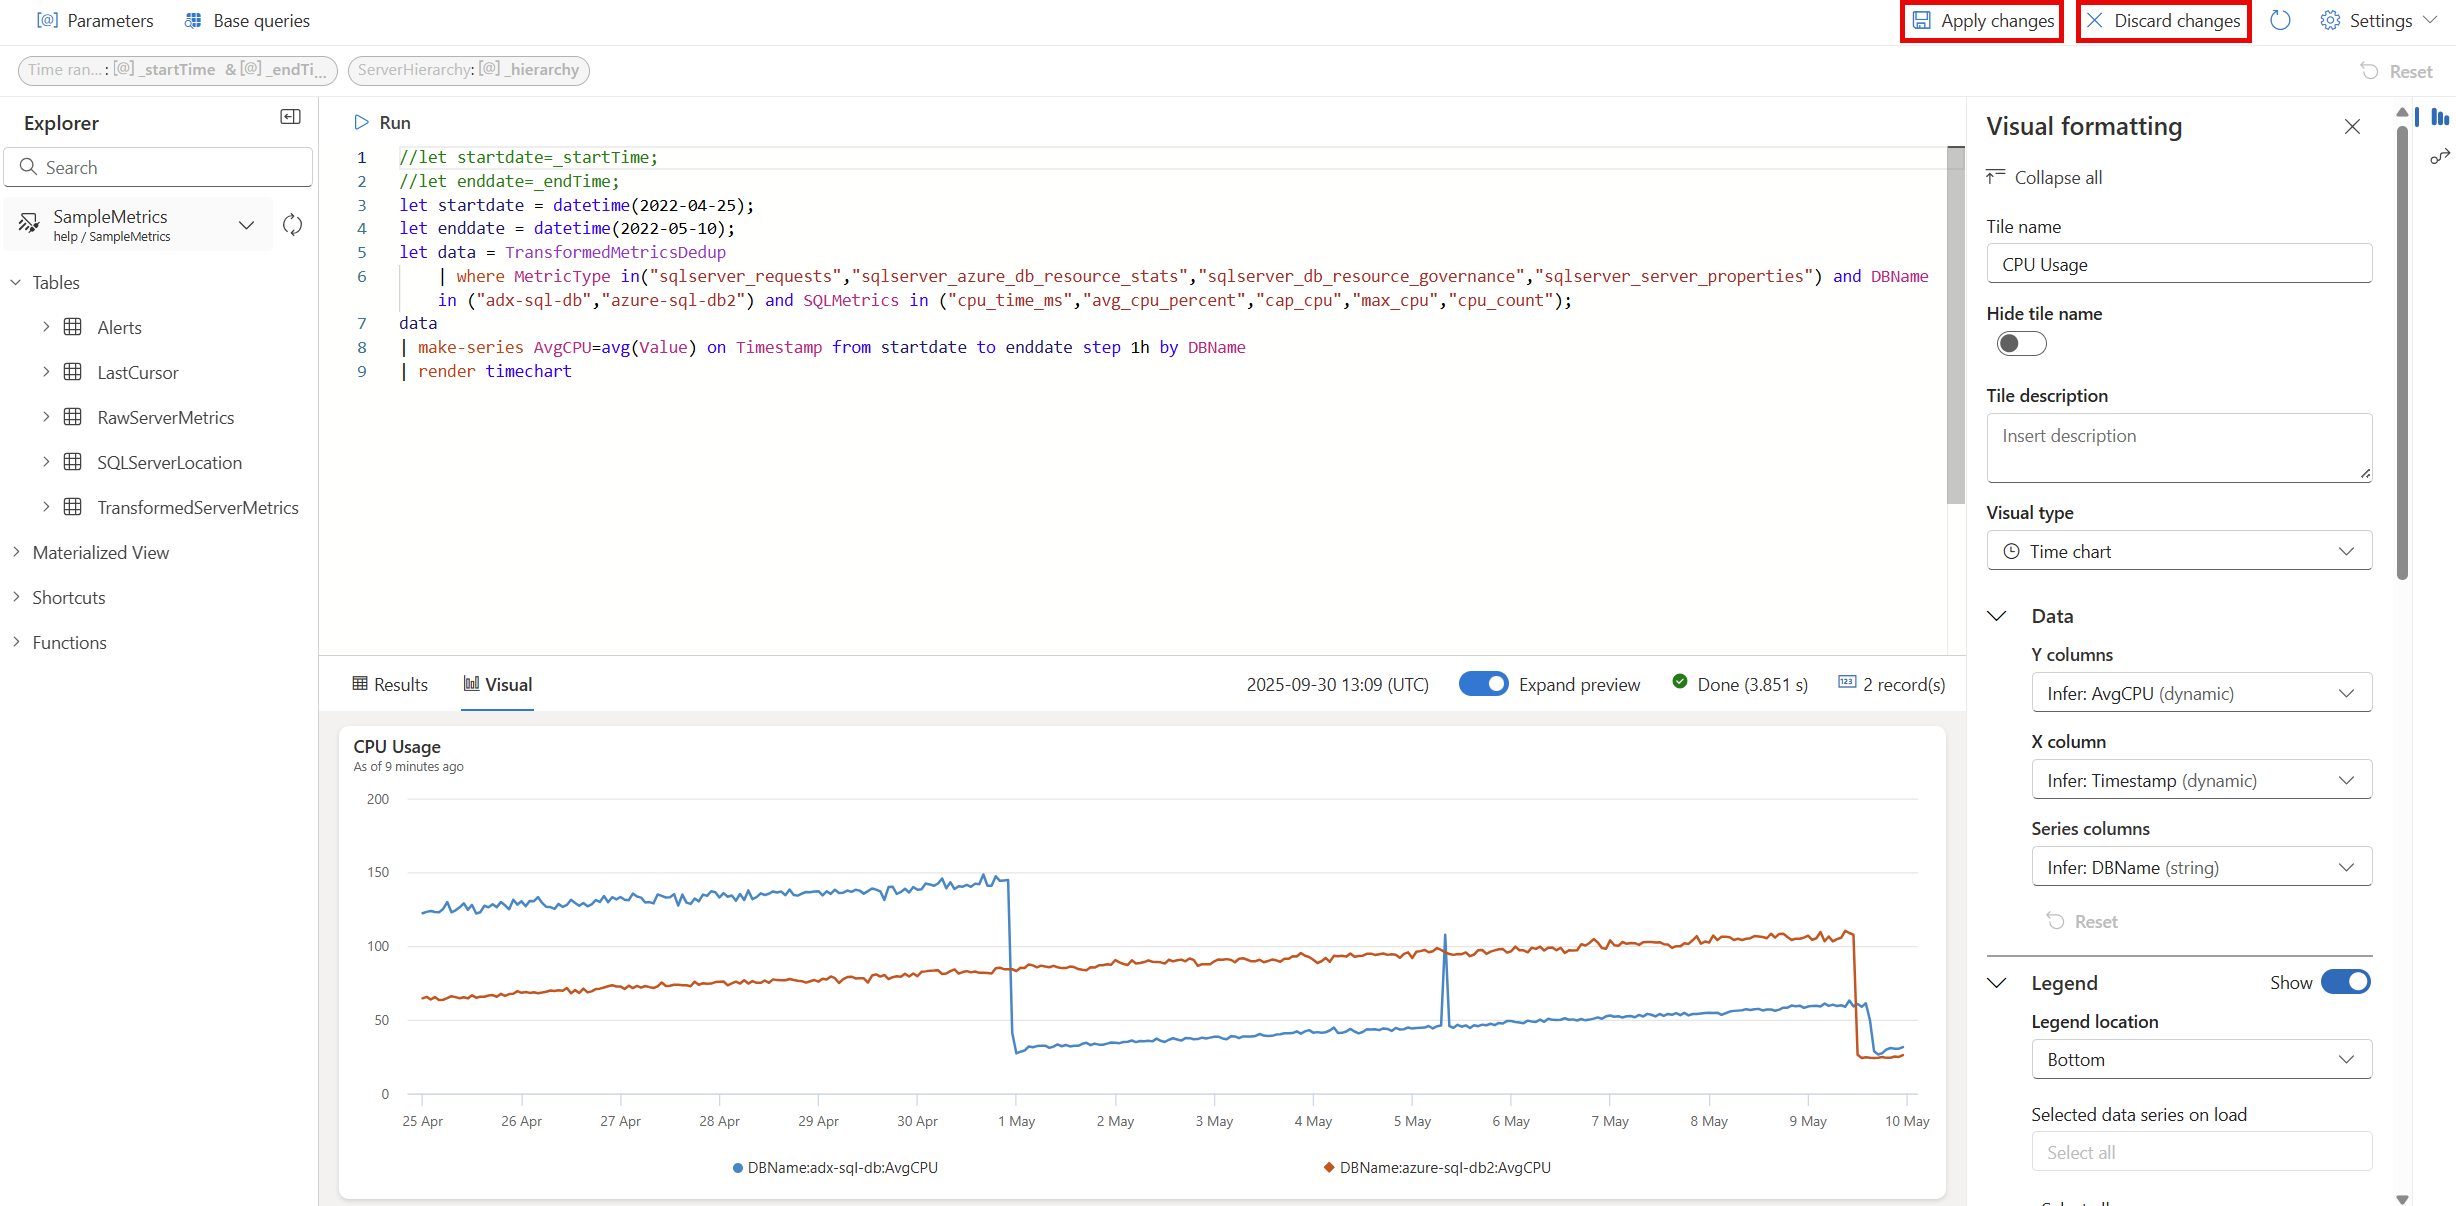
Select the edit icon on the CPU Usage tile to access the underlying KQL query and formatting options. Explore the various tabs that you can use to adjust the visual display and review the results. Take some time to familiarize yourself with the features and options available.
Select Apply changes or Discard changes to save or discard your changes. You're taken back to the main dashboard.
Learn how to view parameters and customize visuals.
