Sự kiện
21 giờ 17 thg 3 - 10 giờ 21 thg 3
Tham gia chuỗi buổi gặp gỡ để xây dựng các giải pháp AI có thể mở rộng dựa trên các trường hợp sử dụng trong thế giới thực với các nhà phát triển và chuyên gia đồng nghiệp.
Đăng ký ngayTrình duyệt này không còn được hỗ trợ nữa.
Hãy nâng cấp lên Microsoft Edge để tận dụng các tính năng mới nhất, bản cập nhật bảo mật và hỗ trợ kỹ thuật.
Azure DevOps Services | Azure DevOps Server 2022 - Azure DevOps Server 2019
Analytics supports several dashboard widgets that take advantage of the power of the service. Using these widgets, you and your team can gain valuable insights into the health and status of your work.
Analytics supports several dashboard widgets that take advantage of the power of the service. Once you enable or install Analytics on a project collection, you can add these widgets to your dashboard. To add extensions or enable the service, be an organization owner or a member of the Project Collection Administrators group. Using these widgets, you and your team can gain valuable insights into the health and status of your work.
You add an Analytics widget to a dashboard the same way you add any other type of widget. For details, see Add a widget to your dashboard.
The Analytics service is enabled for all Azure DevOps organizations.
| Category | Requirements |
|---|---|
| Permissions | - To view Analytics data: View analytics project-level permission set to Allow. By default, all project members in all security groups have this permission. |
| Access levels | At least Stakeholder access. |
| Category | Requirements |
|---|---|
| Permissions | - To view Analytics data: View analytics project-level permission set to Allow. By default, all project members in all security groups have this permission. |
| Access levels | At least Stakeholder access. |
| Services | Analytics service enabled. |
Lưu ý
If Boards is disabled, then Analytics views is also disabled. All widgets associated with work item tracking are also disabled in the widget catalog. To re-enable a service, see Turn on or off an Azure DevOps service.
The Burndown widget lets you display a trend of remaining work across multiple teams and multiple sprints. You can use it to create a release burndown, a bug burndown, or a burndown on any scope of work over time. It will help you answer questions like:
Burndown widget showing a release Burndown

For more information, see Configure a burndown or burnup widget.
The Burnup widget lets you display a trend of completed work across multiple teams and multiple sprints. You can use it to create a release burnup, a bug burnup, or a burnup on any scope of work over time. When completed work meets total scope, your project is done!
Burnup widget showing a release Burnup

For more information, see Configure a burndown or burnup widget.
The Analytics-based Sprint Burndown widget adds a team's burndown chart for a sprint to the dashboard. This widget supports several configuration options, including selecting a team, iteration, and time period. Teams use the burndown chart to mitigate risk and check for scope creep throughout the sprint cycle.
Sprint Burndown widget

For more information, see Configure and monitor sprint burndown.
The CFD widget shows the count of work items (over time) for each column of a board. It allows you to see patterns in your team's development cycle over time. It will help you answer questions like:
Cumulative flow diagram widget showing 30 days of data

For more information, see Cumulative flow diagram widget.
The Cycle Time widget will help you analyze the time it takes for your team to complete work items once they begin actively working on them. A lower cycle time is typically indicative of a healthier team process. Using the Cycle Time widget you can answer questions like:
Cycle Time widget showing 30 days of data
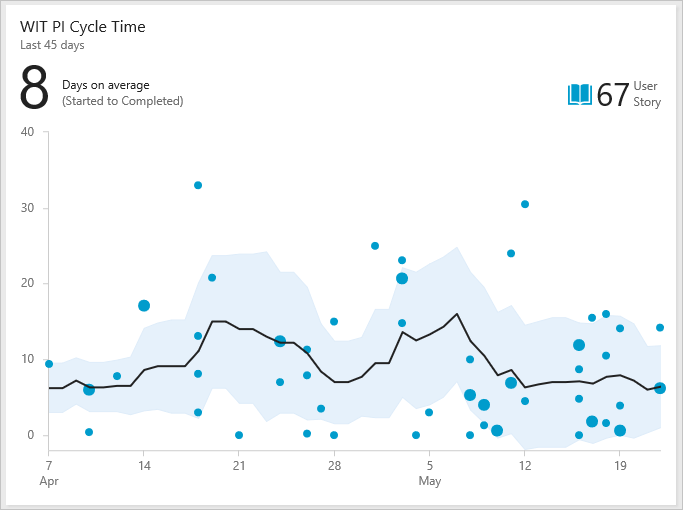
For more information, see Cycle Time and lead time control charts.
The Lead Time widget will help you analyze the time it takes to deliver work from your backlog. Lead Time measures the total time elapsed from the creation of work items to their completion. Using the Lead Time widget, you can answer questions like:
Lead Time widget showing 60 days of data
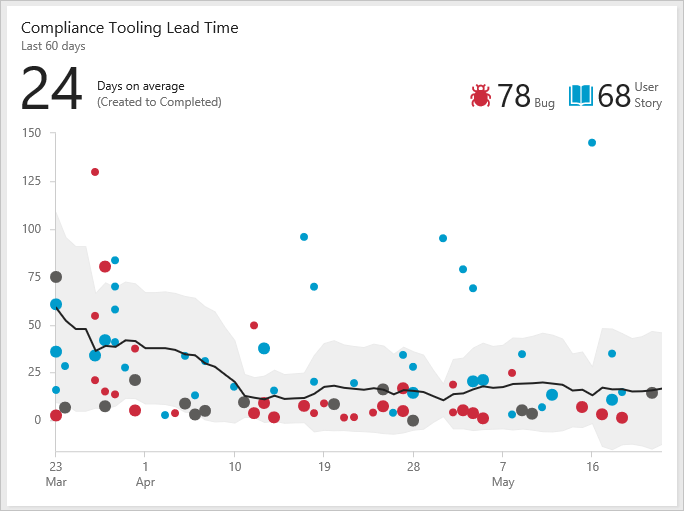
For more information, see Cycle Time and lead time control charts.
The Velocity widget will help you learn how much work your team can complete during a sprint. The widget shows the team's velocity by Story Points, work item count, or any custom field. It allows you to compare the work delivered against your plan and track work that's completed late. Using the Velocity widget, you can answer questions like:
Velocity widget showing 8 sprints of data based on Story Points

For more information, see Configure and view Velocity widgets.
With the Test Results Trend (Advanced) widget, you can track the test quality of your pipelines over time. Tracking test quality and improving test collateral are essential tasks to maintaining a healthy DevOps pipeline.
The widget shows a trend of your test results for either build or release pipelines. You can track the daily count of tests, pass rates, and test duration. The highly configurable widget allows you to use it for a wide variety of scenarios.
You can find outliers in your test results and answer questions like:
Test trend widget showing passed test results and pass rate for the last 7 days grouped by Priority
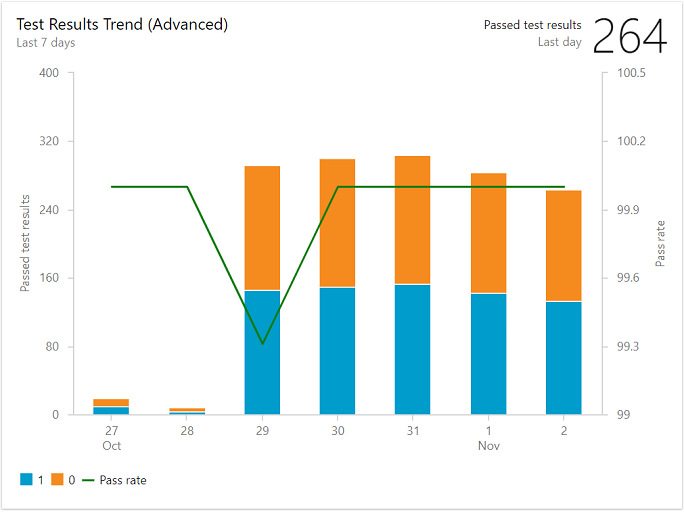
For more information, see Configure a test results widget.
Sự kiện
21 giờ 17 thg 3 - 10 giờ 21 thg 3
Tham gia chuỗi buổi gặp gỡ để xây dựng các giải pháp AI có thể mở rộng dựa trên các trường hợp sử dụng trong thế giới thực với các nhà phát triển và chuyên gia đồng nghiệp.
Đăng ký ngayĐào tạo
Lộ trình học tập
Use advance techniques in canvas apps to perform custom updates and optimization - Training
Use advance techniques in canvas apps to perform custom updates and optimization
Chứng chỉ
Được Microsoft Chứng nhận: Liên kết Phân tích Dữ liệu Power BI - Certifications
Thể hiện các phương pháp và thực tiễn tốt nhất phù hợp với yêu cầu kỹ thuật và kinh doanh để lập mô hình, trực quan hóa và phân tích dữ liệu với Microsoft Power BI.
Tài liệu
Add a widget to a team dashboard - Azure DevOps
Learn how to select and configure widgets that you add to a team dashboard in Azure DevOps.
Understand dashboards, charts, reports, and widgets - Azure DevOps
Learn about charts, widgets, dashboards, and reports available to monitor status and trends in Azure DevOps.
Catalog of Out Of Box widgets you can add to a dashboard - Azure DevOps
Learn about the widgets that you might want to add to your dashboards when you work in Azure DevOps.