What's New in DevTools (Microsoft Edge 97)
To check out the latest features of Microsoft Edge DevTools and the Microsoft Edge DevTools extension for Microsoft Visual Studio Code and Visual Studio, read these announcements.
To stay up to date and get the latest DevTools features, download an Insiders preview version of Microsoft Edge. Whether you're on Windows, Linux, or macOS, consider using Canary (or another preview channel) as your default development browser. The Beta, Dev, and Canary versions of Microsoft Edge run as separate apps, side-by-side with the stable, released version of Microsoft Edge. See Microsoft Edge Insider Channels.
For the latest announcements, follow the Microsoft Edge team on Twitter. To report a problem with DevTools or ask for a new feature, file an issue in the MicrosoftEdge/DevTools repo.
Video: Microsoft Edge | What's New in DevTools 97
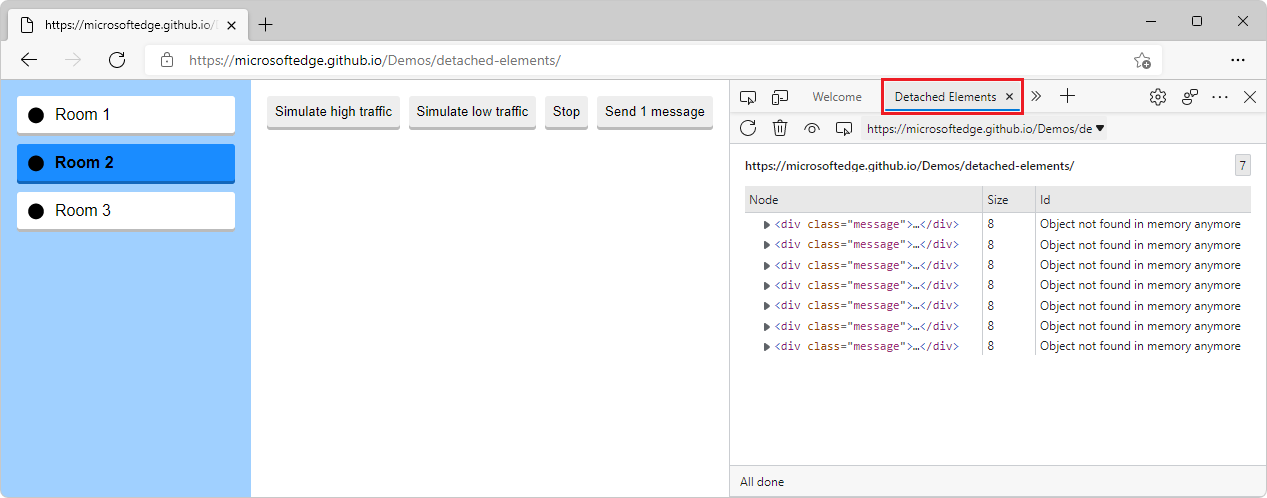
Introducing the Detached Elements tool
A DOM node is considered detached when it's no longer attached to any element of the DOM, but is still being retained in memory by Microsoft Edge. The browser cannot garbage-collect the detached element, because some JavaScript object is still referencing the element, even though the element is no longer on the page or is no longer a part of the DOM.
The new Detached Elements tool finds all of the detached elements on your page and displays them. You can expand and collapse a detached element to see the parent and child nodes that are also being retained. You can trigger the browser's garbage collection by clicking the Collect garbage icon, and then confirm that you have a memory leak when a detached element cannot be garbage-collected. To jump into the JavaScript code that's referencing the detached element, click the Analyze button to take a heap snapshot.
The Detached Elements tool was initially available as an experiment in Microsoft Edge version 93. The tool is now available by default in Microsoft Edge version 97.
See also:
- Debug DOM memory leaks with the Detached Elements tool
- Debug memory leaks with the Microsoft Edge Detached Elements tool - YouTube
Microsoft Edge DevTools extension for Visual Studio Code
For general information about this extension, see Microsoft Edge DevTools extension for Visual Studio Code.
Screencast enhancements, deprecation warnings, and new launch options for Microsoft Edge
The current version of the Microsoft Edge DevTools extension for Visual Studio Code fixes several issues that were reported by the community:
The list of emulated devices in the screencast is now the same as the list of emulated devices in the browser.
Device emulation now adds the correct user agent string, to trigger the correct display.
You now get a warning when you use a deprecated launch version of Microsoft Edge, indicating that you'd miss out on features.
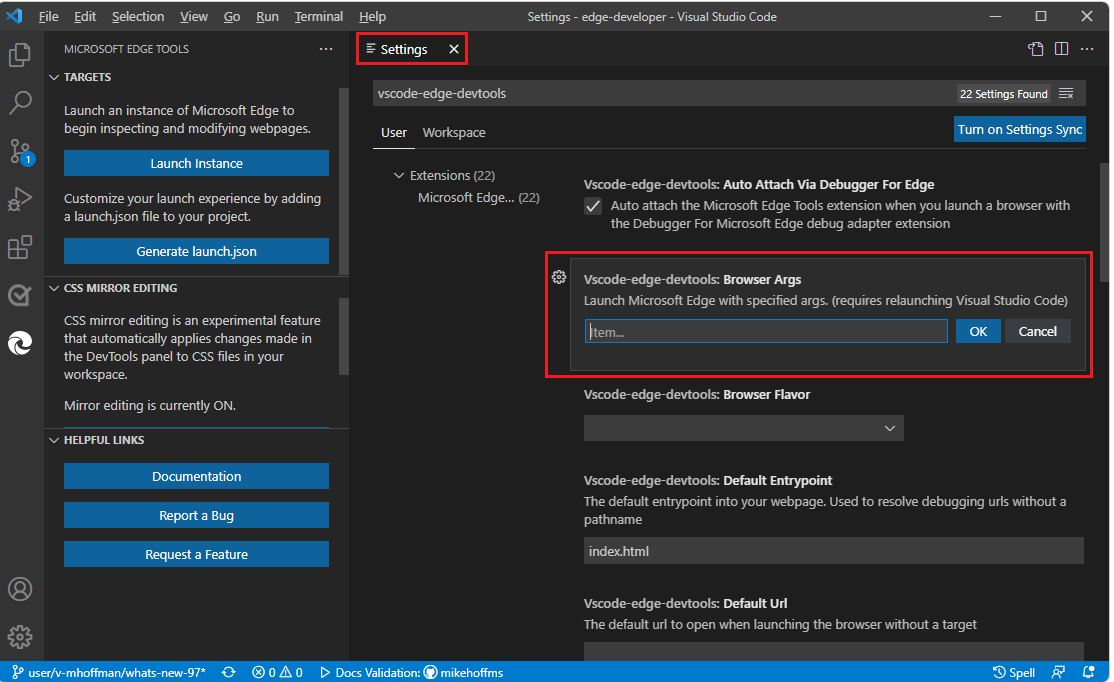
You can now provide arguments for the launched browser instance, in case you need to have a special setup:
Improvements and bug fixes for Focus Mode
Thanks to your early feedback, we've continued to make improvements and bug fixes on the new Focus Mode interface for Microsoft Edge DevTools. Focus Mode is a new UI option that allows you to dock tools at the top or side of the DevTools window, and removes clutter from the toolbar:
When using Focus Mode, all the same tools and custom themes are available as in the existing DevTools UI. Try Focus Mode for yourself by enabling the Focus Mode experiment in DevTools Settings > Experiments.
See also:
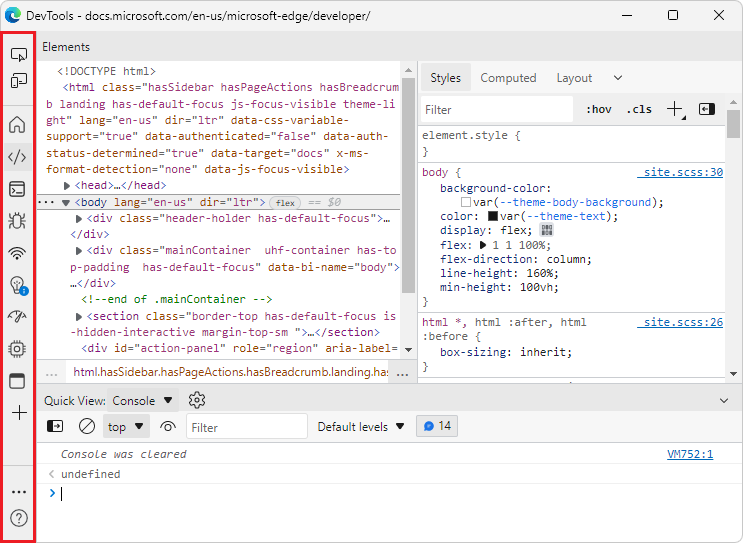
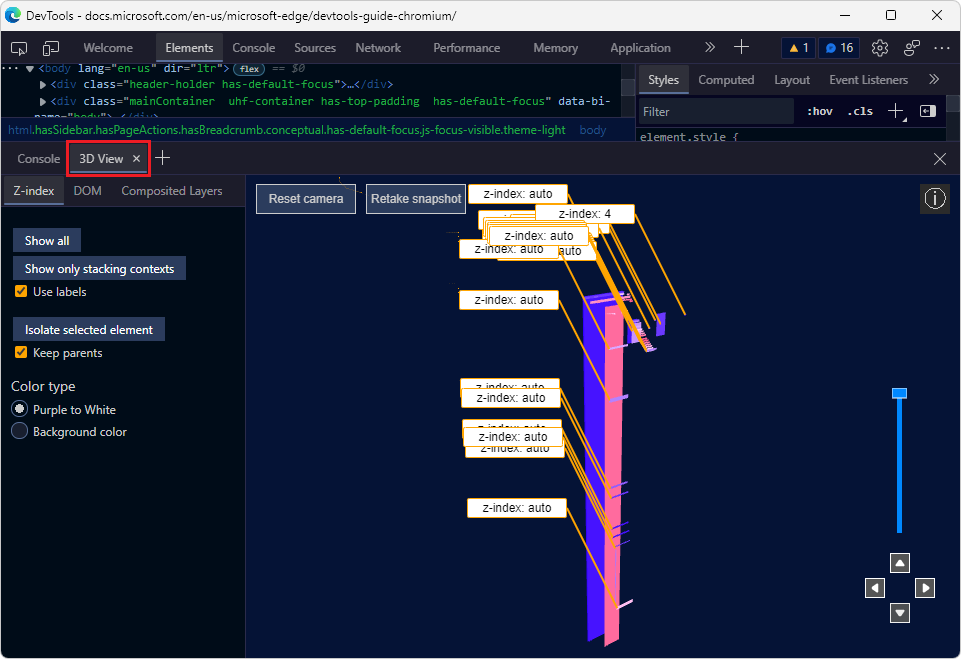
3D View tool supports changing color themes in DevTools
In previous versions of Microsoft Edge, changing the theme in DevTools and then opening the 3D View tool resulted in a blank panel. This issue has now been fixed, in Microsoft Edge 97:
See also:
Announcements from the Chromium project
Microsoft Edge version 97 also includes the following updates from the Chromium project: