What's New in DevTools (Microsoft Edge 113)
To check out the latest features of Microsoft Edge DevTools and the Microsoft Edge DevTools extension for Microsoft Visual Studio Code and Visual Studio, read these announcements.
To stay up to date and get the latest DevTools features, download an Insiders preview version of Microsoft Edge. Whether you're on Windows, Linux, or macOS, consider using Canary (or another preview channel) as your default development browser. The Beta, Dev, and Canary versions of Microsoft Edge run as separate apps, side-by-side with the stable, released version of Microsoft Edge. See Microsoft Edge Insider Channels.
For the latest announcements, follow the Microsoft Edge team on Twitter. To report a problem with DevTools or ask for a new feature, file an issue in the MicrosoftEdge/DevTools repo.
Tip
The Microsoft Build 2023 conference was on May 23-25, 2023. Learn more about new features for memory, performance, and production debugging in DevTools, as well as new capabilities for PWAs in the sidebar, WebView2, and Chat Plugins, in the following videos:
Video: What's New in DevTools 113 and 114
Debug JavaScript error stack traces by using the Crash Analyzer tool
The new Crash analyzer tool is available as an experiment in Microsoft Edge 113. In the Crash analyzer tool, you can input a JavaScript stack trace, such as for non-fatal JavaScript exceptions, and then have your sourcemaps applied to the stack trace so that you can debug faster.
To access the Crash analyzer tool, select the Enable Crash Analyzer experiment in Settings > Experiments. See Turning an experiment on or off.
You can report non-fatal JavaScript exceptions or similar data to tools such as Azure Application Insights:
First, in order to use the Crash analyzer tool, you need specially-formatted stack traces that include a section called
Source modules. This section contains the sourcemap references to the JavaScript functions that were part of the error stack trace. You can produce these stack traces by using the Crash Analyzer Support npm package.Then you need a way to actually receive the stack traces from the browsers that are running your code. One such way is to use Azure Application Insights; see Application Insights overview.
Once you have a stack trace, paste it into the left pane of the Crash analyzer tool.
In the Crash analyzer tool, click the Analyze button (or press Ctrl+Enter). The right-hand pane shows the original file and function names that make up the stack trace:
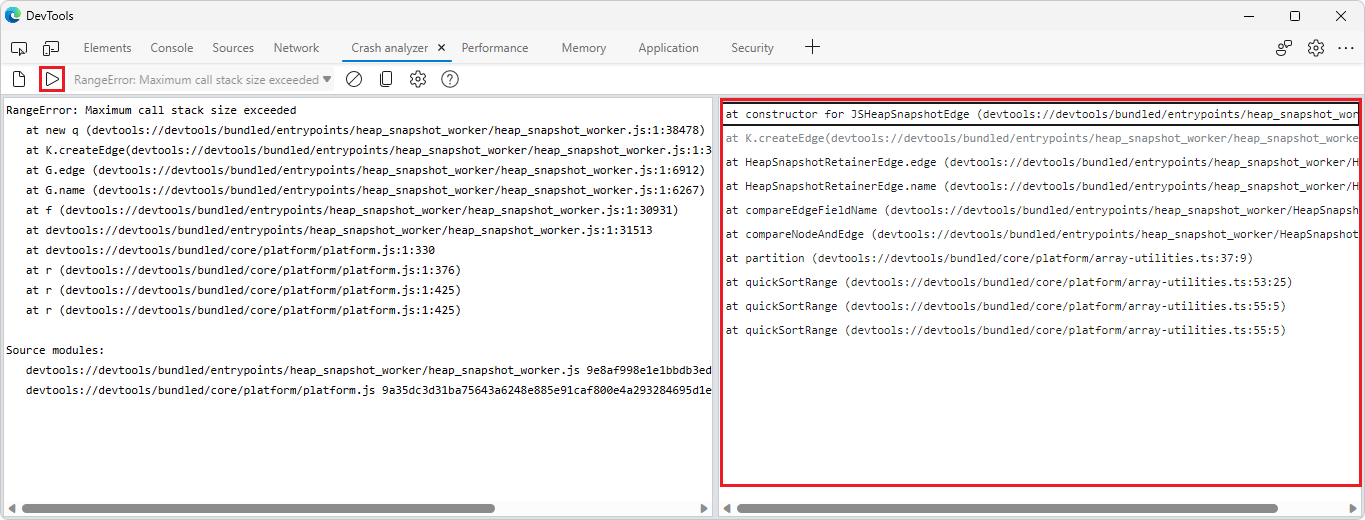
Click through the individual stack frames to see the lines in your original code that caused the error.
For more information, see Crash analyzer tool.
See also:
The Memory tool can unminify object names in heap snapshots
In Microsoft Edge 113, the Memory tool now automatically provides the original object names when taking a heap snapshot, as long as source maps are loaded. Source maps can be loaded reliably and securely by hosting them on Azure Artifacts Symbol Server.
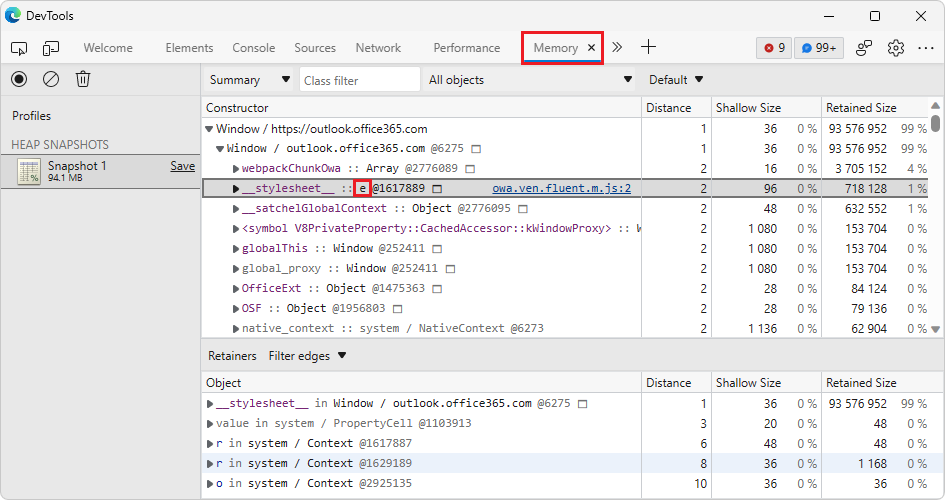
In the following image, the minified object name e is shown in a heap snapshot in the Memory tool:
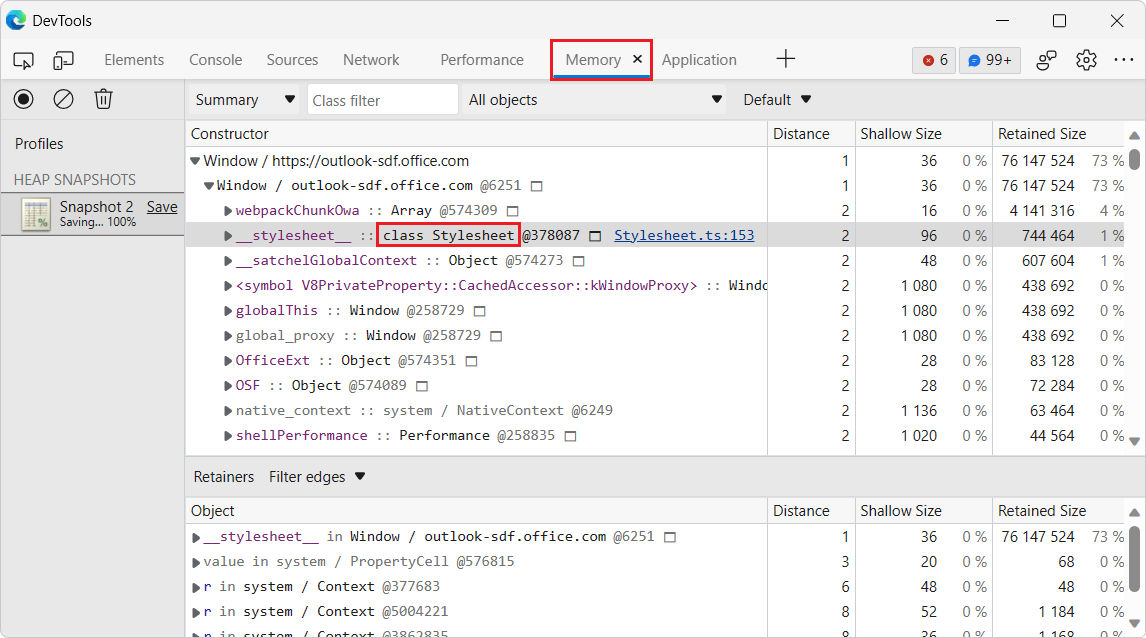
Now in Microsoft Edge 113, the Memory tool automatically unminifies object names in the heap snapshot:
See also:
- Securely debug original code by publishing source maps to the Azure Artifacts symbol server
- Securely debug original code by using Azure Artifacts symbol server source maps
- Take a snapshot in Record heap snapshots using the Memory tool.
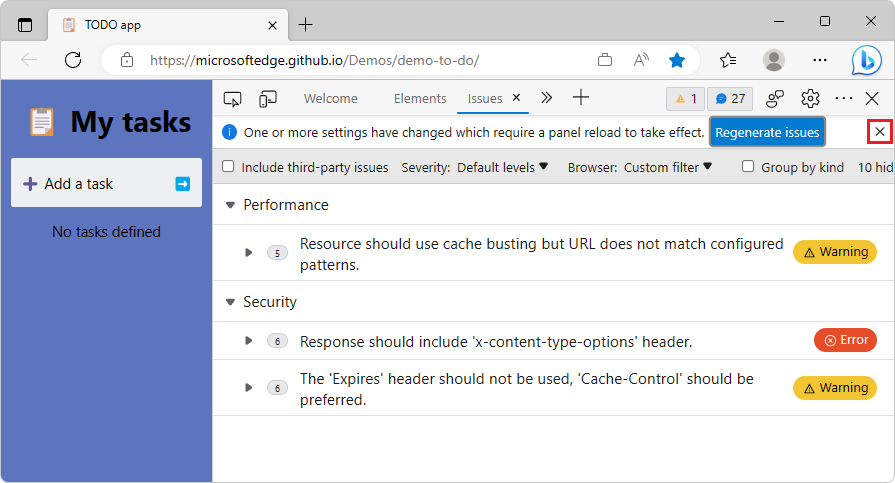
The Issues tool has better support for keyboard navigation
In the Issues tool, changing the Severity or Browser filters displays an info bar at the top of the Issues tool, containing a Regenerate issues button. In previous versions of Microsoft Edge, navigating this info bar with the keyboard caused the Close button to disappear. In Microsoft Edge 113, this issue has been fixed:
See also:
- Filter issues in Find and fix problems using the Issues tool
- Navigate DevTools with assistive technology
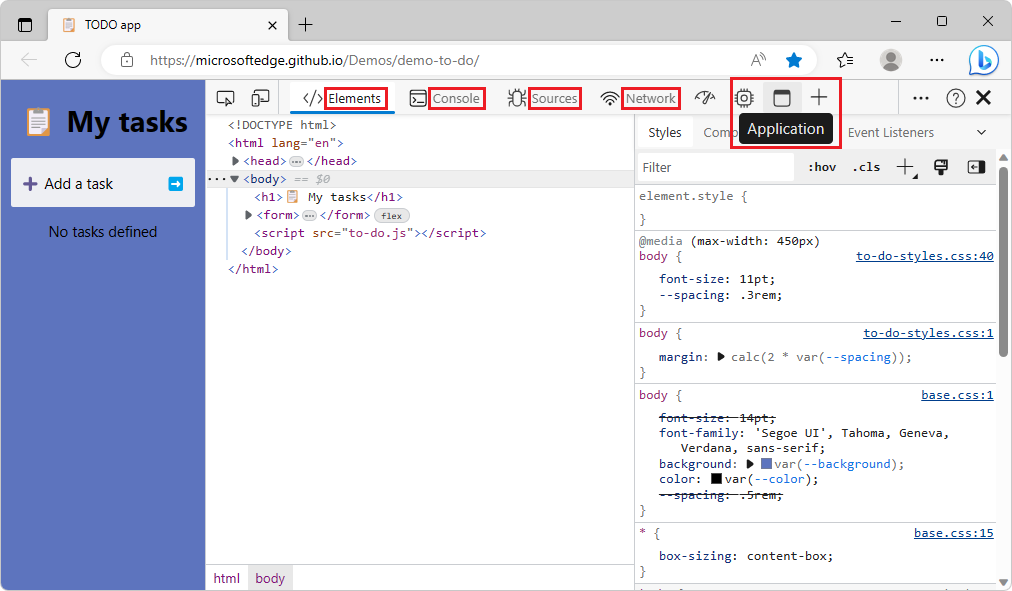
In Focus Mode, hovering over a tool no longer makes the name of each tool disappear in the Activity Bar
In previous versions of Microsoft Edge, in Focus Mode, hovering over a tool's icon in the Activity Bar in horizontal mode caused the names of the other tools in the Activity Bar to disappear. In Microsoft Edge 113, this issue has been fixed. When you hover over a tool icon to see the name of the tool in a tooltip, the names of the other tools remain displayed in the Activity Bar:
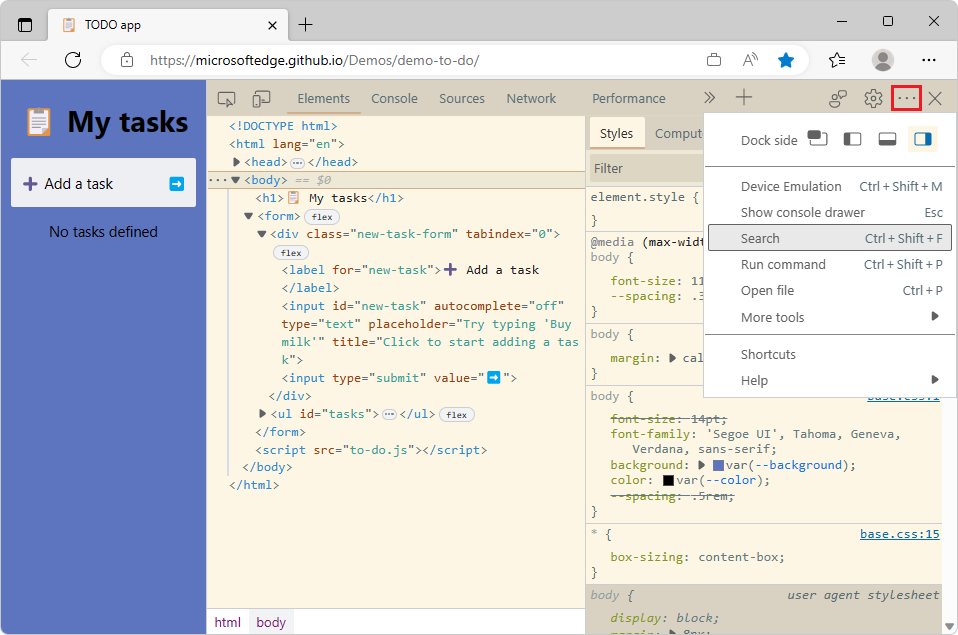
The Customize DevTools menu has better support for VS Code themes
In previous versions of Microsoft Edge, applying themes from Microsoft Visual Studio Code such as Solarized Light or Kimbie Dark caused low-contrast issues when hovering over items in the Customize and control DevTools menu. In Microsoft Edge 113, this issue has been fixed. Items in the Customize and control DevTools menu are now displayed with sufficient color contrast:
See also:
- Apply a color theme to DevTools
- Test text-color contrast using the Color Picker
- Check text-color contrast in the default state using the Inspect tool
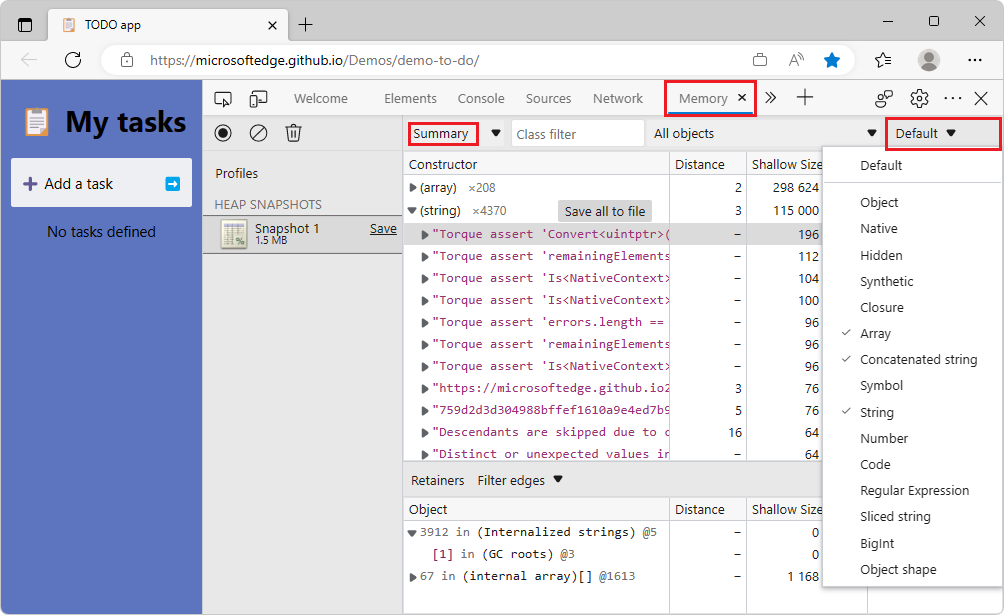
The Node Types filter in the Memory tool now only displays in the Summary view of a heap snapshot
In Microsoft Edge 100, we added a Node Types filter to the Memory tool so you can focus only on specific types of objects, such as Array or String, when looking at a heap snapshot. This Node Types filter only applies to objects that are displayed in the Summary view of a heap snapshot.
The Node Types filter was also displayed when the Containment or Statistics views of the heap snapshot were selected, even though the filter doesn't apply to those views. This issue has been fixed. In Microsoft Edge 113, the Node Types filter is only displayed when the Summary view is selected:
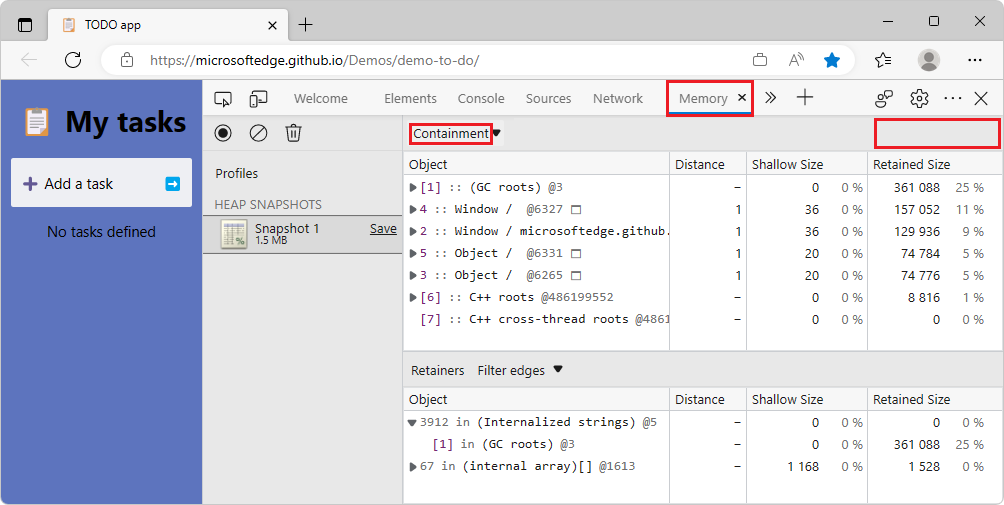
In the Containment and Statistics views, the Node Types filter is no longer displayed, since it doesn't apply:
See also:
- Filter heap snapshots summary by node type in What's New in DevTools (Microsoft Edge 100)
- Take a snapshot in Record heap snapshots using the Memory tool.
Announcements from the Chromium project
Microsoft Edge 113 also includes the following updates from the Chromium project:
Phản hồi
Sắp ra mắt: Trong năm 2024, chúng tôi sẽ dần gỡ bỏ Sự cố với GitHub dưới dạng cơ chế phản hồi cho nội dung và thay thế bằng hệ thống phản hồi mới. Để biết thêm thông tin, hãy xem: https://aka.ms/ContentUserFeedback.
Gửi và xem ý kiến phản hồi dành cho