Sự kiện
Giải vô địch thế giới Power BI DataViz
16 giờ 14 thg 2 - 16 giờ 31 thg 3
Với 4 cơ hội tham gia, bạn có thể giành được gói hội nghị và lọt vào Chung kết TRỰC TIẾP ở Las Vegas
Tìm hiểu thêmTrình duyệt này không còn được hỗ trợ nữa.
Hãy nâng cấp lên Microsoft Edge để tận dụng các tính năng mới nhất, bản cập nhật bảo mật và hỗ trợ kỹ thuật.
APPLIES TO: ![]() Power BI service for business users
Power BI service for business users ![]() Power BI service for designers & developers
Power BI service for designers & developers ![]() Power BI Desktop
Power BI Desktop ![]() Requires Pro or Premium license
Requires Pro or Premium license
A Power BI report is one or more pages of organized visuals. All Power BI users can create and edit their own reports. However, opening reports created by others requires a paid license (Power BI Pro or Premium Per User) or special access to a Premium capacity.
This article teaches you how to open reports that are shared with you. The most common scenarios are covered. The first scenario is when a Power BI designer creates a report and shares it directly. The second scenario is when a designer shares a report as part of an app.
For more information about sharing reports, see Licenses and subscriptions for business users.
Power BI designers share reports with you by sending an email link or by adding the report to your Power BI content. These reports are located under Shared in the Browse tab.
Open the Power BI service (app.powerbi.com), and sign in if you're prompted.
On the navigation pane, select Browse, and on the Browse page, select Shared.

The report icon  is displayed next to the report name. Select a report to open it.
Notice the tabs along the left side. Each tab represents a report page or a dashboard. Selecting the YTD Category tab opens the YTD Category Trend Analysis page.
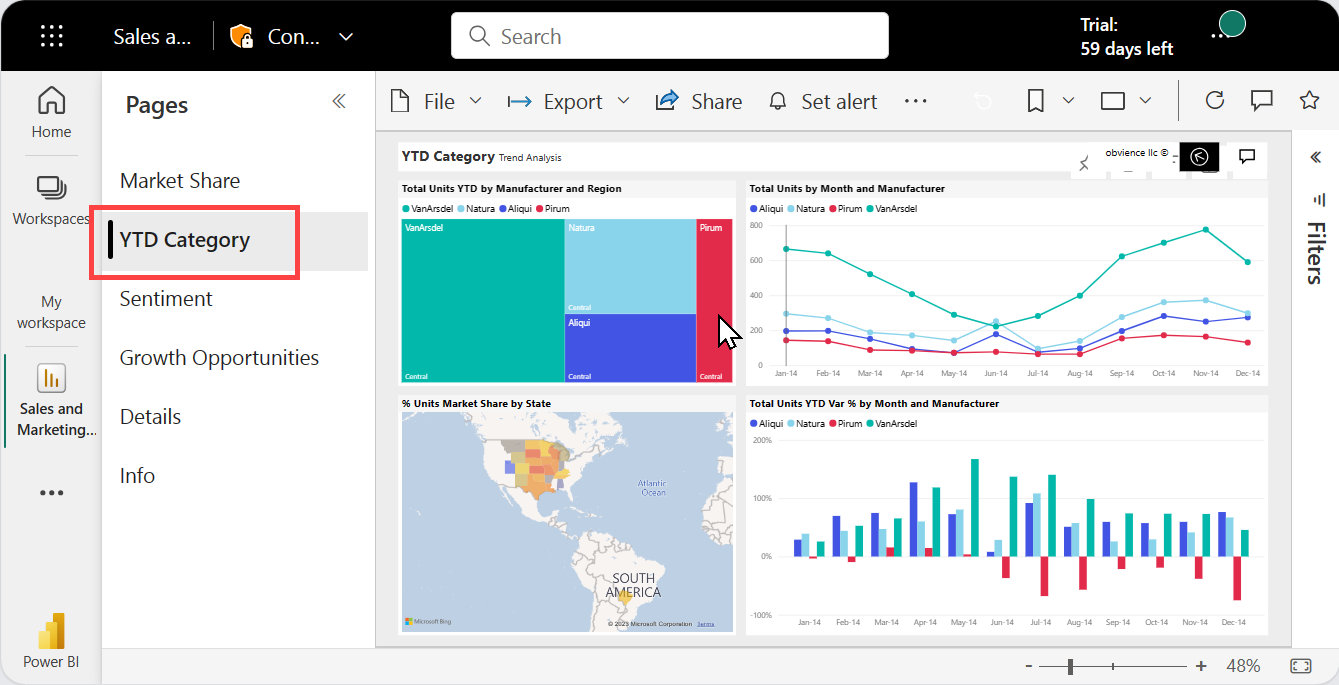
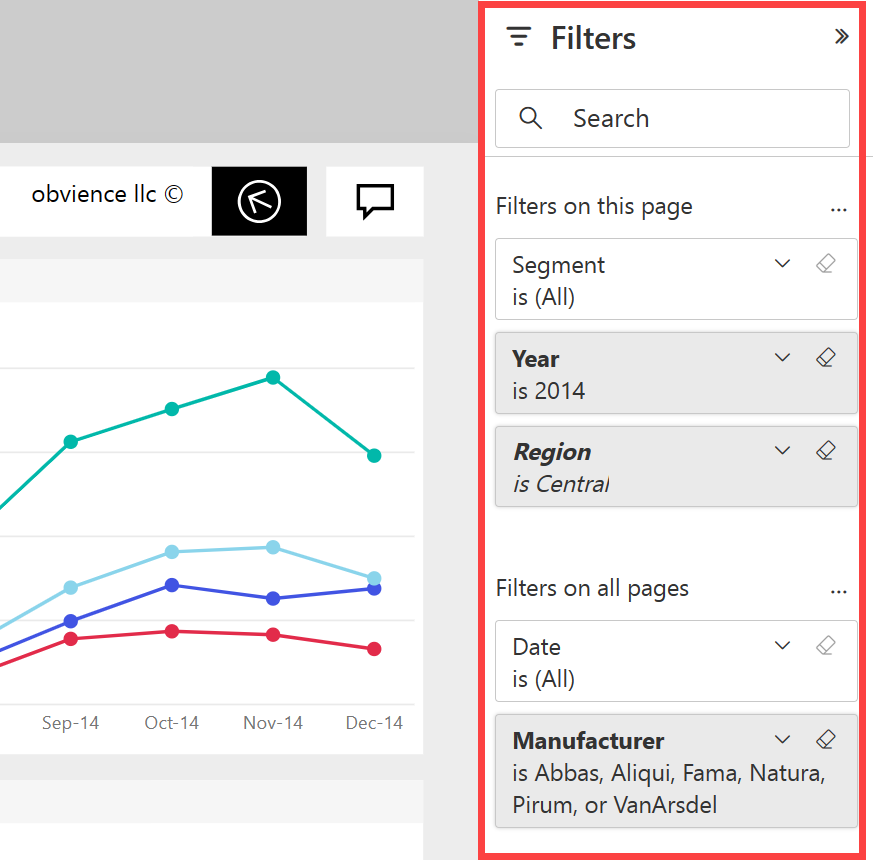
Expand the Filters pane along the right side. Filters that are applied to this report page, or to the entire report, are displayed here. If you have permissions, change these filters to see the impact on your report and visuals.
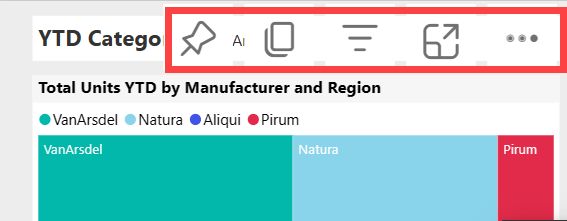
Hover over a visual to show the actions you can perform. For this treemap, we see pin, copy, filter, display the visual at full size, and an ellipsis (...).
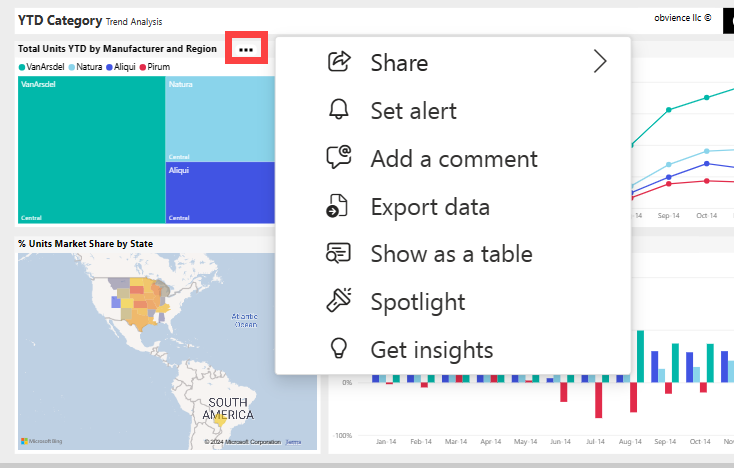
Select the ellipsis (...) to see more options.
Explore the action bar at the top of your report. From the File menu, you can make copies and print. If you have permissions, Export your report to PowerPoint or Share your report with colleagues. Select Get insights and Power BI searches for and displays interesting information from the report data. All of the features available from the action bar are explained in separate Power BI articles.
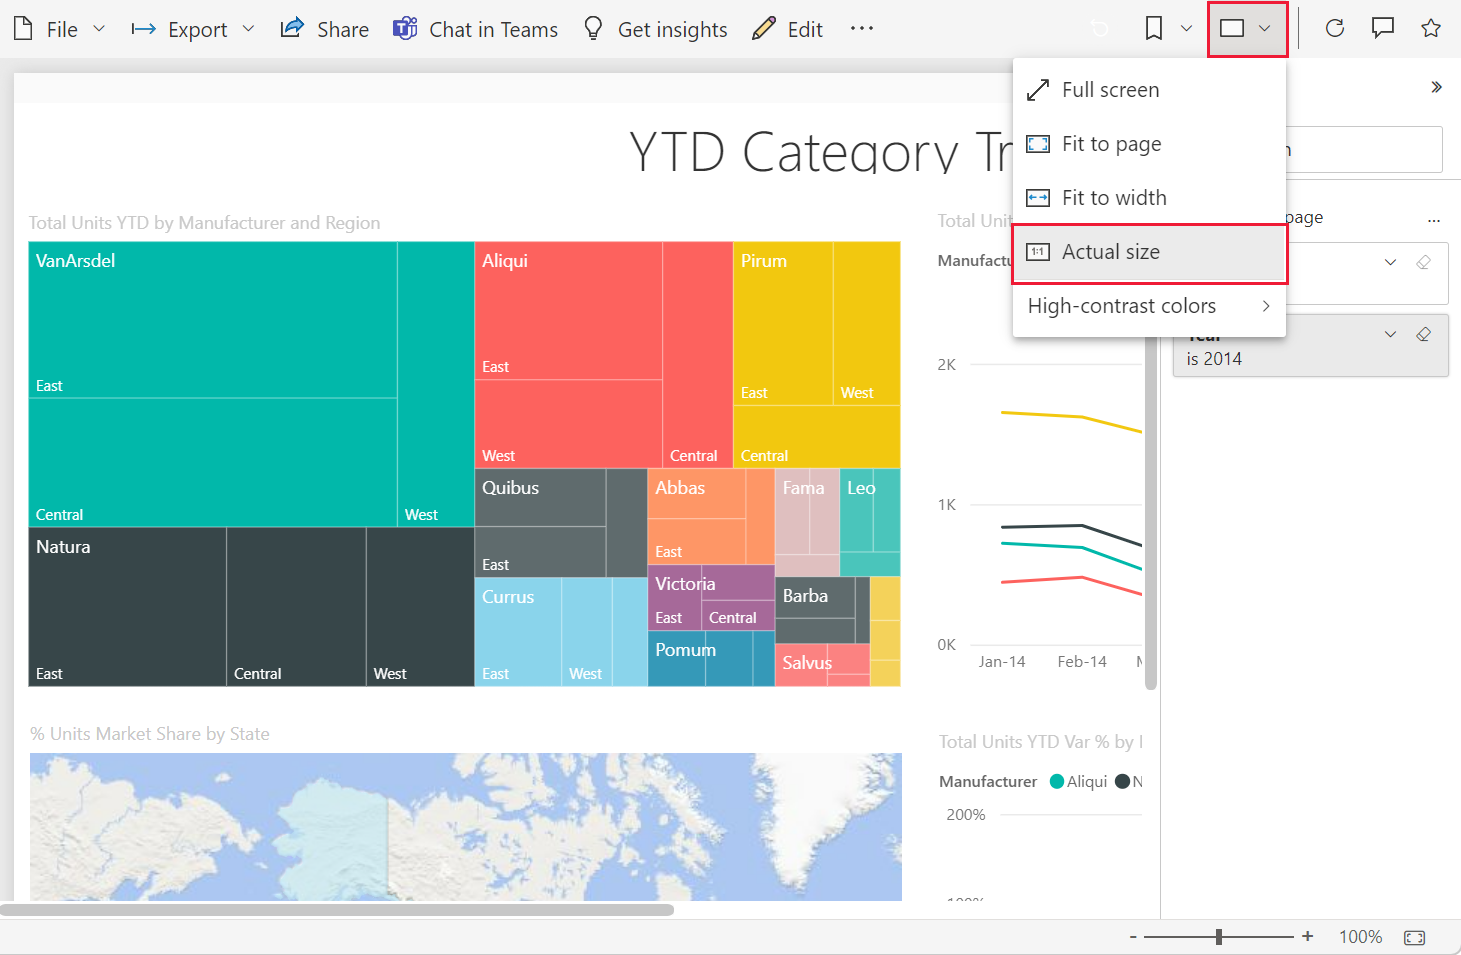
Change the size and display of your report. To adjust the report display size, use the slider in the bottom right. To select display options from a menu, open the View menu and choose a display option. Your choices are Full screen, Actual size, Fit to page, and Fit to width. Notice the difference that each display options makes.

There are many ways for you to interact with a report to discover insights and make business decisions. Other articles about Power BI reports are available from the Power BI Learn table of contents.
The apps you receive from colleagues are located on the Home page and in the Apps container on your navigation pane. An app is a collection of dashboards and reports that a Power BI designer compiles for you.
You must have a Power BI Pro license to open an app unless the app workspace is stored in Premium capacity. A user with any Power BI license can have access to reports stored in Premium capacity.
Follow along with Microsoft sample content.
In your browser, go to appsource.microsoft.com.
Search for "Sales & Marketing" and select Microsoft sample - Sales & Marketing.
Select Get it now > Continue > Install to install the app in your Apps container.
Go back to Home by selecting Home from the navigation pane.
Scroll down and select My Apps.
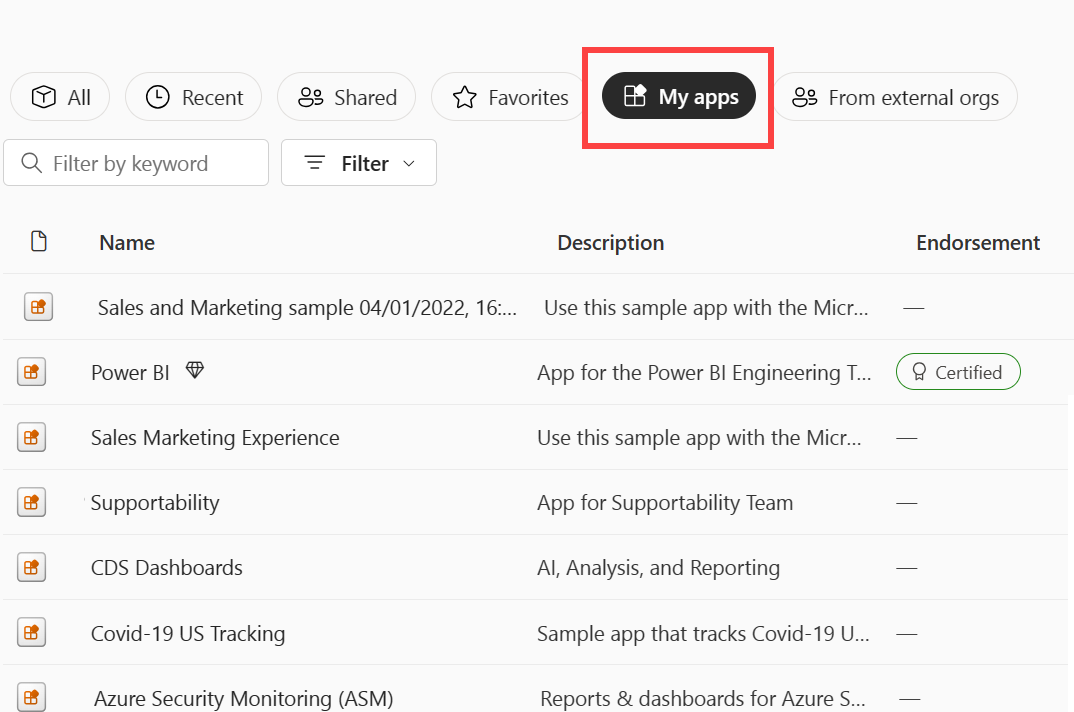
Select your new Sales and Marketing app to open it. Depending on the options set by the app designer, the app opens to a dashboard or a report. This app opens to a dashboard.
Most dashboard tiles are pinned from reports. Selecting a tile opens the report that was used to create the tile.
To open an underlying report, select a tile from a dashboard. From the Sales and Marketing dashboard, we select the Total Units YTD Variance % column chart tile.

The associated report opens to the YTD Category Trend Analysis page. This is the source page for the column chart tile.

Lưu ý
Not all tiles lead to a report. If you select a tile that was created with Q&A, the Q&A screen opens. If you select a tile that was created using the dashboard Add tile widget, a video, website, or other content might open.
As you get more comfortable navigating the Power BI service, you figure out workflows that are best for you. A few other ways to access reports:
Sự kiện
Giải vô địch thế giới Power BI DataViz
16 giờ 14 thg 2 - 16 giờ 31 thg 3
Với 4 cơ hội tham gia, bạn có thể giành được gói hội nghị và lọt vào Chung kết TRỰC TIẾP ở Las Vegas
Tìm hiểu thêmĐào tạo
Mô-đun
Create and share your first Power BI report - Training
With Power BI, you can create compelling visuals and reports. In this module, you learn how to use Power BI Desktop to connect to data, build visuals, and create a report that you can share with others in your organization. You then learn how to publish the report to the Power BI service, so that others can see your insights and benefit from your work.
Chứng chỉ
Được Microsoft Chứng nhận: Liên kết Phân tích Dữ liệu Power BI - Certifications
Thể hiện các phương pháp và thực tiễn tốt nhất phù hợp với yêu cầu kỹ thuật và kinh doanh để lập mô hình, trực quan hóa và phân tích dữ liệu với Microsoft Power BI.
Tài liệu
How to be sure that content is up to date - Power BI
Learn how Power BI ensures you're working with the latest version of the data, report, dashboard, and app.
Getting around in the Power BI service - Power BI
Overview of the Power BI navigation experience
The Power BI service - basic concepts for beginners - Power BI
The Power BI service apps, workspaces, dashboards, reports, semantic models, and workbooks.