Work with DAX query view
With DAX query view in Power BI, you can view and work with Data Analysis Expressions (DAX) queries in semantic models.
DAX queries
In Power BI, DAX formulas are used to define different types of calculations for your data, but can also be used to define role security. DAX queries, on the other hand, can be used to return data from the model.
DAX queries are similar to SQL queries in that they can show you data you already have. DAX queries don't create items in the model or visuals in the report.
DAX queries have two main parts:
- An EVALUATE statement, which is required. It specifies what and how data is returned in the query.
- A DEFINE statement, which is optional. It allows you to define DAX formulas, such as a measure, to use in the query. Measures created or updated using the DAX query DEFINE MEASURE are DAX query scoped measures, running only in the context of the DAX query. DAX query scoped measures can be added to the model using CodeLens update model actions or Update model with changes button.
To learn more about how queries are used, see DAX queries in the DAX reference.
Open DAX query view
In Power BI Desktop, select the DAX Query View icon on the left side.
![]()
DAX query view layout
Let's take a closer look at DAX query view in Power BI Desktop.

DAX query view has these elements:
Ribbon
The DAX query view ribbon has common actions used when writing DAX queries.
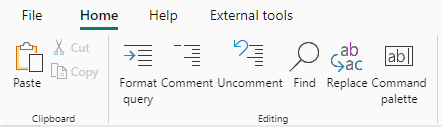
Let's take a closer look at elements in the ribbon:
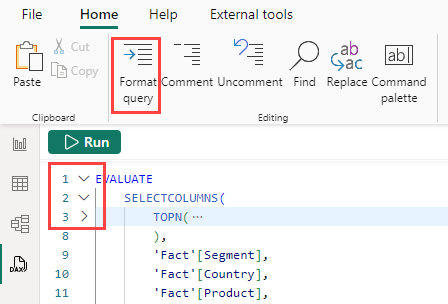
Format query
Select the Format query ribbon button or use SHIFT+ALT+F to format the current query. The query is indented with tabs. DAX functions are changed to UPPERCASE, and additional lines are added. Formatting your DAX query is considered a best practice and improves the DAX query readability. The formatting also indents in such a way that you can collapse and expand sections of the query.
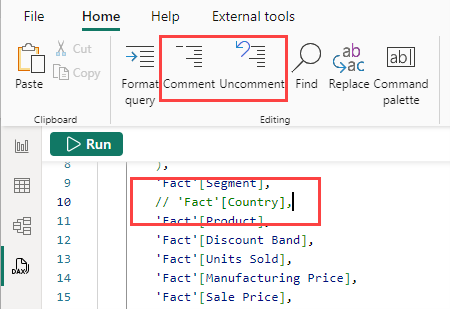
Comment and Uncomment
Select the Comment ribbon button to add a double backslash (//) to the beginning of the line where the cursor is or all the selected lines. This comments out the lines and when the DAX query is run, those lines are ignored.
Select the Uncomment ribbon button to remove // at the beginning of any line where the cursor is, or all the selected lines. It doesn't work on lines where multiple line comment notation is added.
You can also use CTRL+/ to toggle between comment and uncomment.
Find and Replace
Select the Find ribbon button or use CTRL+F to search for text in the DAX query editor. Find includes options to match case, match whole word, use a regular expression, and cycle through all matches for the current query. You can also select the chevron to the left of the Find box to enter Replace.

Select the Replace button in the ribbon or use CTRL+H to search for and replace text in the DAX query editor. Replace includes options to preserve the case and replace one at a time or all at once.

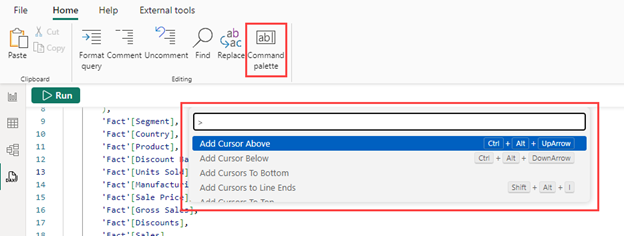
Command palette
Select the Command palette ribbon button or use CTRL+ALT+P to open the command palette box. You can search for additional DAX query editor actions and see their associated keyboard shortcuts.
Command bar
The DAX query view command bar includes the most important actions when using DAX query view.
Run and Cancel
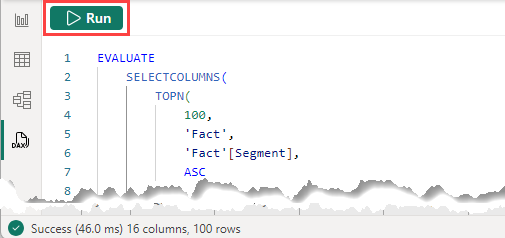
The Run button executes the DAX query or the selected lines of a query. The status of a query after it runs appears in the lower status bar.
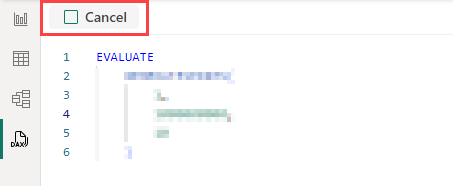
When a query is running, the button becomes a Cancel button, which can be used to stop a running query.
Update model with changes
The Update model with changes button will add or overwrite model measures with the DAX formulas from the DAX query scoped measures. DAX query scoped measures are those in the DEFINE MEASURE block. Alternatively, you can choose to add or overwrite model measures individually using the CodeLens text that appears above each one.
DAX query editor
DAX query view includes a query editor where you can write and edit queries. It's more than just a bigger DAX formula bar. It's more powerful and has many similarities to the DAX editor available in VS Code.
DAX query editor has the following elements:
Suggestions and Intellisense
Type in your query and get help with suggestions and Intellisense while editing.
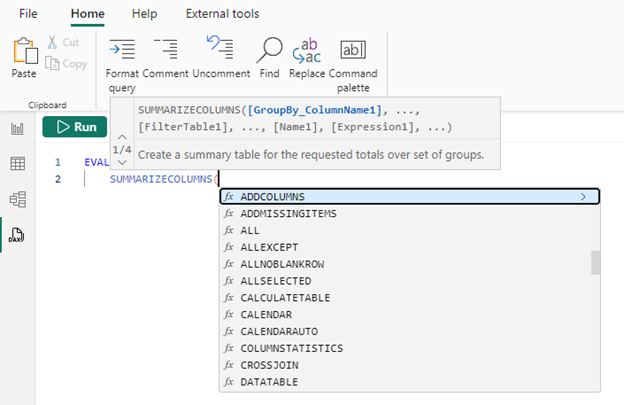
Use ENTER or TAB to add the highlighted intellisense, or SHIFT+ENTER or ALT+ENTER to move to another line without adding the intellisense option. Selecting ESC closes any of the overlays.
Hover to see measure formulas
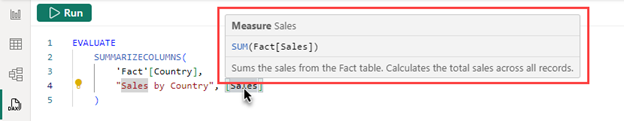
When a measure is included in the DAX query, you can hover on it to see the formula, name, and description.
Select to see measure lightbulb quick actions
Selecting on a measure in an EVALUATE statement in a query without a DEFINE statement shows the quick actions lightbulb. Select Define or Define with references to create a DEFINE statement with this measure’s formula with or without the reference measure DAX formulas.
Update model measures using CodeLens
Using DEFINE MEASURE is helpful when creating measures by first allowing you to create them as DAX query scoped measures. You can edit multiple measures in one window and then run the query to see the results of all or just some of them with specific group by columns. You don't need to create a table visual in Report view and switch back and forth between measure formulas. CodeLens takes this one step further by providing prompts when the measure already exists in the model, or if it doesn't, it can add it.
CodeLens is the clickable text that shows above a DEFINE MEASURE block. For DAX query scoped measures that are not already present in the model, the Update model: Add new measure CodeLens appears, which will add the model measure when clicked. For DAX query scoped measures that are already present in the model, and when the DAX scoped measure DAX formula is different, the Update model: Overwrite measure CodeLens appears, which will change the model measure to this DAX formula when clicked.
Alternatively, you can add or overwrite multiple measures at once by clicking the Update model with changes button in the Command bar.
Measure update workflow
The lightbulb quick actions and CodeLens can be used together in a complete workflow:
- In the context menu of a measure, choose Quick queries, then Evaluate to have the query created for you in a new Query tab.
- Select the measure in the query to Define or Define with references, adding the DEFINE statement.
- Make expression updates to the measure, then run the DAX query to show the change.
- When the change appears as expected, then use the CodeLens Update model: Overwrite measure to save it back to the model.
Here's a more visual way to understand the workflow:

Results grid
When a query is run, the results are shown in the Results grid.

If there's more than one EVALUATE statement in the query editor, then multiple results can be returned. You can use the Result dropdown to switch between them. The Copy button copies the entire grid as a tab delimited table with headers. The grid can be resized using the upper right hand corner arrows or manually with the cursor on the border between the result grid and the query editor.
If the query results in an error, the results grid shows it.

A copy button transfers the error to your clipboard. The beginning of the error indicates where in the query the error is. In the image above the error is:
"Query (4, 23) The value for 'Sales 2' cannot be determined. Either the column doesn't exist, or there is no current row for this column."
And "Query (4, 23)" indicates the error is on line 4 and at character 23.
Query tabs
DAX query view can have multiple query tabs, which can be renamed or removed. They also show the current state of the query.
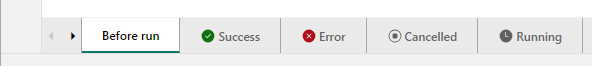
Each tab includes a status indicator:
- No indicator shows before a query has been run.
- A green checkmark indicates a successful query run.
- A red cross indicates an error occurred.
- A filled square in a circle indicates the query was canceled.
- A clock indicates the query is running.
Queries can run in the background allowing you to continue working on other query tabs.
Saving of DAX queries
DAX query view query tabs are saved in the file when you save from Power BI Desktop, so you can continue where you left off when you open the file again. If you use the developer mode to save a Power BI project, each query tab is included as a .dax file in the DAXQueries folder of the semantic model folder. Learn more at the Power BI developer mode documentation.
Currently, you cannot view or edit the DAX queries in the Power BI service. Viewers of the report or semantic model do not see the DAX queries saved with the semantic model.
Data pane
The Data pane shows the items in the model to help you write queries. The editing paths for most of these items is blocked in the query view.
Quick queries
The Data pane context menu includes Quick queries. Use quick queries to create queries in a new query tab for tables, columns, and measures. Quick queries are designed to be a productivity boost for common tasks and built so they can easily be further modified. All quick queries are created in a new query tab and are run automatically.
Anywhere
Define all measures in the model creates a query with all the measure formulas shown in a query. Easily search all your measure formulas.
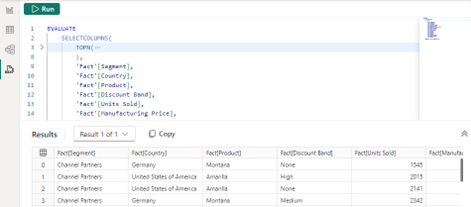
Tables
Show top 100 rows creates a query by using SELECTCOLUMNS() to show the top 100 rows of the table. The columns are listed on each line to allow for easy modification by commenting out lines. An ORDER BY is also included to specify your sort order.
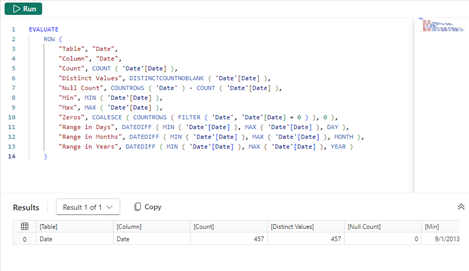
Show column statistics creates a query showing statistical information for every column in your table. See many of the formulas for how to aggregate columns as MIN, MAX, AVERAGE, COUNT, and more.
Define all measures in this table creates a query with this table’s measure formulas shown in a query.

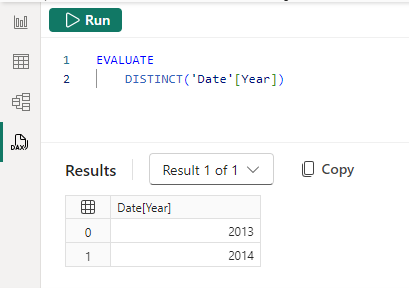
Columns
Show data preview creates a query using DISTINCT() to see the values of a column.
Show column statistics creates a query showing statistical information for this specific column. See many formulas for how to aggregate the column as MIN, MAX, AVERAGE, COUNT, and more. The query returned varies depending on the data type of the column, showing different statistics for numeric, text, and date columns.

Measures
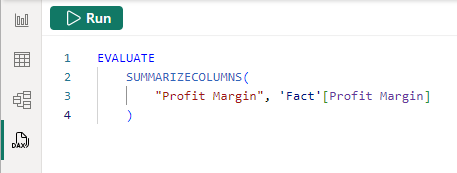
Evaluate creates a query to show the result of the measure. SUMMARIZECOLUMNS() is used so you can add in any group by columns to show the measure by specific groups such as Country, Product, etc.
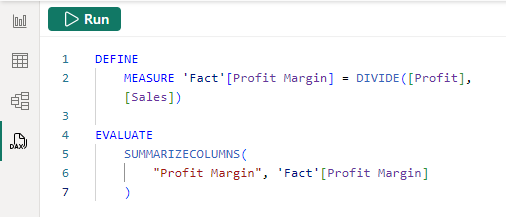
Define and evaluate creates a query to show the result of the measure and show the measure’s formula in a DEFINE statement that can then be modified.
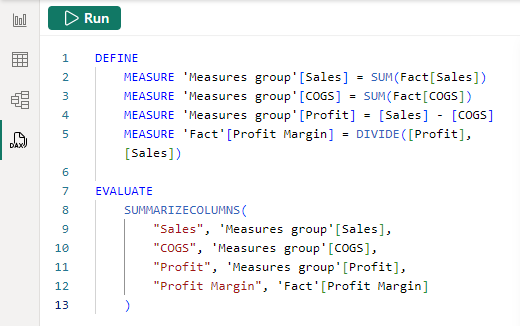
Define with references and evaluate creates a query to show the result of the measure and show not only the measure’s formula in a DEFINE statement that can be modified, but also any other measures referenced in the measure formula. Edit any part in the full context of the measure.
Getting visual DAX queries from Performance Analyzer
Visuals in Report view get data from the model by creating a DAX query. The visual query can be viewed in DAX query view by using Performance Analyzer. Performance Analyzer can give you insight into why a visual may be showing an unexpected value or simply as a way to quickly start a query you can further modify.
In Report view, go to the Optimize ribbon, then select Performance Analyzer. Select Start recording, then Refresh visuals. In the table below, expand a visual to see options to copy query or run in DAX query view. Selecting on Run in DAX query view takes the visual query, adds it as a new Query tab in DAX query view, and then runs it.

DAX query view and live connect in Power BI Desktop
Power BI Desktop can live connect to a published Power BI semantic model by clicking Connect when a semantic model is selected in the OneLake data hub. In the lower right-hand corner of the Report view will show Live connected to the Power BI semantic model. DAX query view can be used to write DAX queries when live connected.
Model measures
When live connected to a published Power BI semantic model, you cannot view or edit model measures. Quick queries options are limited to only Evaluate.
Report measures
When live connected to a published Power BI semantic model, you can create report measures. Report measures can be created using the New measure action in Report and Model view, but as the name suggests, are only available in the current report. Once created, the Quick queries in DAX query view shows the option to Define with references and evaluate. DAX queries run on the semantic model, so report measures must always be converted to DAX query scoped measures in the DEFINE MEASURE block to run, as they do not exists in the model itself.
Update model with changes button and CodeLens options to Update model are not available for report measures.
Considerations and limitations
Considerations to keep in mind:
- 500+ lines in DAX query editor has noticeable lag when typing.
- Lightbulb quick actions for measures only displays when no DEFINE statement is in the query tab.
- Command palette shows some commands that do not yet work.
- Result grid doesn't yet show columns and measures with specified format, such as Currency, Whole number with thousands, etc.
- Download this file from Power BI service will not include the DAX queries saved in published semantic model.
- Setting up the initial Git integration from the workspace will not include DAX queries saved in published semantic model. Learn more at Fabric Git integration.
And there are some limitations to keep in mind:
- Maximum of 15MB of data per query. Once 15MB is exceeded, the current row completes but no additional rows are written.
- Maximum of 1,000,000 values per query. If you query for 20 columns, you can get back max 50,000 rows (1 million divided by 20).
- Define all measures in this table or model is unavailable when there are more than 500 measures.
Related content
Phản hồi
Sắp ra mắt: Trong năm 2024, chúng tôi sẽ dần gỡ bỏ Sự cố với GitHub dưới dạng cơ chế phản hồi cho nội dung và thay thế bằng hệ thống phản hồi mới. Để biết thêm thông tin, hãy xem: https://aka.ms/ContentUserFeedback.
Gửi và xem ý kiến phản hồi dành cho