Sự kiện
Giải vô địch thế giới Power BI DataViz
16 giờ 14 thg 2 - 16 giờ 31 thg 3
Với 4 cơ hội tham gia, bạn có thể giành được gói hội nghị và lọt vào Chung kết TRỰC TIẾP ở Las Vegas
Tìm hiểu thêmTrình duyệt này không còn được hỗ trợ nữa.
Hãy nâng cấp lên Microsoft Edge để tận dụng các tính năng mới nhất, bản cập nhật bảo mật và hỗ trợ kỹ thuật.
In Power BI Desktop, you can specify the data category for a column so Power BI Desktop knows how it should treat its values when in a visualization.
When Power BI Desktop imports data, it gets other information than the data itself, like the table and column names, and whether the data is a primary key. With that information, Power BI Desktop makes some assumptions about how to give you a good default experience when creating a visualization. For example, when a column has numeric values, you'll probably want to aggregate it in some way, so Power BI Desktop places it in the Values area of the Visualizations pane. Or, for a column with date-time values on a line chart, Power BI Desktop assumes you'll probably use it as a time hierarchy axis.
But, there are some cases that are a bit more challenging, like geography. Consider the following table from an Excel worksheet:

Should Power BI Desktop treat the codes in the GeoCode column as an abbreviation for a Country/Region or a US State? The answer to that question isn't clear, because a code like this can mean either one. For instance, AL can mean Alabama or Albania. AR can mean Arkansas or Argentina. Or CA can mean California or Canada. It makes a difference when we go to chart our GeoCode field on a map.
Should Power BI Desktop show a picture of the world with countries/regions highlighted? Or should it show a picture of the United States with states highlighted? You can specify a data category for data just like this. Data categorization further refines the information Power BI Desktop can use to provide the best visualizations.
Use the following steps to specify a data category:
In Report view or Table view, in the Data pane, select the field you want to be sorted by a different categorization.
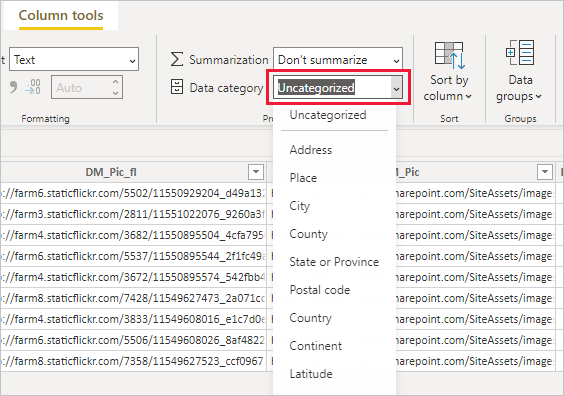
On the ribbon, in the Properties area of the Column tools tab, select the dropdown arrow next to Data category. This list shows the data categories you can choose for your column. Some selections might be disabled if they don't work with the current data type of your column. For example, if a column is a date or time data type, Power BI Desktop won't let you choose geographic data categories.
Select the category you want.

You might also be interested in learning about geographic filtering for Power BI mobile apps.
Sự kiện
Giải vô địch thế giới Power BI DataViz
16 giờ 14 thg 2 - 16 giờ 31 thg 3
Với 4 cơ hội tham gia, bạn có thể giành được gói hội nghị và lọt vào Chung kết TRỰC TIẾP ở Las Vegas
Tìm hiểu thêmĐào tạo
Mô-đun
Design interactive data experiences with Power BI Desktop - Training
Power BI enables report authors to produce interactive reports using visuals, slicers, bookmarks, and more.
Chứng chỉ
Được Microsoft Chứng nhận: Liên kết Phân tích Dữ liệu Power BI - Certifications
Thể hiện các phương pháp và thực tiễn tốt nhất phù hợp với yêu cầu kỹ thuật và kinh doanh để lập mô hình, trực quan hóa và phân tích dữ liệu với Microsoft Power BI.
Tài liệu
Use grouping and binning in Power BI Desktop - Power BI
Learn how to group and bin elements to ensure the visuals in your reports show your data the way you want them to.
Use the Field list in Power BI Desktop - Power BI
Learn how the user interface (UI) for the Field list, and the icons in the list, have changed in Power BI Desktop.
Use quick measures for common and powerful calculations - Power BI
Learn how to use quick measures to provide ready-made DAX formulas that make quick work of common calculations.