診斷記錄 - Azure 內容傳遞網路
使用 Azure 診斷記錄,您可以檢視核心分析,並將其儲存到一或多個目的地,包括:
- Azure 儲存體帳戶
- Log Analytics 工作區
- Azure 事件中樞
此功能適用於所有定價層的內容傳遞網路端點。
診斷記錄可讓您將基本使用計量從內容傳遞網路端點匯出至不同類型的來源,以便以自定義方式取用它們。 您可以執行下列型態的資料匯出:
- 將數據匯出至 Blob 記憶體、匯出至 CSV,並在 Excel 中產生圖形。
- 將數據匯出至事件中樞,並與來自其他 Azure 服務的數據相互關聯。
- 將數據匯出至 Azure 監視器記錄,並在您自己的 Log Analytics 工作區中檢視數據
下列步驟需要 Azure 內容傳遞網路 配置檔。 請先參閱建立 Azure 內容傳遞網路 配置檔和端點,再繼續進行。
使用 Azure 入口網站啟用記錄
請遵循下列步驟,為您的 Azure 內容傳遞網路 端點啟用記錄:
登入 Azure 入口網站。
在 Azure 入口網站 中,流覽至 your-cdn-profile 的所有資源。>
選取您要啟用診斷記錄的內容傳遞網路端點:
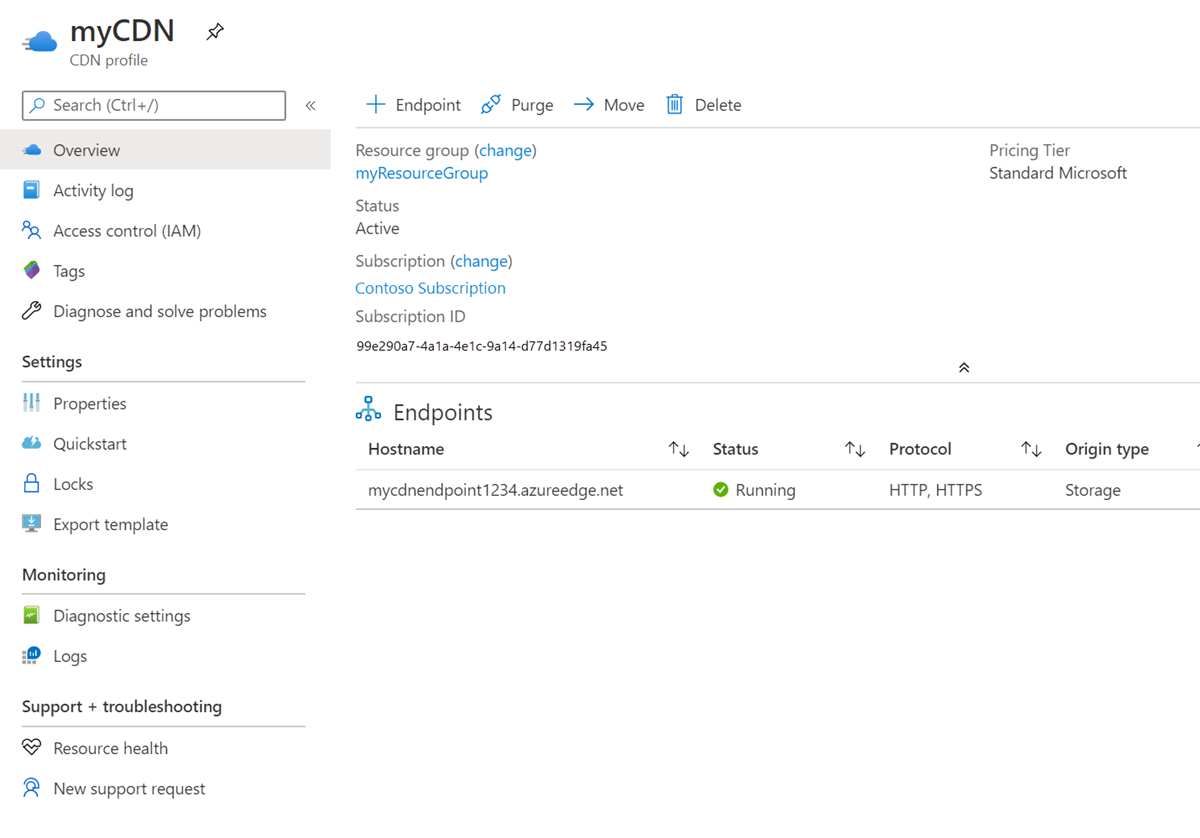
在 [監視] 區段中選取 [診斷記錄]:
![[監視] 功能表下 [診斷記錄] 按鈕的螢幕快照。](media/cdn-diagnostics-log/03_diagnostics-logs-options.png)
使用 Azure 儲存體 啟用記錄
若要使用記憶體帳戶來儲存記錄,請遵循下列步驟:
注意
需要記憶體帳戶才能完成這些步驟。 如需詳細資訊,請參閱:建立 Azure 儲存體 帳戶。
針對 [診斷設定名稱],輸入診斷記錄設定的名稱。
選取 [ 封存至記憶體帳戶],然後選取 [CoreAnalytics]。
針對 [ 保留日],選擇保留天數。 保留零天會無限期地儲存記錄。
選取記錄的訂用帳戶和記憶體帳戶。
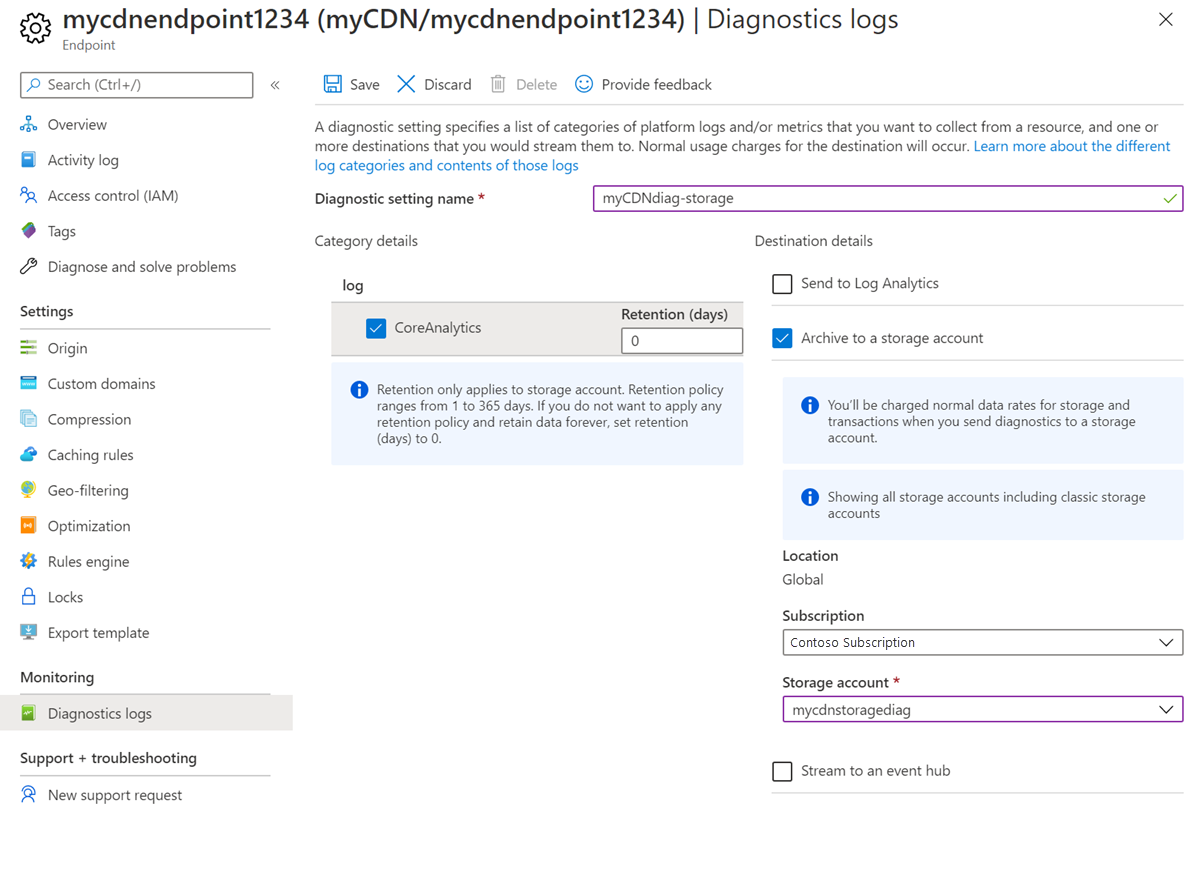
選取 [儲存]。
傳送至 Log Analytics
若要針對記錄使用 Log Analytics,請遵循下列步驟:
注意
需要 Log Analytics 工作區才能完成這些步驟。 如需詳細資訊,請參閱:在 Azure 入口網站 中建立Log Analytics工作區。
針對 [診斷設定名稱],輸入診斷記錄設定的名稱。
選取 [ 傳送至 Log Analytics],然後選取 [CoreAnalytics]。
選取記錄的訂用帳戶和Log Analytics工作區。
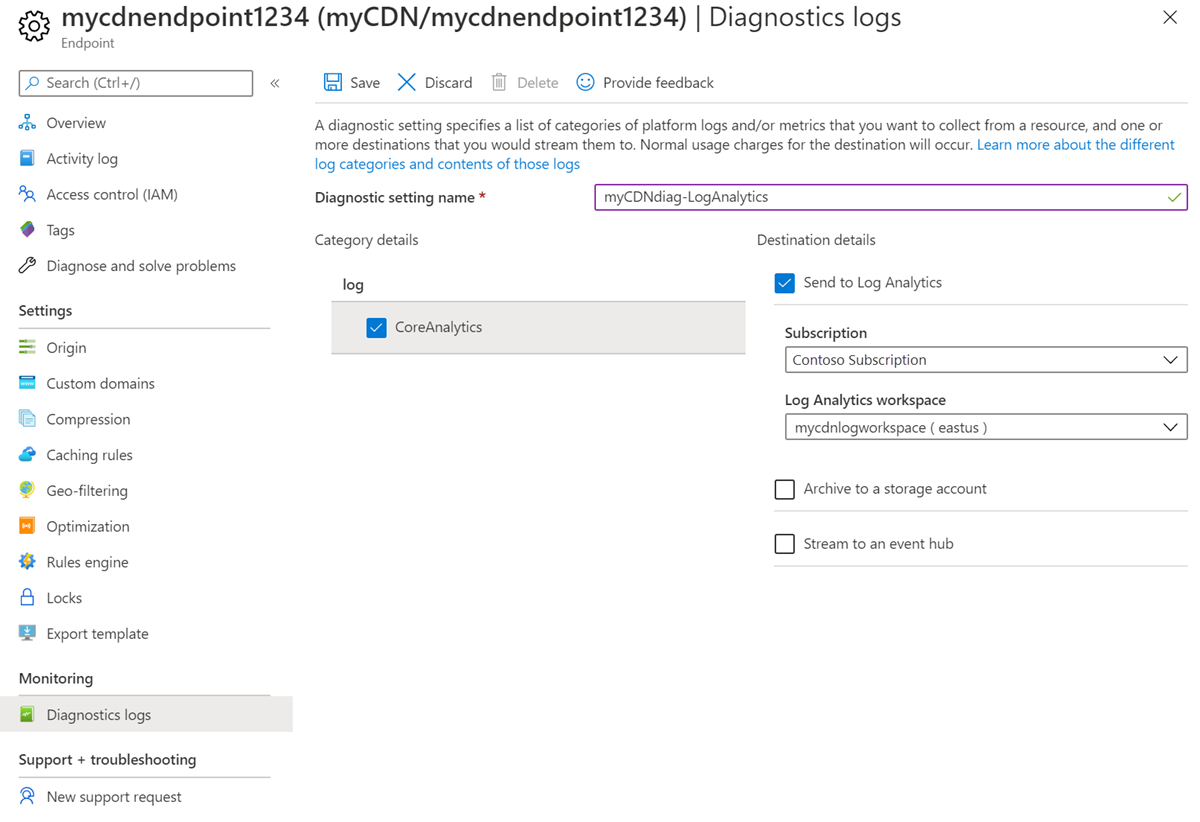
選取 [儲存]。
串流至事件中樞
若要針對記錄使用事件中樞,請遵循下列步驟:
注意
需要事件中樞才能完成這些步驟。 請參閱:快速入門:使用 Azure 入口網站 建立事件中樞以取得詳細資訊。
針對 [診斷設定名稱],輸入診斷記錄設定的名稱。
選取 [ 串流至事件中樞],然後選取 [CoreAnalytics]。
選取記錄的訂用帳戶和事件中樞命名空間。
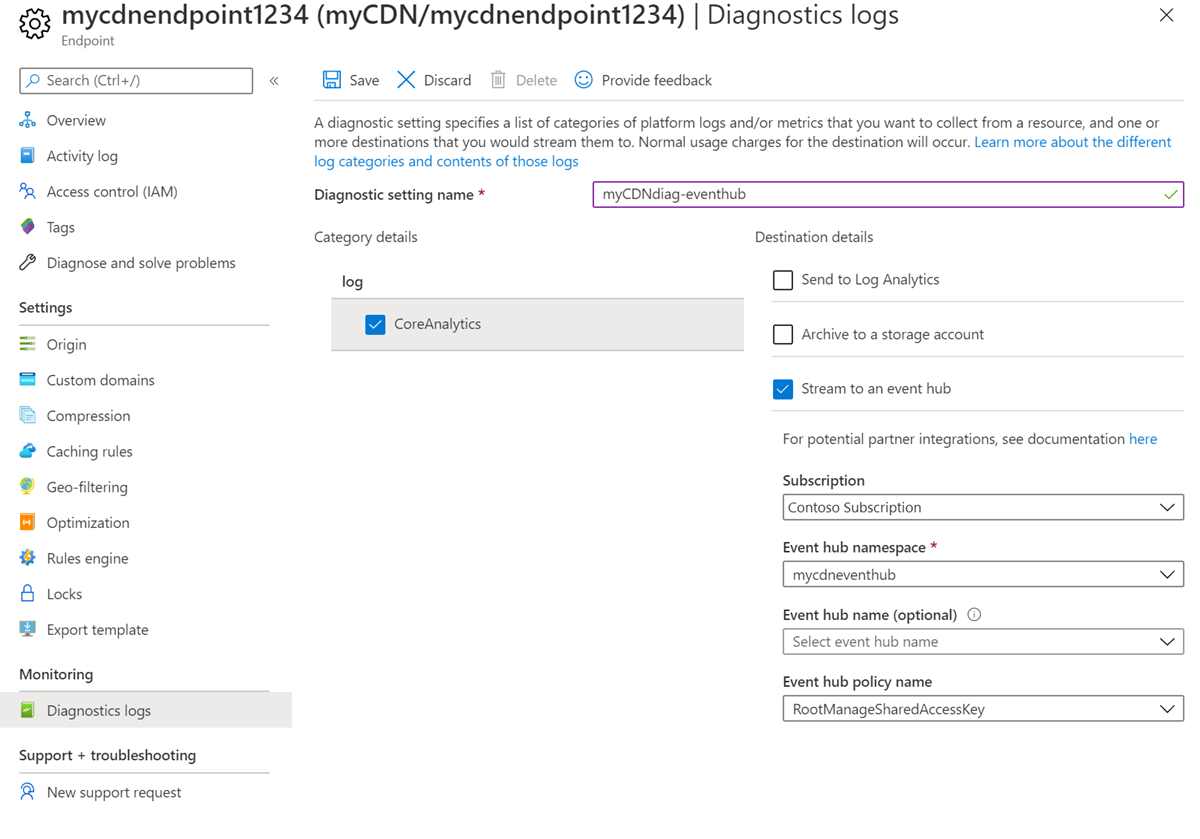
選取 [儲存]。
使用 PowerShell 啟用記錄
下列範例示範如何透過 Azure PowerShell Cmdlet 啟用診斷記錄。
注意
建議您使用 Azure Az PowerShell 模組來與 Azure 互動。 請參閱安裝 Azure PowerShell 以開始使用。 若要了解如何移轉至 Az PowerShell 模組,請參閱將 Azure PowerShell 從 AzureRM 移轉至 Az。
在記憶體帳戶中啟用診斷記錄
登入 Azure PowerShell:
Connect-AzAccount若要在記憶體帳戶中啟用診斷記錄,請輸入這些命令。 以您的值取代變數:
$rsg = <your-resource-group-name>
$cdnprofile = <your-cdn-profile-name>
$cdnendpoint = <your-cdn-endpoint-name>
$storageacct = <your-storage-account-name>
$diagname = <your-diagnostic-setting-name>

$cdn = Get-AzCdnEndpoint -ResourceGroupName $rsg -ProfileName $cdnprofile -EndpointName $cdnendpoint

$storage = Get-AzStorageAccount -ResourceGroupName $rsg -Name $storageacct

Set-AzDiagnosticSetting -Name $diagname -ResourceId $cdn.id -StorageAccountId $storage.id -Enabled $true -Categories CoreAnalytics
啟用Log Analytics工作區的診斷記錄
登入 Azure PowerShell:
Connect-AzAccount若要啟用 Log Analytics 工作區的診斷記錄,請輸入這些命令。 以您的值取代變數:
$rsg = <your-resource-group-name>
$cdnprofile = <your-cdn-profile-name>
$cdnendpoint = <your-cdn-endpoint-name>
$workspacename = <your-log-analytics-workspace-name>
$diagname = <your-diagnostic-setting-name>

$cdn = Get-AzCdnEndpoint -ResourceGroupName $rsg -ProfileName $cdnprofile -EndpointName $cdnendpoint

$workspace = Get-AzOperationalInsightsWorkspace -ResourceGroupName $rsg -Name $workspacename

Set-AzDiagnosticSetting -Name $diagname -ResourceId $cdn.id -WorkspaceId $workspace.ResourceId -Enabled $true -Categories CoreAnalytics
啟用事件中樞命名空間的診斷記錄
登入 Azure PowerShell:
Connect-AzAccount若要啟用 Log Analytics 工作區的診斷記錄,請輸入這些命令。 以您的值取代變數:
$rsg = <your-resource-group-name>
$cdnprofile = <your-cdn-profile-name>
$cdnendpoint = <your-cdn-endpoint-name>
$eventhubname = <your-event-hub-namespace-name>
$diagname = <your-diagnostic-setting-name>

$cdn = Get-AzCdnEndpoint -ResourceGroupName $rsg -ProfileName $cdnprofile -EndpointName $cdnendpoint

Set-AzDiagnosticSetting -Name $diagname -ResourceId $cdn.id -EventHubName $eventhubname -Enabled $true -Categories CoreAnalytics
從 Azure 儲存體取用診斷記錄
本節說明內容傳遞網路核心分析的架構、Azure 儲存體 帳戶中的組織,並提供範例程式代碼來下載 CSV 檔案中的記錄。
使用 Microsoft Azure 儲存體總管
若要下載此工具,請參閱 Azure 儲存體 Explorer。 下載並安裝軟體之後,請將它設定為使用設定為內容傳遞網路診斷記錄目的地的相同 Azure 儲存體 帳戶。
- 開啟 Microsoft Azure 儲存體總管
- 找出記憶體帳戶
- 展開此記憶體帳戶底下的 [Blob 容器] 節點。
- 選取名為 insights-logs-coreanalytics 的容器。
- 結果會顯示在右側窗格中,從第一個層級開始,即 resourceId=。 繼續選取每個層級, 直到您找到檔案PT1H.json為止。 如需路徑的說明,請參閱 Blob 路徑格式。
- 每個 blob PT1H.json 檔案代表特定內容傳遞網路端點或其自定義網域一小時的分析記錄。
- 此 JSON 檔案內容的架構會在核心分析記錄的架構一節中說明。
Blob 路徑格式
每小時都會產生核心分析記錄,並將數據收集並儲存在單一 Azure Blob 中作為 JSON 承載。 儲存體 總管工具會將 『/』 解譯為目錄分隔符,並顯示階層。 Azure Blob 的路徑會顯示為有階層式結構,並代表 Blob 名稱。 Blob 的名稱遵循下列命名慣例:
resourceId=/SUBSCRIPTIONS/{Subscription Id}/RESOURCEGROUPS/{Resource Group Name}/PROVIDERS/MICROSOFT.CDN/PROFILES/{Profile Name}/ENDPOINTS/{Endpoint Name}/ y=/m=/d=/h=/m=/PT1H.json
欄位的描述:
| 值 | Description |
|---|---|
| 訂用帳戶識別碼 | 全域唯一識別碼 (GUID) 格式的 Azure 訂用帳戶標識碼。 |
| 資源群組名稱 | 內容傳遞網路資源所屬的資源群組名稱。 |
| 設定檔名稱 | 內容傳遞網路配置檔的名稱 |
| 端點名稱 | 內容傳遞網路端點的名稱 |
| Year | 年份的四位數表示法,例如 2017 年 |
| 月 | 月份數位的兩位數表示法。 01=1 月...12=12 月 |
| Day | 當月日期的兩位數表示法 |
| PT1H.json | 儲存分析數據的實際 JSON 檔案 |
將核心分析數據匯出至 CSV 檔案
若要存取核心分析,會提供工具的範例程序代碼。 此工具允許將 JSON 檔案下載成以一般逗號分隔的檔案格式,可用來建立圖表或其他匯總。
以下是您可以使用此工具的方式:
- 瀏覽 GitHub 連結: https://github.com/Azure-Samples/azure-cdn-samples/tree/master/CoreAnalytics-ExportToCsv
- 下載程序代碼。
- 請遵循指示進行編譯和設定。
- 執行該工具。
- 產生的 CSV 檔案會顯示簡單平面階層中的分析數據。
記錄數據延遲
下表顯示來自 Microsoft 的 Azure CDN 標準記錄數據延遲,以及來自 Edgio 的 Azure CDN Standard/進階版。
| Microsoft 記錄數據延遲 | Edgio 記錄數據延遲 |
|---|---|
| 延遲1小時。 | 延遲 1 小時,最多可能需要 2 小時才會開始出現在端點傳播完成之後。 |
內容傳遞網路核心分析的診斷記錄類型
Microsoft 目前僅提供核心分析記錄,其中包含顯示 HTTP 回應統計數據和輸出統計數據的計量,如內容傳遞網路 POP/邊緣所見。
核心分析計量詳細數據
下表顯示核心分析記錄中可用的計量清單:
- 來自 Microsoft 的 Azure CDN 標準
- 來自 Edgio 的 Azure CDN Standard/進階版
並非所有的計量都可從所有提供者取得,但這類差異很小。 數據表也會顯示提供者是否提供指定的計量。 計量僅適用於具有流量的那些內容傳遞網路端點。
| 計量 | 描述 | Microsoft | Edgio |
|---|---|---|---|
| RequestCountTotal | 此期間的要求叫用總數。 | Yes | Yes |
| RequestCountHttpStatus2xx | 導致 2xx HTTP 程式代碼的所有要求計數(例如 200、202)。 | Yes | Yes |
| RequestCountHttpStatus3xx | 導致 3xx HTTP 程式代碼的所有要求計數(例如 300、302)。 | Yes | Yes |
| RequestCountHttpStatus4xx | 導致 4xx HTTP 程式代碼的所有要求計數(例如 400、404)。 | Yes | Yes |
| RequestCountHttpStatus5xx | 導致 5xx HTTP 程式代碼的所有要求計數(例如 500、504)。 | Yes | Yes |
| RequestCountHttpStatusOthers | 所有其他 HTTP 代碼的計數(在 2xx-5xx 之外)。 | Yes | Yes |
| RequestCountHttpStatus200 | 導致 200 HTTP 程式代碼回應的所有要求計數。 | 是 | No |
| RequestCountHttpStatus206 | 導致 206 HTTP 程式代碼回應的所有要求計數。 | 是 | No |
| RequestCountHttpStatus302 | 導致 302 HTTP 程式代碼回應的所有要求計數。 | 是 | No |
| RequestCountHttpStatus304 | 導致 304 HTTP 程式代碼回應的所有要求計數。 | 是 | No |
| RequestCountHttpStatus404 | 導致 404 HTTP 程式代碼回應的所有要求計數。 | 是 | No |
| RequestCountCacheHit | 導致快取命中的所有要求計數。 資產會直接從 POP 提供給用戶端。 | Yes | Yes |
| RequestCountCacheMiss | 導致快取遺漏的所有要求計數。 快取遺漏表示在最接近用戶端的 POP 上找不到資產,而且是從來源擷取。 | Yes | Yes |
| RequestCountCacheNoCache | 由於邊緣上的使用者設定,導致無法快取資產的所有要求計數。 | Yes | Yes |
| RequestCountCacheUncacheable | 資產的所有要求計數,這些要求都無法由資產的 Cache-Control 和 Expires 標頭快取。 此計數表示不應該在 POP 或 HTTP 用戶端上快取。 | Yes | Yes |
| RequestCountCacheOthers | 先前所列計量未涵蓋所有快取狀態的要求計數。 | No | Yes |
| EgressTotal | 以 GB 為單位的輸出資料傳輸 | Yes | Yes |
| EgressHttpStatus2xx | 輸出資料傳輸* ,以 GB 表示 2xx HTTP 狀態代碼的回應。 | Yes | Yes |
| EgressHttpStatus3xx | 3xx HTTP 狀態代碼為 GB 的響應輸出資料傳輸。 | Yes | Yes |
| EgressHttpStatus4xx | 4xx HTTP 狀態代碼為 GB 的響應輸出資料傳輸。 | Yes | Yes |
| EgressHttpStatus5xx | 5xx HTTP 狀態代碼為 GB 的響應輸出資料傳輸。 | Yes | Yes |
| EgressHttpStatusOthers | 輸出數據傳輸,以 GB 表示其他 HTTP 狀態代碼的回應。 | Yes | Yes |
| EgressCacheHit | 直接從內容傳遞網路 POP/Edges 上的內容傳遞網路快取所傳遞之回應的輸出數據傳輸。 | Yes | Yes |
| EgressCacheMiss。 | 在最近的 POP 伺服器上找不到且從源伺服器擷取之回應的輸出數據傳輸。 | Yes | Yes |
| EgressCacheNoCache | 因為邊緣上的使用者設定,導致無法快取的資產輸出數據傳輸。 | Yes | Yes |
| EgressCacheUncacheable | 無法由資產的 Cache-Control 和 或 Expires 標頭快取的資產輸出數據傳輸。 表示不應該在 POP 或 HTTP 用戶端上快取。 | Yes | Yes |
| EgressCacheOthers | 其他快取案例的輸出數據傳輸。 | No | Yes |
*輸出數據傳輸是指從內容傳遞網路 POP 伺服器傳送至用戶端的流量。
核心分析記錄的架構
所有記錄都會以 JSON 格式儲存,每個專案都有根據下列架構的字串字段:
    "records": [
        {
            "time": "2017-04-27T01:00:00",
            "resourceId": "<ARM Resource Id of the CDN Endpoint>",
            "operationName": "Microsoft.Cdn/profiles/endpoints/contentDelivery",
            "category": "CoreAnalytics",
            "properties": {
                "DomainName": "<Name of the domain for which the statistics is reported>",
                "RequestCountTotal": integer value,
                "RequestCountHttpStatus2xx": integer value,
                "RequestCountHttpStatus3xx": integer value,
                "RequestCountHttpStatus4xx": integer value,
                "RequestCountHttpStatus5xx": integer value,
                "RequestCountHttpStatusOthers": integer value,
                "RequestCountHttpStatus200": integer value,
                "RequestCountHttpStatus206": integer value,
                "RequestCountHttpStatus302": integer value,
                "RequestCountHttpStatus304": integer value,
                "RequestCountHttpStatus404": integer value,
                "RequestCountCacheHit": integer value,
                "RequestCountCacheMiss": integer value,
                "RequestCountCacheNoCache": integer value,
                "RequestCountCacheUncacheable": integer value,
                "RequestCountCacheOthers": integer value,
                "EgressTotal": double value,
                "EgressHttpStatus2xx": double value,
                "EgressHttpStatus3xx": double value,
                "EgressHttpStatus4xx": double value,
                "EgressHttpStatus5xx": double value,
                "EgressHttpStatusOthers": double value,
                "EgressCacheHit": double value,
                "EgressCacheMiss": double value,
                "EgressCacheNoCache": double value,
                "EgressCacheUncacheable": double value,
                "EgressCacheOthers": double value,
            }
        }

    ]
}
其中 時間 代表報告統計數據之小時界限的開始時間。 內容傳遞網路提供者不支援的計量,而不是雙精度浮點數或整數值,會產生 Null 值。 這個 Null 值表示沒有計量,且與值 0 不同。 每個網域的其中一組計量是在端點上設定。
範例屬性:
{
     "DomainName": "azurecdntest.azureedge.net",
     "RequestCountTotal": 480,
     "RequestCountHttpStatus2xx": 480,
     "RequestCountHttpStatus3xx": 0,
     "RequestCountHttpStatus4xx": 0,
     "RequestCountHttpStatus5xx": 0,
     "RequestCountHttpStatusOthers": 0,
     "RequestCountHttpStatus200": 480,
     "RequestCountHttpStatus206": 0,
     "RequestCountHttpStatus302": 0,
     "RequestCountHttpStatus304": 0,
     "RequestCountHttpStatus404": 0,
     "RequestCountCacheHit": null,
     "RequestCountCacheMiss": null,
     "RequestCountCacheNoCache": null,
     "RequestCountCacheUncacheable": null,
     "RequestCountCacheOthers": null,
     "EgressTotal": 0.09,
     "EgressHttpStatus2xx": null,
     "EgressHttpStatus3xx": null,
     "EgressHttpStatus4xx": null,
     "EgressHttpStatus5xx": null,
     "EgressHttpStatusOthers": null,
     "EgressCacheHit": null,
     "EgressCacheMiss": null,
     "EgressCacheNoCache": null,
     "EgressCacheUncacheable": null,
     "EgressCacheOthers": null
}