DOM breakpoints
Manage your DOM mutation breakpoints from this pane, including disabling, deleting and rebinding them.
You can use DOM mutation breakpoints to break into the debugger whenever a selected element node changes. This is helpful for tracking down the code responsible for causing visual glitches with your UI without having to set individual breakpoints on each of the 450+ DOM APIs in EdgeHTML that can trigger such changes.
To set a DOM breakpoint, right-click on any element in the Elements panel HTML tree view to open the context menu.
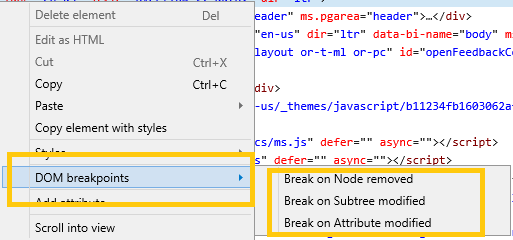
You can set any of the following breakpoints:
Break on Node removed: Break into the debugger when the selected element is removed from the document (DOM tree).
Break on Subtree modified: Break into the debugger when any of the descendants of the selected element are changed (added, removed, or their subtrees are modified). This will not break when attributes are modified (see the next option for that).
Break on Attribute modified: Break into the debugger when an attribute of the selected element is added, removed or changed in value.
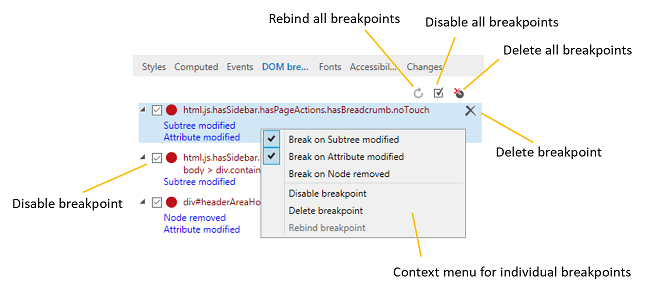
The DOM breakpoints pane will then list the selected element (by generating a selector describing its location in the DOM) and the types of breakpoints you have set (Node removed, Subtree modified, Attribute modified). From here, you can also rebind, disable, or delete your breakpoints, individually (from the rt-click context menu) or all at once (using the buttons).
Breakpoint persistence
Breakpoints are stored (and scoped to the URL of the page they're set within) as part of your DevTools settings. When the page is reloaded or the tools are closed and reopened, DevTools will attempt to rebind your breakpoints to their associated elements.
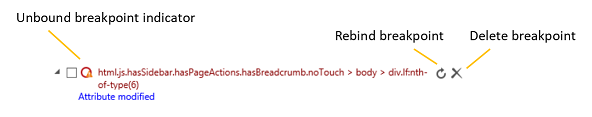
Breakpoints that couldn't be automatically rebinded are indicated with a warning icon on the breakpoint circle. For these, you can wait to rebind the element manually (using the Rebind breakpoint button and/or context menu option) once a corresponding element appears in the DOM (and the breakpoint icon no longer shows the warning indicator), or Delete the breakpoint altogether.
In addition to this DOM breakpoints pane, you can also manage your DOM breakpoints from within the Debugger.
Current limitations
Please be aware of the following limitations of DOM breakpoint debugging in Edge DevTools:
Edge DevTools don't currently support rebinding breakpoints inside of
<iframe>s. If you set a breakpoint in an iframe and close Edge DevTools or refresh the page, the breakpoint will be lost.If your script encounters a synchronously-executed breakpoint before the DOM
readyStateis completed, you won't be able to set a DOM breakpoint while the debugger is paused. You can typically remedy this situation by setting thedeferorasyncscript attributes.For synchronous scripts, we trigger automatic rebinding of breakpoints when the
window.onloadevent is called. In this case, we may miss binding breakpoints that would trigger during initial script-driven build-up of the DOM. For asynchronous scripts, we trigger a rebind attempt before the first script executes, so your breakpoints may rebind and trigger as desired.