Use the Debugger to step through code, set watches and breakpoints, live edit your code and inspect your caches. Test and troubleshoot your code by:
- Browsing and searching code from your loaded source files
- Controlling the execution flow as you step through your code
- Managing page storage resources, including the service workers and cache, cookies and web storage
- Setting breakpoints and live editing your code as it runs
- Tracking and editing local variables as you debug
- Hiding or showing asynchronous code and library code from your callstack as needed
- Adding specialized breakpoints for XmlHttpRequests, events and DOM mutations
There are three ways to begin a debugging session.
- Set a breakpoint. When the execution of your code reaches it, you'll enter the debugger and be able to step through your code.
- Initiate a break in code. Click the Break (pause icon) toolbar button or
Ctrl+Shift+B. The debugger will break on the next statement of execution. - Set exception behavior. Use the Change exception behavior menu (
Ctrl+Shift+E) to break into the debugger when your code throws an exception. By default, the debugger is set to Never break on exceptions, but they are logged to the console.
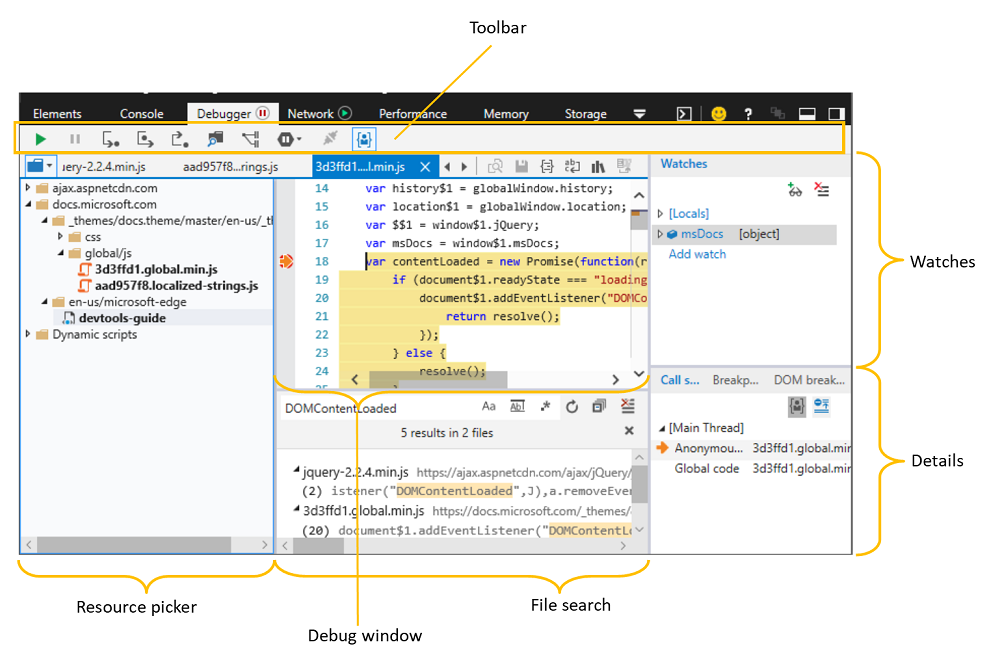
Resource picker
Often the first step in debugging is to set breakpoints in the code you're looking to troubleshoot. You can find all the code files currently loaded by the page from the Resource picker pane, including .html, .css and .js files.
Clicking on a file entry will open a tab for that file in the Debug window and bold the text of the file name to indicate this (as devtools-guide file name is in the illustration above). You can then set breakpoints within that file from the Debug window.
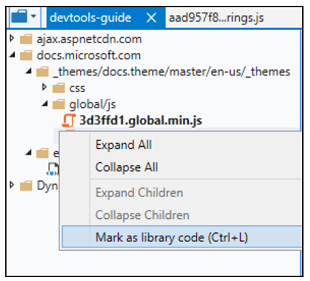
From the Resource picker context menu, you can also mark a file as library code (Ctrl+L), giving you the option to skip over that code in the debugger and hide it from the Call stack pane. Clicking (or Ctrl+L) again will toggle the file back to its previous value as my code or library code.
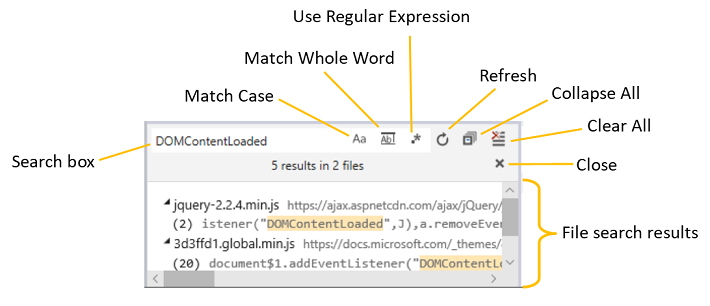
File search
Use the Find in files command (Ctrl+Shift+F) when you have a specific string of code you're trying to find in the source. The toolbar provides different search options, including regular expressions. Clicking on a search result will focus the Debug window on the specified file and line.
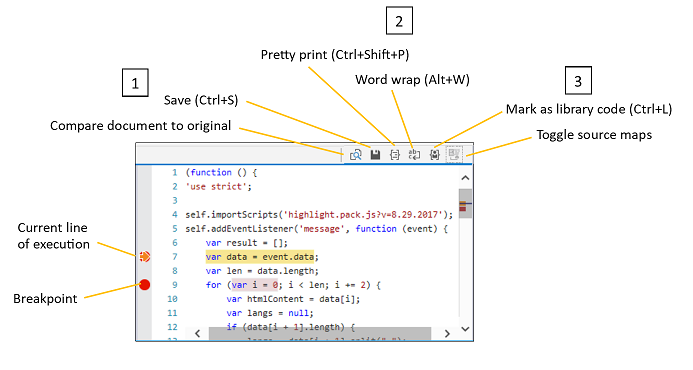
Debug window
The Debug window is where you set your breakpoints, step through code, and live edit your script as you debug. Click to the left of any script command to add (or remove) a Breakpoint. Use the right-click context menu or Breakpoints pane to Add a condition to the breakpoint by supplying a logical expression that causes the debugger to break if it evaluates True at that location.
Other features of the debug window include controls for:
1. Code editing
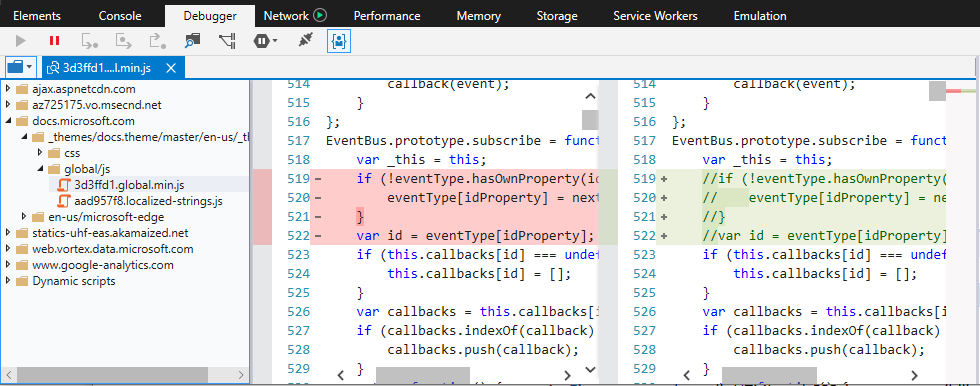
You can edit your JavaScript live during a debugging session. Once you make your changes, click Save (Ctrl+S) to test your changes next time that section of code runs. If you have unsaved code changes, an asterisk (*) will appear before the file name in the Debug window tab.
Click the Compare document to original button to view the diff of what you changed.
Please be aware of the following constraints:
- Script editing only works in external .js files (and not embedded
<script>within .html) - Edits are saved in memory and flushed when the document is reloaded, thus you won't be able to run edits inside a
DOMContentLoadedhandler, for example - Currently there's no way (such as a Save As option) to save your edits to disk from the DevTools
2. Code formatting
Use these controls to format minified code for better readability as you debug:
Pretty print (Ctrl+Shift+P)
Adds line breaks and curly brace alignment per JavaScript conventions. Even compressed code that's been made more readable with this option may have function, selector, and variable names that are much different than in your original source code. In these cases, the Toggle source maps option might be available.
Word wrap (Alt+W)
Adjusts code to fit within the current margins of the debug window (eliminating the need for horizontal scrolling).
3. Code scoping
You can direct the debugger to ignore certain files with the Mark as library code (Ctrl+L) button. By default, the Debug just my code toolbar button is on, meaning that the debugger will skip over any files that you mark as library code and they will not appear in the debugger call stack. Depressing the button (Mark as my code, Ctrl+L) will remove this flag.
For keeping track of libraries across debugging sessions, you can edit these files to maintain a default list or add wildcards for a domain or file type:
%APPDATA%\..\LocalLow\Microsoft\F12\header\MyCode.json and %APPDATA%\..\Local\Microsoft\F12\header\MyCode.json
Source maps
You will see the Toggle source maps button enabled for code written in a language that compiles to JavaScript or CSS and that provides a source map (an intermediate file mapping to the original source). This option directs the debugger to present the original source to use for debugging (rather than the compiled file that's actually running in the browser).
The DevTools will check if the compiler that generated the JavaScript file included a comment with the name of the map file. For example, if a compiler compressed myfile.js to myfile.min.js, it might also generate a map file, myfile.min.js.map and include a comment in the compressed file like this:
//# sourceMappingURL=myfile.min.js.map
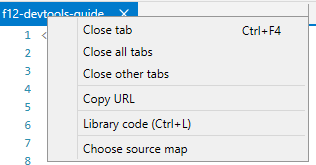
If the DevTools can't find the map automatically, you can choose a source map for that file. Right-click the file's tab to find the Choose source map option.
Toolbar
Use the debugger Toolbar to control how you step through code, and what code to step through or ignore. From here you can also do a full text search across your code files for specific strings.
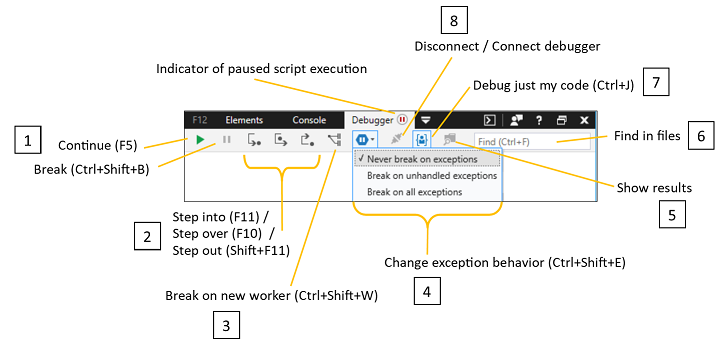
1. Continue (F5) / Break (Ctrl+Shift+B)
Continue (F5) continues code execution to the next breakpoint. Holding down F5 will repeatedly move past breaks until you release it.
Break (Ctrl+Shift+B) will break into the debugger after running the next statement.
2. Step functions (F11, Ctrl+F10, Shift+F11)
Step into (F11) steps into the function being called.
Step over (Ctrl+F10) steps over the function being called.
Step out (Shift+F11) steps out of the current function and into the calling function.
The debugger will step to the next statement if it is not at a function when these commands are used.
3. Break on new worker (Ctrl+Shift+W)
Breaks on the creation of a new web worker.
4. Exception control
Change exception behavior (Ctrl+Shift+E) opens options to change how the debugger reacts to exceptions. By default exceptions are ignored by the debugger and logged to the Console. You can choose to Break on all exceptions, or just those not being handled by try...catch statements in your code (Break on unhandled exceptions).
5. View search results
(Currently disabled.) Show/Hide results toggles the display of Find in files search results.
6. Find in files (Ctrl+F)
Find in files (Ctrl+F) runs a text search through all the loaded files within the Resource picker. If the text is found, it opens the first file matching the search string. Pressing Enter or F3 takes you to the next match.
7. Debug just my code (Ctrl+J)
Debug just my code (Ctrl+J) acts as a toggle to include or exclude all the files that have been marked as library code as you step through the debugger.
8. Debugger connection
Disconnect/Connect debugger is essentially the on/off switch for the debugger.
Watches
Use the Watches pane to browse a catalog of all objects and variables (Locals), both in the local and global scope, available to the statement that is the focus of the current break in the debugger.
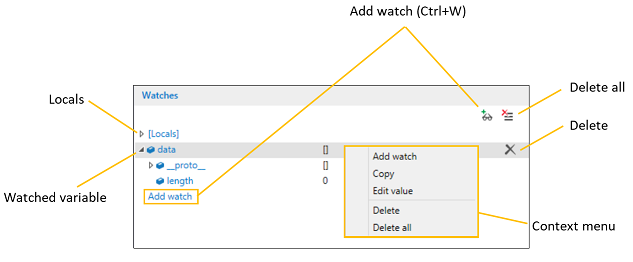
You can track the value of specific variables as they pass in and out of scope by adding a watch (Add watch, Ctrl+W) and modify any editable values by double-clicking on it or by selecting Edit value from the Context menu. Clear your watches using the Delete (Ctrl+D) / Delete all buttons or from the context menu.
Details
The Details pane includes the Callstack, Breakpoints and DOM breakpoints tabs.
Call stack
The Call stack tab shows the chain of functions that led to the current point of execution. The current function appears at the top, and the calling functions appear below it in reverse order.
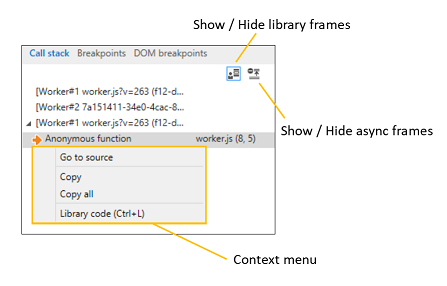
The Show/Hide library frames button (Ctrl+Shift+J) toggles the output of library code from the call stack. Use the Library code option (Ctrl+L) from the right-click Context menu to mark (or unmark) the source of the selected frame as library code.
The Show/Hide async frames button toggles the display of roots for asynchronous function calls.
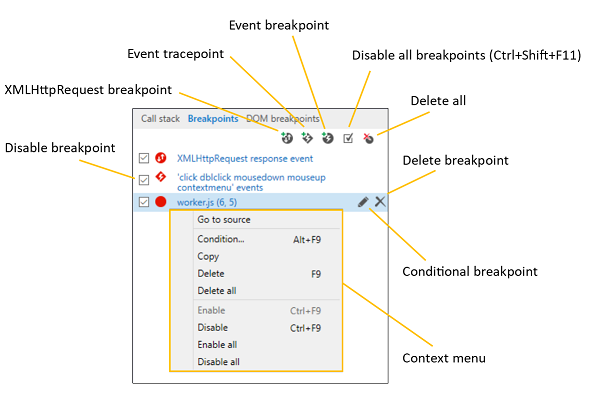
Breakpoints
From the Breakpoints tab, you can manage you breakpoints and event tracepoints, including setting conditions, disabling and deleting them.
Here's a summary of the different types of breakpoints you can use for debugging.
| Breakpoint type | Description | How to set it |
|---|---|---|
| Breakpoint | Breaks into the debugger just before the specified line of code is executed. Regular breakpoints are easiest to set if you have one statement per line. | From the Debug window, click in the left margin next to any line number in the code. A red dot appears and the breakpoint is set. You can jump into the source of any breakpoint by clicking on its blue text. |
| Conditional breakpoint | Breaks if the specified condition evaluates to true. This is essentially an if(condition) for breaking into the debugger. |
From the Breakpoints tab, hover over an existing breakpoint and click the "pencil" button (Add a condition to this breakpoint), right-click an existing breakpoint and select Condition... from the context menu. Specify the "if" condition to be evaluated at the breakpoint location. |
| XMLHttpRequest breakpoint (w/optional condition) | Breaks whenever a XMLHttpRequest (XHR) request has been fulfilled. You can inspect the XHR response object from the Watches pane. |
From the Breakpoints tab, click the XMLHttpRequest breakpoint button (circle with up/down arrows). You can turn it into a Conditional breakpoint as described above. |
| Event tracepoint | Calls console.log() with a specified string in response to a specific event. Use this for temporary console logging statements that you don't want to save directly in your event handler code. |
From the Breakpoints tab, click the Event tracepoint button (diamond with lightning bolt). Select an Event type for the trigger and a Trace statement for logging. |
| Event breakpoint (w/optional condition) | Breaks whenever a specified event is fired. | From the Breakpoints tab, click the Event breakpoint button (circle with lightning bolt). Select an Event type for the trigger and optionally, specify a Condition statement. |
| DOM breakpoint | Breaks whenever a specified element on the page is mutated, such as when its subtree is modified, its attributes change, or when it is detached from the DOM. | From the Elements tab, right-click on a source element and select from the DOM Breakpoints options. Use the DOM breakpoints tab in either the Debugger or Elements panels to manage your breakpoints. |
Conditional breakpoints and tracepoints have access to all the local and global variables currently in scope when they break into the debugger.
DOM breakpoints
Manage your DOM mutation breakpoints from the DOM breakpoints tab, including disabling, deleting and rebinding them. DOM breakpoints can be set from the HTML tree view in the Elements panel.
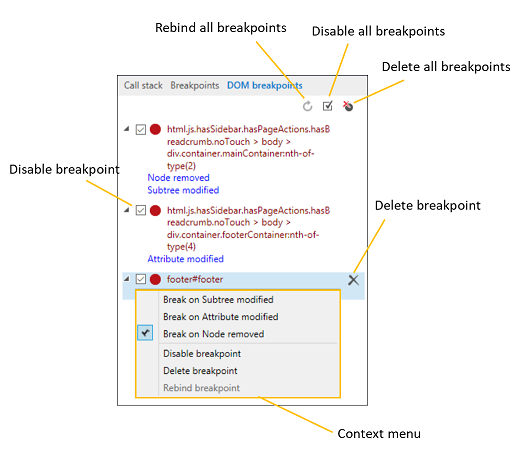
The DOM breakpoints tab in the Debugger provides equivalent functionality to the DOM breakpoints* tab on the Elements panel.
Here's more on the different types of DOM breakpoints.
Shortcuts
Toolbar shortcuts
| Action | Shortcut |
|---|---|
| Find | Ctrl + F |
| Continue (from breakpoint) | F5 or F8 |
| Fast continue | Hold F5 or F8 |
| Continue and refresh | Ctrl + Shift + F5 |
| Break | Ctrl + Shift + B |
| Step into | F11 |
| Step over | F10 |
| Step out | Shift + F11 |
| Break on new worker | Ctrl + Shift + W |
| Change exception behavior (opens menu) | Ctrl + Shift + E |
| Debug just my code | Ctrl + J |
Resource picker shortcuts
| Action | Shortcut |
|---|---|
| Mark as my code / library code | Ctrl + L |
| Open file | Ctrl + O, Ctrl + P |
| Search all files | Ctrl + Shift + F |
Debug window shortcuts
| Action | Shortcut |
|---|---|
| Remove breakpoint | F9 |
| Disable breakpoint | Ctrl + F9 |
| Conditional breakpoint... | Alt + F9 |
| Copy | Ctrl + C |
| Save | Ctrl + S |
| Go to line... | Ctrl + G |
| Show next statement | Alt + Num + * |
| Run to cursor | Ctrl + F10 |
| Set next statement | Ctrl + Shift + F10 |
| Show in file picker | Ctrl + Alt + P |
| Go to definition in file | Ctrl+D |
| Find references in file | Ctrl + Shift + D |
| Pretty print | Ctrl + Shift + P |
| Word wrap | Alt + W |
| Mark as my code/library code | Ctrl + L |
| Disable/Enable tabs in the editor. Note: if you're using the keyboard to navigate in the Debugger, you won't be able to tab out of the editor until you disable tabbing | Ctrl + M |
Shortcuts for Watches pane
| Action | Shortcut |
|---|---|
| Add watch | Ctrl + W |
| Delete watch | Ctrl + D |
Shortcuts for Details pane
| Action | Shortcut |
|---|---|
| Show/Hide frames from library code | Ctrl + Shift + J |
| Enable all breakpoints | Ctrl + Shift + F11 |