指标是一段时间内报告的数字度量值。 它们通常用于监视应用的运行状况并生成警报。 例如,Web 服务可能会跟踪以下数量:
- 每秒接收的请求数。
- 响应所花费的毫秒数。
- 响应发送了错误。
可以定期向监视系统报告这些指标。 仪表板可以设置为查看创建的指标和警报,以通知用户出现问题。 如果 Web 服务打算在 400 毫秒内响应请求,并在 600 毫秒后开始响应,则监视系统可以通知操作人员应用响应速度比平时慢。
有关所有工具及其属性的全面的列表,请参阅《ASP.NET Core 指标》。
使用指标
使用指标涉及以下内容:
- 检测:.NET 库中的代码采用度量值,并将这些度量值与指标名称关联起来。 .NET 和 ASP.NET Core 包括许多内置指标。
- 收集和存储:由一个 .NET 应用来配置要从应用传输的命名指标以用于外部存储和分析。 某些工具可能会使用配置文件或 UI 工具在应用外部执行配置。
- 可视化:一种可以以人类可读的格式显示指标的工具。 例如 Grafana 和 Prometheus。
- 警报:一个当指标超过阈值时提供通知的工具。 例如,如果 Web 服务的平均响应时间超过 400 毫秒,则可以向操作人员发送警报。
- 分析:一个可以分析一段时间内的指标的工具。 这通常是一个基于 Web 的仪表板,可以自定义此仪表板以显示特定应用的最重要指标。
检测的代码可以记录数值度量值,但需要聚合、传输和存储度量值,以创建用于监视的有用指标。 聚合、传输和存储数据的过程称为集合。 本教程展示了收集和显示指标的几个示例:
- 使用 OpenTelemetry 和 Prometheus 在 Grafana 中填充指标。
- 使用
dotnet-counters实时查看指标
度量值还可以与被称为标记的键值对相关联,从而能对数据进行分类以进行分析。 有关详细信息,请参阅多维指标。
创建初学者应用
使用以下命令创建新的 ASP.NET Core 应用:
dotnet new web -o WebMetric
cd WebMetric
dotnet add package OpenTelemetry.Exporter.Prometheus.AspNetCore --prerelease
dotnet add package OpenTelemetry.Extensions.Hosting
将 Program.cs 的内容替换为以下代码:
using OpenTelemetry.Metrics;

var builder = WebApplication.CreateBuilder(args);
builder.Services.AddOpenTelemetry()
    .WithMetrics(builder =>
    {
        builder.AddPrometheusExporter();

        builder.AddMeter("Microsoft.AspNetCore.Hosting",
                         "Microsoft.AspNetCore.Server.Kestrel");
        builder.AddView("http.server.request.duration",
            new ExplicitBucketHistogramConfiguration
            {
                Boundaries = new double[] { 0, 0.005, 0.01, 0.025, 0.05,
                       0.075, 0.1, 0.25, 0.5, 0.75, 1, 2.5, 5, 7.5, 10 }
            });
    });
var app = builder.Build();

app.MapPrometheusScrapingEndpoint();

app.MapGet("/", () => "Hello OpenTelemetry! ticks:"
                     + DateTime.Now.Ticks.ToString()[^3..]);

app.Run();
使用 dotnet-counters 查看指标
dotnet-counters 是一个命令行工具,可按需查看任何 .NET Core 应用的实时指标。 它不需要设置,因此可用于临时调查或验证指标检测是否正常工作。 它与基于 System.Diagnostics.Metrics 的 API 和 EventCounters 配合运作。
如果未安装 dotnet-counters 工具,请运行以下命令:
dotnet tool update -g dotnet-counters
运行测试应用时,启动 dotnet-counters。 以下命令显示了一个 dotnet-counters 示例,它监视来自 Microsoft.AspNetCore.Hosting 计量的所有指标。
dotnet-counters monitor -n WebMetric --counters Microsoft.AspNetCore.Hosting
显示了类似下面的输出:
Press p to pause, r to resume, q to quit.
    Status: Running

[Microsoft.AspNetCore.Hosting]
    http-server-current-requests
        host=localhost,method=GET,port=5045,scheme=http                    0
    http-server-request-duration (s)
        host=localhost,method=GET,port=5045,protocol=HTTP/1.1,ro           0.001
        host=localhost,method=GET,port=5045,protocol=HTTP/1.1,ro           0.001
        host=localhost,method=GET,port=5045,protocol=HTTP/1.1,ro           0.001
        host=localhost,method=GET,port=5045,protocol=HTTP/1.1,ro           0
        host=localhost,method=GET,port=5045,protocol=HTTP/1.1,ro           0
        host=localhost,method=GET,port=5045,protocol=HTTP/1.1,ro           0
有关详细信息,请参阅 dotnet-counters。
扩充 ASP.NET 核心请求指标
ASP.NET Core 具有许多内置指标。 http.server.request.duration指标:
- 记录服务器上 HTTP 请求的持续时间。
- 捕获标记中的请求信息,例如匹配的路由和响应状态代码。
http.server.request.duration指标支持使用IHttpMetricsTagsFeature进行标记扩充。 在库或应用将自己的标记添加到指标时进行扩充。 如果应用要向使用指标生成的仪表板或警报添加自定义分类,这非常有用。
using Microsoft.AspNetCore.Http.Features;

var builder = WebApplication.CreateBuilder();
var app = builder.Build();

app.Use(async (context, next) =>
{
    var tagsFeature = context.Features.Get<IHttpMetricsTagsFeature>();
    if (tagsFeature != null)
    {
        var source = context.Request.Query["utm_medium"].ToString() switch
        {
            "" => "none",
            "social" => "social",
            "email" => "email",
            "organic" => "organic",
            _ => "other"
        };
        tagsFeature.Tags.Add(new KeyValuePair<string, object?>("mkt_medium", source));
    }

    await next.Invoke();
});

app.MapGet("/", () => "Hello World!");

app.Run();
继续浏览示例:
- 添加中间件以扩充 ASP.NET 核心请求指标。
- 从
HttpContext中获取IHttpMetricsTagsFeature。 只有当有人正在侦听指标时,该功能才会出现在上下文中。 在使用IHttpMetricsTagsFeature之前,验证它是否不是null。 - 将包含请求的营销源的自定义标记添加到
http.server.request.duration指标。- 该标记具有名称
mkt_medium和基于utm_medium查询字符串值的值。utm_medium值解析为已知值范围。 - 该标记允许按营销媒体类型对请求进行分类,这在分析 Web 应用流量时可能很有用。
- 该标记具有名称
注意
使用自定义标记进行扩充时,请遵循多维指标最佳做法。 如果标记数量过多或范围不受限制,则会产生许多标记组合,从而导致维度过高。 收集工具对计数器的支持维度有限制,并且可能会筛选结果以防止过度使用内存。
选择退出某些终结点和请求的 HTTP 指标
选择不记录指标对自动化系统(例如运行状况检查)经常调用的终结点很有用。 通常不需要记录这些请求的指标。 不必要的遥测数据会占用资源来进行收集和存储,并且会扭曲遥测仪表板上显示的结果。
可以通过添加元数据(使用 DisableHttpMetrics 属性或 DisableHttpMetrics 方法)将对端点的 HTTP 请求排除在指标之外:
- 将 DisableHttpMetrics 属性添加到 Web API 控制器、SignalR 中心或 gRPC 服务。
- 在应用启动过程中映射终结点时调用 DisableHttpMetrics:
var builder = WebApplication.CreateBuilder(args);
builder.Services.AddHealthChecks();

var app = builder.Build();
app.MapHealthChecks("/healthz").DisableHttpMetrics();
app.Run();
另外,已为以下项添加了 IHttpMetricsTagsFeature.MetricsDisabled 属性:
- 请求未映射到终结点的高级场景。
- 对特定 HTTP 请求动态禁用指标收集。
// Middleware that conditionally opts-out HTTP requests.
app.Use(async (context, next) =>
{
    var metricsFeature = context.Features.Get<IHttpMetricsTagsFeature>();
    if (metricsFeature != null &&
        context.Request.Headers.ContainsKey("x-disable-metrics"))
    {
        metricsFeature.MetricsDisabled = true;
    }

    await next(context);
});
创建自定义指标
指标是使用 System.Diagnostics.Metrics 命名空间中的 API 创建的。 有关创建自定义指标的信息,请参阅创建自定义指标。
使用 IMeterFactory 在 ASP.NET Core 应用中创建指标
建议使用 IMeterFactory 在 ASP.NET Core 应用中创建 Meter 实例。
默认情况下,ASP.NET Core 在依赖项注入 (DI) 中注册 IMeterFactory。 计量工厂将指标与 DI 集成,使隔离和收集指标变得简单。 IMeterFactory 对测试非常有用。 它允许多个测试并行运行,并且仅收集测试中记录的指标值。
若要在应用中使用 IMeterFactory,请创建使用 IMeterFactory 创建应用的自定义指标的类型:
public class ContosoMetrics
{
    private readonly Counter<int> _productSoldCounter;

    public ContosoMetrics(IMeterFactory meterFactory)
    {
        var meter = meterFactory.Create("Contoso.Web");
        _productSoldCounter = meter.CreateCounter<int>("contoso.product.sold");
    }

    public void ProductSold(string productName, int quantity)
    {
        _productSoldCounter.Add(quantity,
            new KeyValuePair<string, object?>("contoso.product.name", productName));
    }
}
在 Program.cs 中向 DI 注册指标类型:
var builder = WebApplication.CreateBuilder(args);
builder.Services.AddSingleton<ContosoMetrics>();
根据需要注入指标类型和记录值。 由于指标类型已在 DI 中注册,因此它可以与 MVC 控制器、最小 API 或 DI 创建的任何其他类型一起使用:
app.MapPost("/complete-sale", (SaleModel model, ContosoMetrics metrics) =>
{
    // ... business logic such as saving the sale to a database ...

    metrics.ProductSold(model.ProductName, model.QuantitySold);
});
若要监视“Contoso.Web”计数器,请使用以下 dotnet-counters 命令。
dotnet-counters monitor -n WebMetric --counters Contoso.Web
显示了类似下面的输出:
Press p to pause, r to resume, q to quit.
    Status: Running

[Contoso.Web]
    contoso.product.sold (Count / 1 sec)
        contoso.product.name=Eggs            12
        contoso.product.name=Milk            0
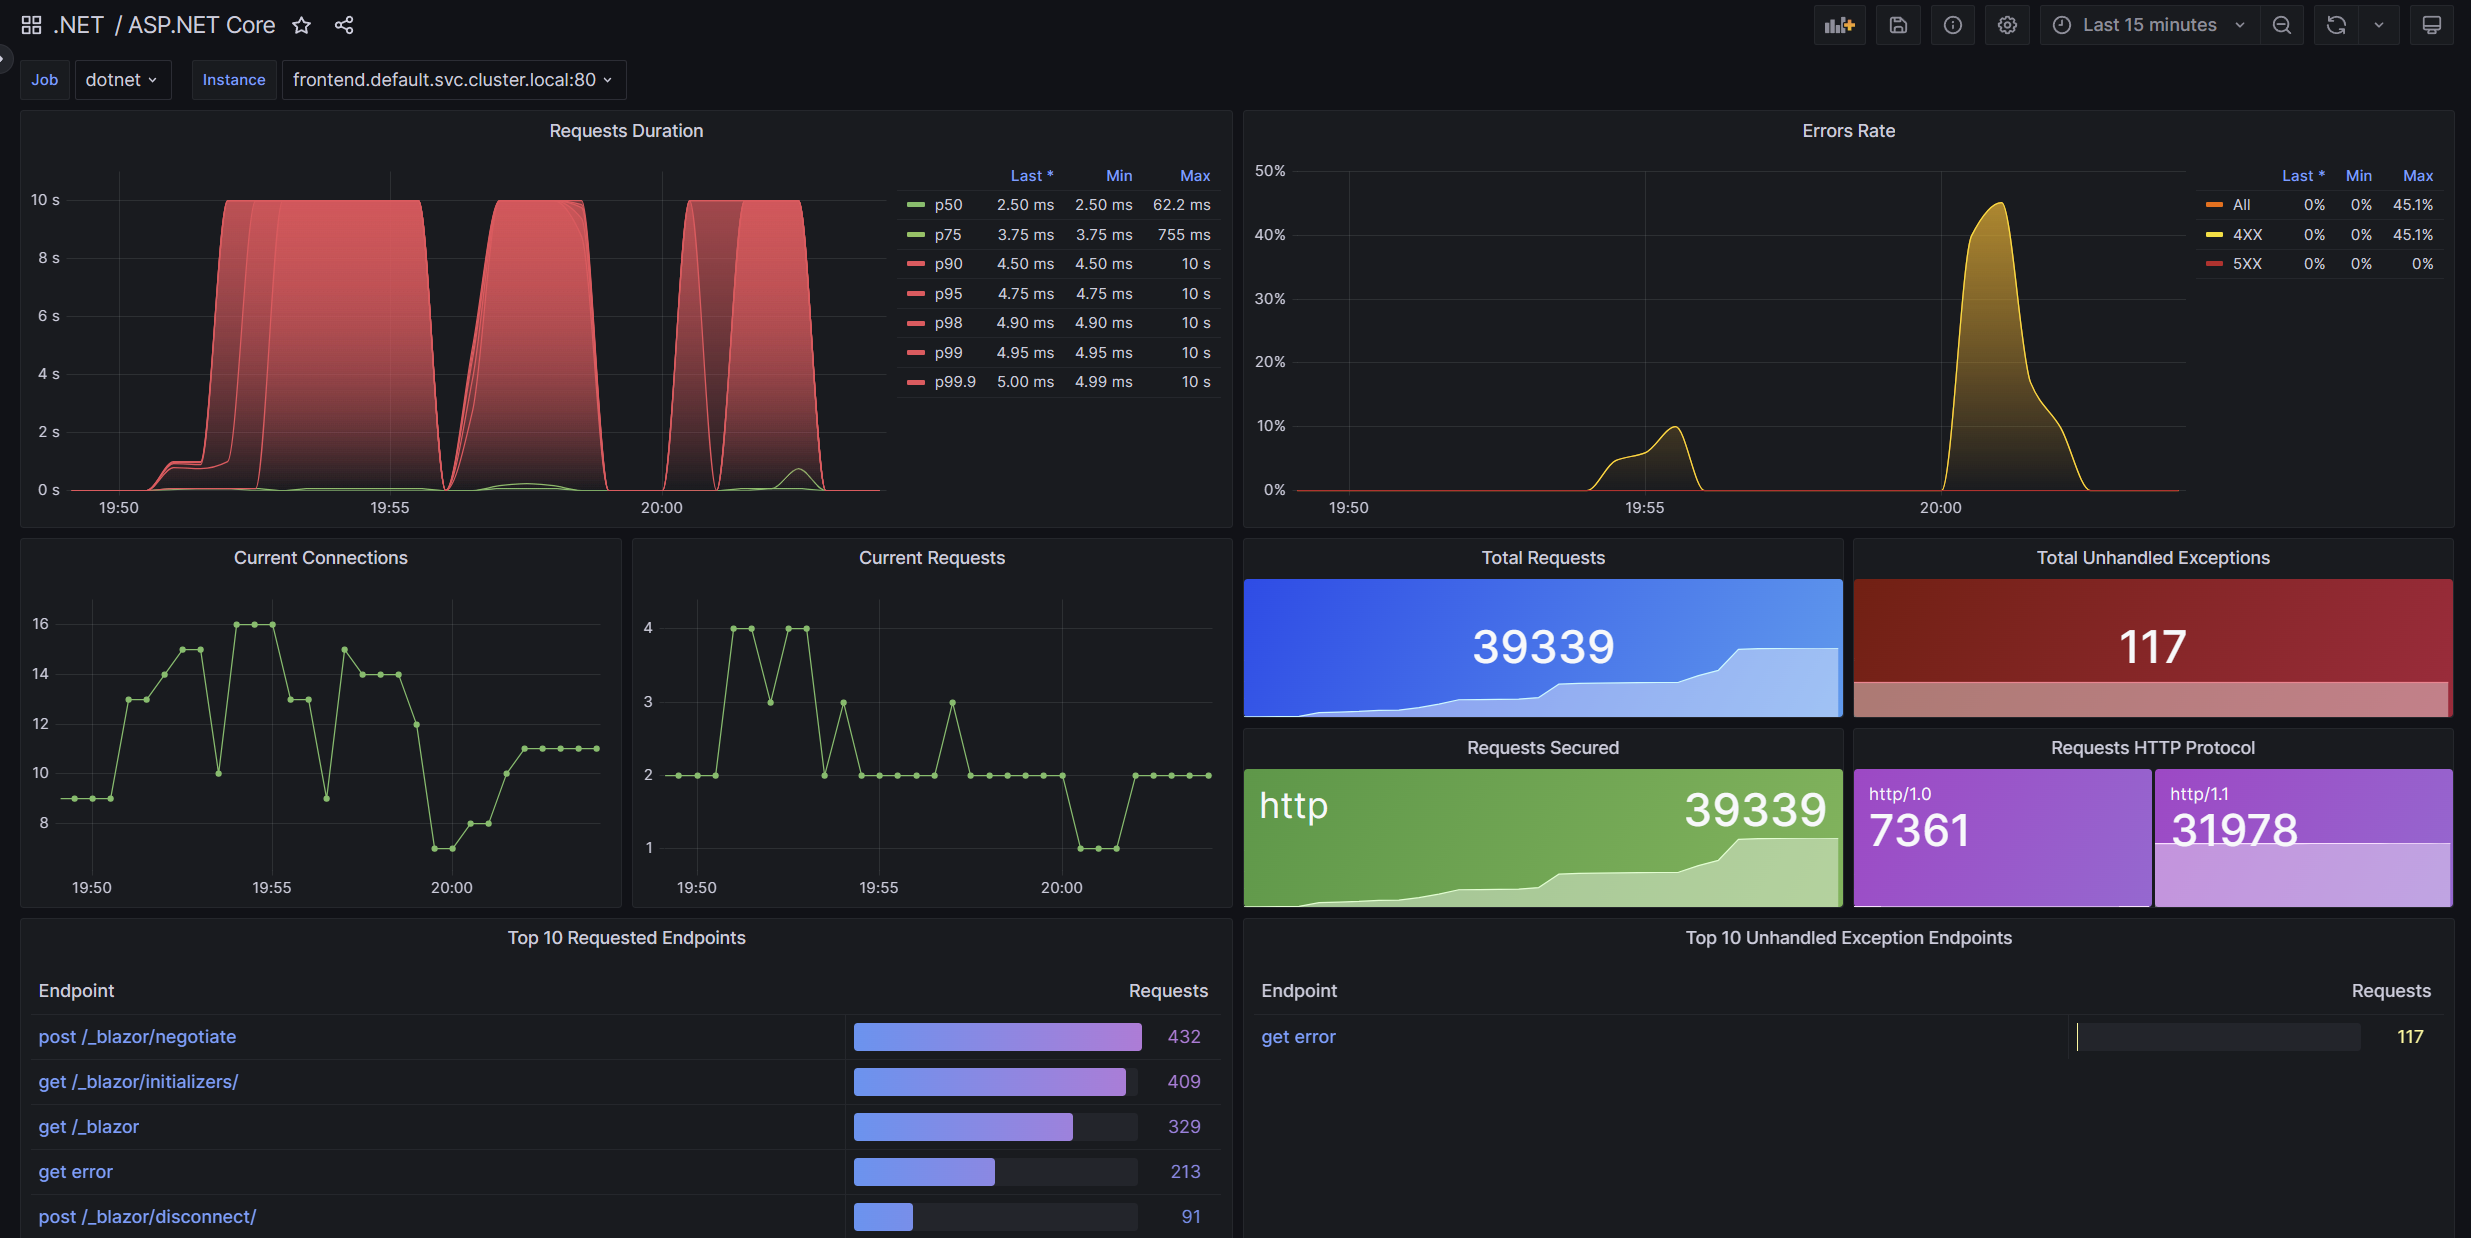
使用 OpenTelemetry 和 Prometheus 查看 Grafana 中的指标
概述
- 是一个由云原生计算基金会支持的供应商中立开源项目。
- 标准化云原生软件的遥测数据生成和收集。
- 使用 .NET 指标 API 与 .NET 配合使用。
- 得到 Azure Monitor 和许多 APM 供应商的认可。
本教程使用 OSS Prometheus 和 Grafana 项目展示了可用于 OpenTelemetry 指标的集成之一。 指标数据流:
ASP.NET Core 指标 API 记录示例应用中的度量值。
在应用中运行的 OpenTelemetry .NET 库将聚合这些度量值。
Prometheus 导出程序库通过 HTTP 指标终结点提供聚合数据。 “导出程序”指的是 OpenTelemetry 调用库来将遥测数据传输到供应商特定的后端。
Prometheus 服务器:
- 轮询指标终结点
- 读取数据
- 将数据存储在数据库中以实现长期持久存储。 Prometheus 将读取和存储数据称为抓取终结点。
- 可以在其他计算机上运行
Grafana 服务器:
- 查询 Prometheus 中存储的数据并将其显示在基于 Web 的监控仪表板上。
- 可以在其他计算机上运行。
查看示例应用中的指标
导航到示例应用。 浏览器显示 Hello OpenTelemetry! ticks:<3digits>,其中 3digits 是当前 DateTime.Ticks 的最后 3 位数字。
将 /metrics 追加到 URL 以查看指标终结点。 浏览器显示正在收集的指标:

设置和配置 Prometheus
按照 Prometheus 起始步骤设置 Prometheus 服务器并确认其正常工作。
修改 prometheus.yml 配置文件,以便 Prometheus 抓取示例应用公开的指标终结点。 在 scrape_configs 部分中添加以下突出显示的文本:
# my global config
global:
  scrape_interval: 15s # Set the scrape interval to every 15 seconds. Default is every 1 minute.
  evaluation_interval: 15s # Evaluate rules every 15 seconds. The default is every 1 minute.
  # scrape_timeout is set to the global default (10s).

# Alertmanager configuration
alerting:
  alertmanagers:
    - static_configs:
        - targets:
          # - alertmanager:9093

# Load rules once and periodically evaluate them according to the global 'evaluation_interval'.
rule_files:
  # - "first_rules.yml"
  # - "second_rules.yml"

# A scrape configuration containing exactly one endpoint to scrape:
# Here it's Prometheus itself.
scrape_configs:
  # The job name is added as a label `job=<job_name>` to any timeseries scraped from this config.
  - job_name: "prometheus"

    # metrics_path defaults to '/metrics'
    # scheme defaults to 'http'.

    static_configs:
      - targets: ["localhost:9090"]

  - job_name: 'MyASPNETApp'
    scrape_interval: 5s # Poll every 5 seconds for a more responsive demo.
    static_configs:
      - targets: ["localhost:5045"]  ## Enter the HTTP port number of the demo app.
在前面突出显示的 YAML 中,将 5045 替换为运行示例应用的端口号。
启动 Prometheus
- 重新加载配置或重启 Prometheus 服务器。
- 确认 OpenTelemetryTest 在 Prometheus Web 门户的状态>目标页中处于 UP 状态。

选择“打开指标资源管理器”图标以查看可用的指标:

在“表达式”输入框中输入计数器类别(例如 http_)以查看可用指标:

或者,在“表达式”输入框中输入计数器类别(例如 kestrel)以查看可用指标:

在 Grafana 仪表板上显示指标
按照安装说明安装 Grafana,并将其连接到 Prometheus 数据源。
按照创建 Prometheus 图进行操作。 或者,可在 .NET 团队仪表板 @ grafana.com 下载适用于 .NET 指标的预生成仪表板。 下载的仪表板 JSON 可以导入到 Grafana 中。
在 ASP.NET Core 应用中测试指标
可以在 ASP.NET Core 应用中测试指标。 执行此操作的一种方法是使用 MetricCollector<T> 在 ASP.NET Core 集成测试中收集和断言指标值。
public class BasicTests : IClassFixture<WebApplicationFactory<Program>>
{
    private readonly WebApplicationFactory<Program> _factory;
    public BasicTests(WebApplicationFactory<Program> factory) => _factory = factory;

    [Fact]
    public async Task Get_RequestCounterIncreased()
    {
        // Arrange
        var client = _factory.CreateClient();
        var meterFactory = _factory.Services.GetRequiredService<IMeterFactory>();
        var collector = new MetricCollector<double>(meterFactory,
            "Microsoft.AspNetCore.Hosting", "http.server.request.duration");

        // Act
        var response = await client.GetAsync("/");

        // Assert
        Assert.Contains("Hello OpenTelemetry!", await response.Content.ReadAsStringAsync());

        await collector.WaitForMeasurementsAsync(minCount: 1).WaitAsync(TimeSpan.FromSeconds(5));
        Assert.Collection(collector.GetMeasurementSnapshot(),
            measurement =>
            {
                Assert.Equal("http", measurement.Tags["url.scheme"]);
                Assert.Equal("GET", measurement.Tags["http.request.method"]);
                Assert.Equal("/", measurement.Tags["http.route"]);
            });
    }
}
后续测试:
- 使用 WebApplicationFactory<TEntryPoint> 在内存中启动 Web 应用。 工厂泛型参数中的
Program将指定 Web 应用。 - 使用 MetricCollector<T> 收集指标值
- 需要对
Microsoft.Extensions.Diagnostics.Testing进行包引用 MetricCollector<T>是使用 Web 应用的 IMeterFactory 创建的。 这允许收集器仅报告测试记录的指标值。- 包括要收集的计量名称
Microsoft.AspNetCore.Hosting和计数器名称http.server.request.duration。
- 需要对
- 向 Web 应用发出 HTTP 请求。
- 使用指标收集器的结果断言测试结果。
ASP.NET Core 计量和计数器
有关 ASP.NET Core 计量和计数器的列表,请参阅《ASP.NET Core 指标》。