你当前正在访问 Microsoft Azure Global Edition 技术文档网站。 如果需要访问由世纪互联运营的 Microsoft Azure 中国技术文档网站,请访问 https://docs.azure.cn。
应用程序路由加载项中的 ingress-nginx 控制器公开了请求、nginx 进程和控制器的许多指标,这些指标有助于分析应用程序的性能和使用情况。
应用程序路由加载项公开了端口 10254 的 /metrics 的 Prometheus 指标终结点,以及一个专用服务 nginx-metrics。
Prerequisites
- 启用应用程序路由加载项的 Azure Kubernetes 服务 (AKS) 群集。
- 一个 Prometheus 实例,例如适用于 Prometheus 的 Azure Monitor 托管服务。
验证指标终结点
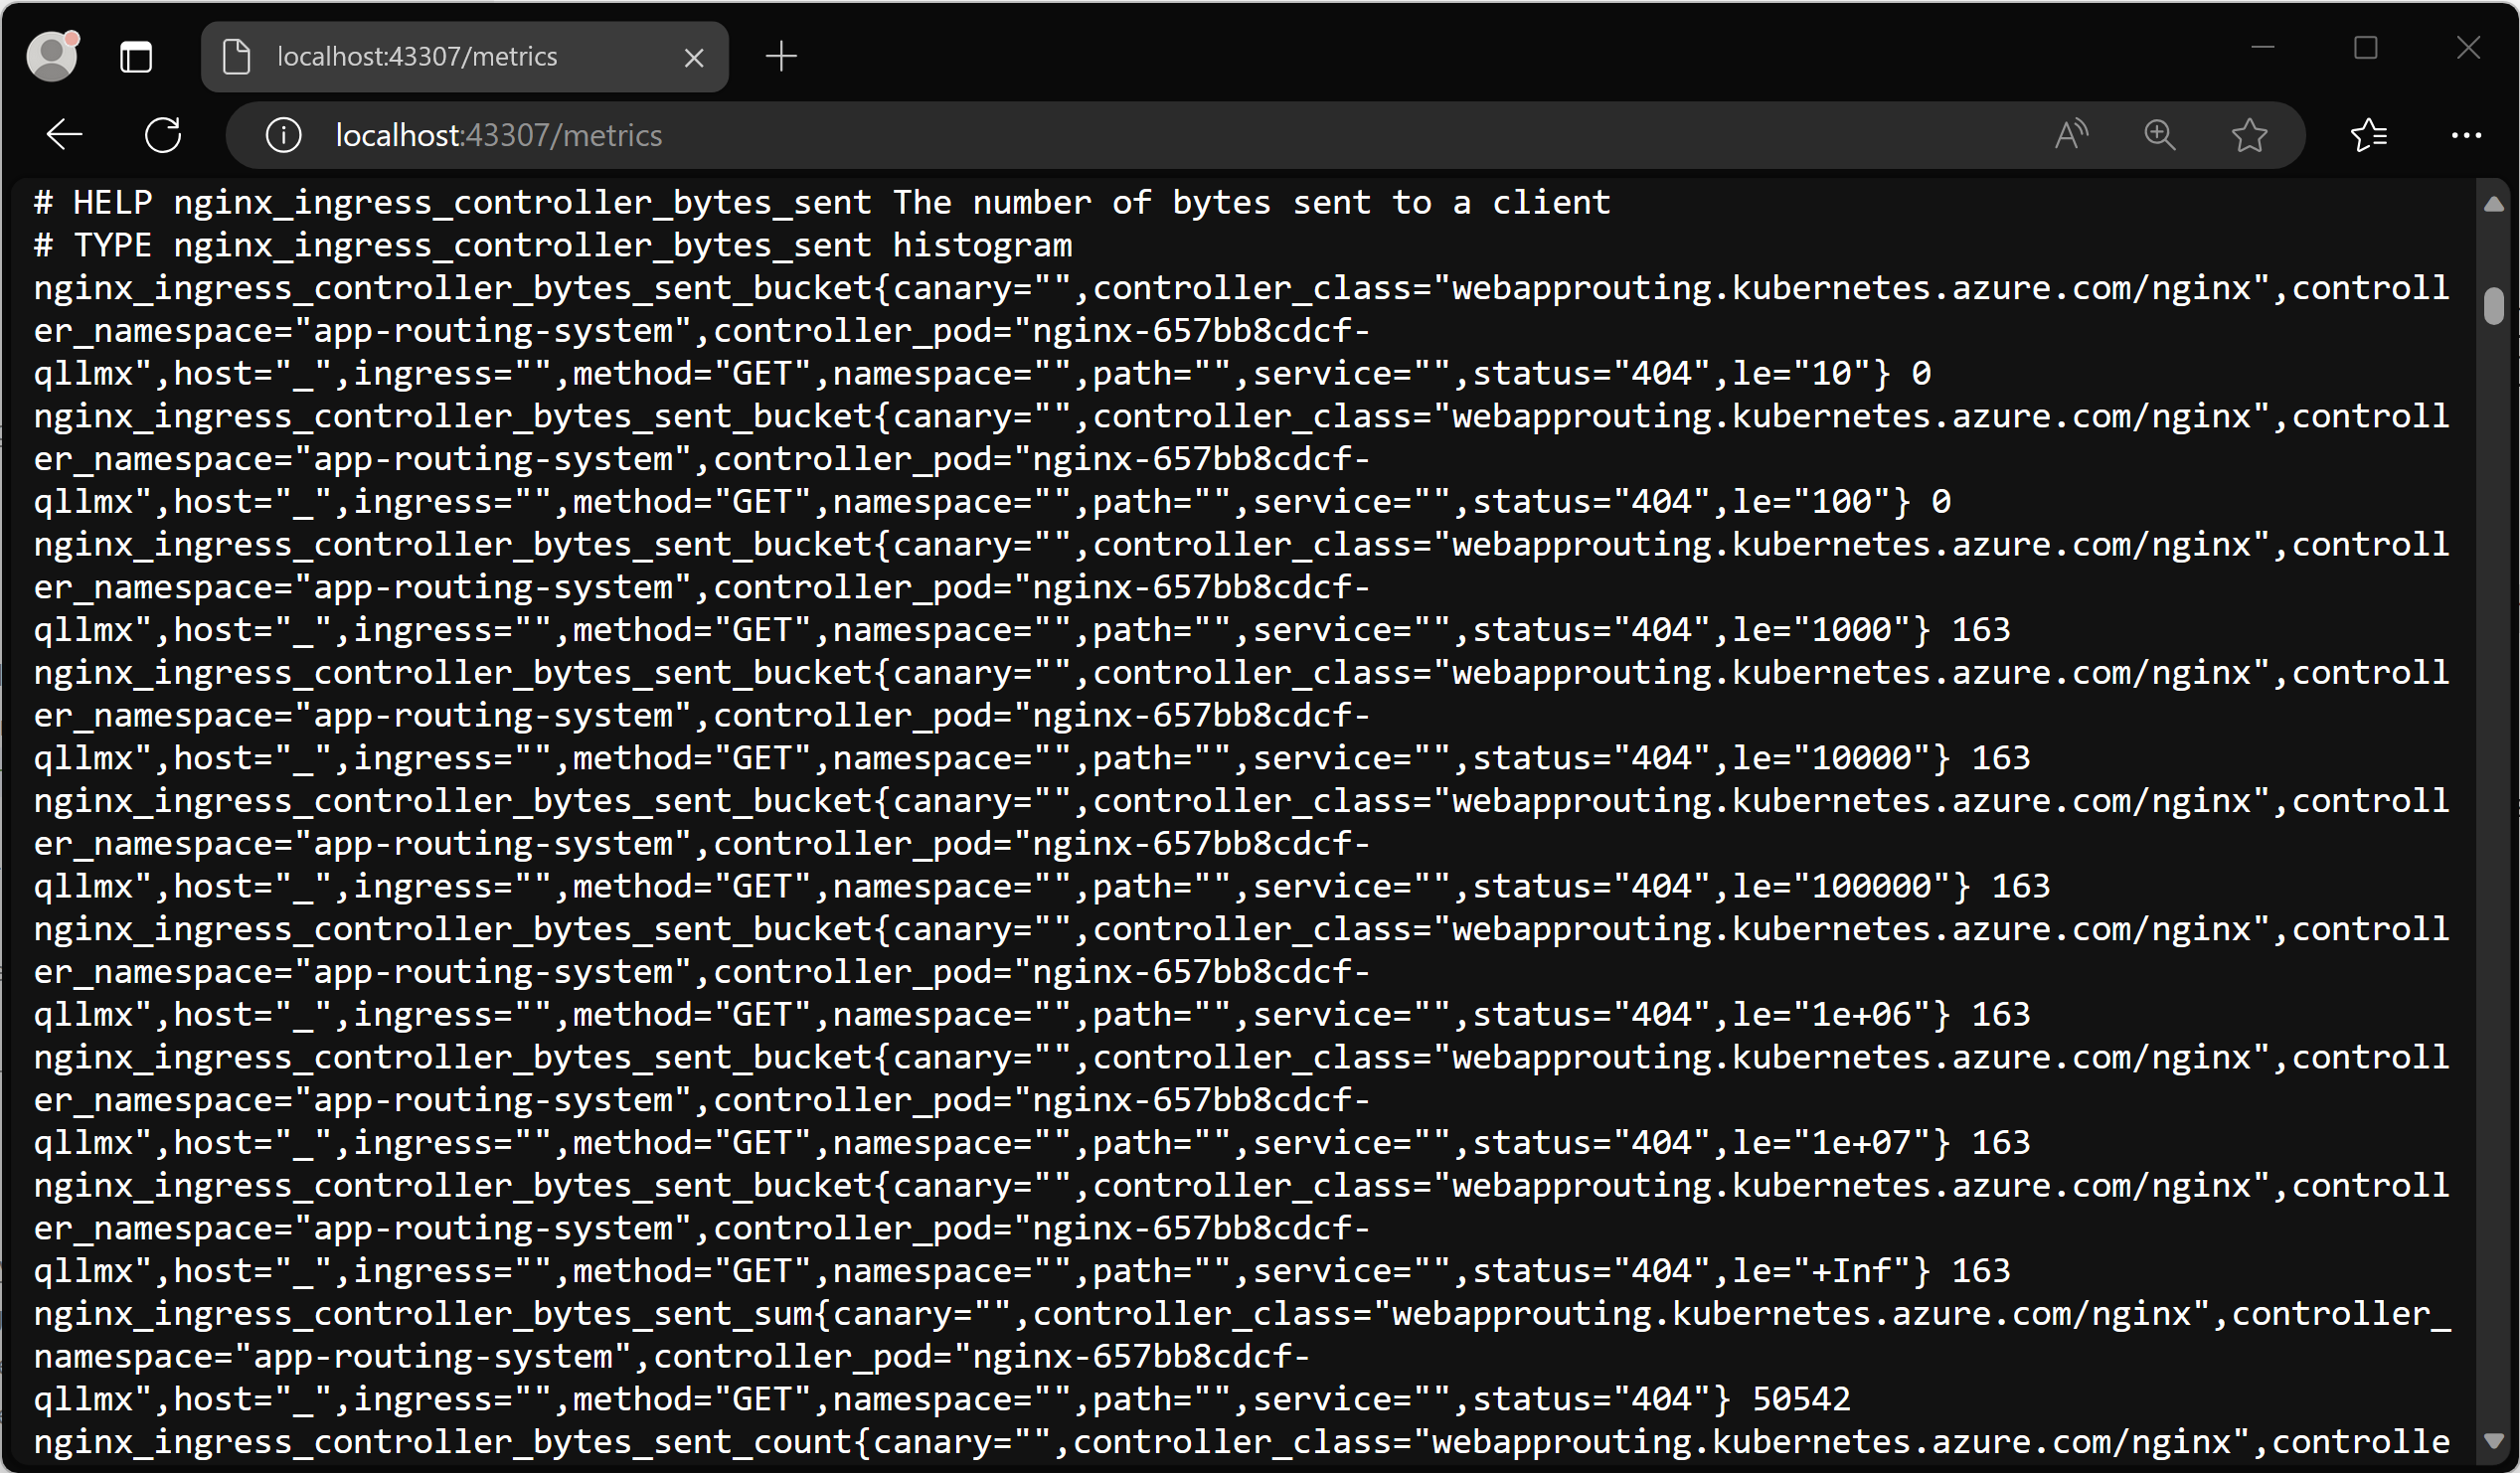
若要验证正在收集的指标,可以在 nginx-metrics 服务上设置从本地端口到端口 10254 的端口转发。
kubectl port-forward -n app-routing-system service/nginx-metrics :10254
Forwarding from 127.0.0.1:43307 -> 10254
Forwarding from [::1]:43307 -> 10254
记下本地端口(本例中为 43307)并在浏览器中打开 http://localhost:43307/metrics。 应会显示 ingress-nginx 控制器指标正在加载。
现在可以终止 port-forward 进程以关闭转发。
为 Prometheus 配置 Azure Monitor 托管服务
适用于 Prometheus 的 Azure Monitor 托管服务是一项完全托管的 Prometheus 兼容服务,该服务支持行业标准功能,例如 PromQL、Grafana 仪表板和 Prometheus 警报。 此服务需要为 Azure Monitor 代理配置指标加载项,从而将数据发送到 Prometheus。 如果未使用加载项配置群集,可以按照本文配置 Azure Kubernetes 服务(AKS)群集,将数据发送到适用于 Prometheus 的 Azure Monitor 托管服务。
启用基于服务监视器的抓取
使用 Azure Monitor 代理更新群集后,需要将代理配置为启用擦除指标终结点。 可以 创建 Pod 或服务监视器 来完成此作。
下面创建一个服务监视器来抓取通过应用程序路由加载项部署的 ingress-nginx 控制器的指标。
kubectl apply -f - <<EOF
apiVersion: azmonitoring.coreos.com/v1
kind: ServiceMonitor
metadata:
  name: nginx-monitor
  namespace: app-routing-system
spec:
  labelLimit: 63
  labelNameLengthLimit: 511
  labelValueLengthLimit: 1023
  selector:
    matchLabels:
      app.kubernetes.io/component: ingress-controller
      app.kubernetes.io/managed-by: aks-app-routing-operator
      app.kubernetes.io/name: nginx
  endpoints:
  - port: prometheus
EOF
几分钟后,ama-metrics 命名空间中的 kube-system Pod 应会重启并选取新配置。
查看 Azure 托管 Grafana 中指标的可视化效果
配置了适用于 Prometheus 的 Azure Monitor 托管服务和 Azure 托管 Grafana 后,应访问托管 Grafana 实例。
你可以下载两个官方 ingress-nginx 仪表板并将其导入到 Grafana 实例中:
- Ingress-nginx 控制器仪表板
- 请求处理性能仪表板
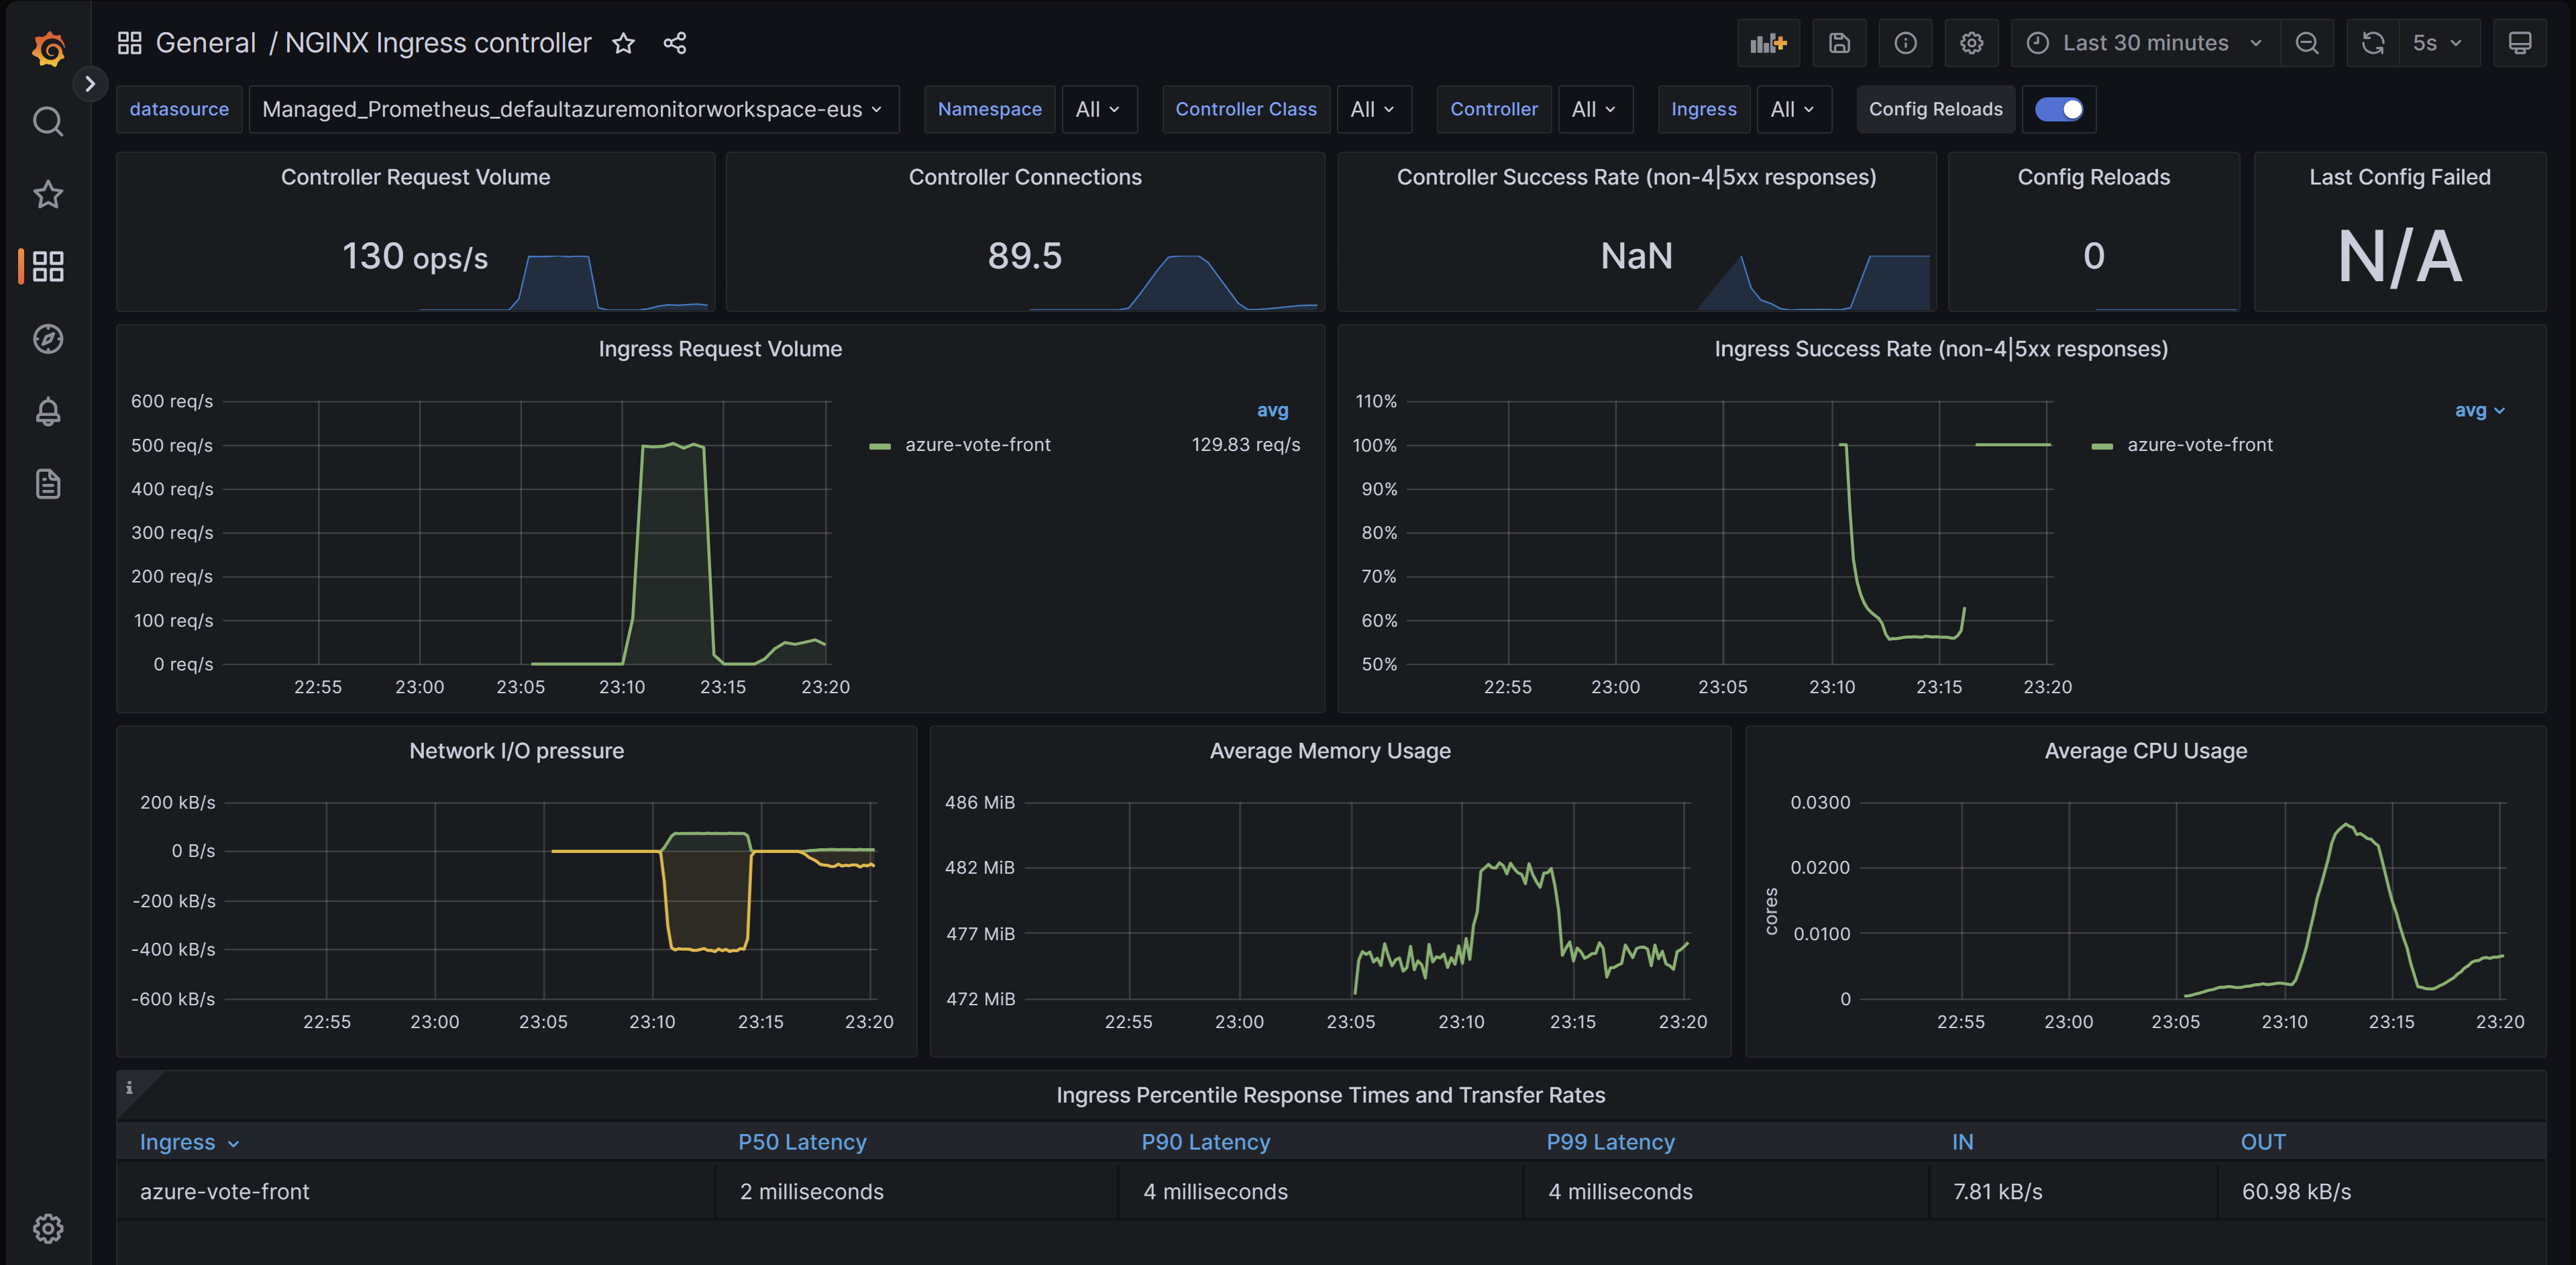
Ingress-nginx 控制器仪表板
使用此仪表板可以查看请求量、连接、成功率、配置重载和配置不同步。还可以用于查看入口控制器的网络 IO 压力、内存和 CPU 使用情况。 最后,此仪表板还显示入口的 P50、P95 和 P99 百分位数响应时间及其吞吐量。
你可以从 GitHub 下载此仪表板。
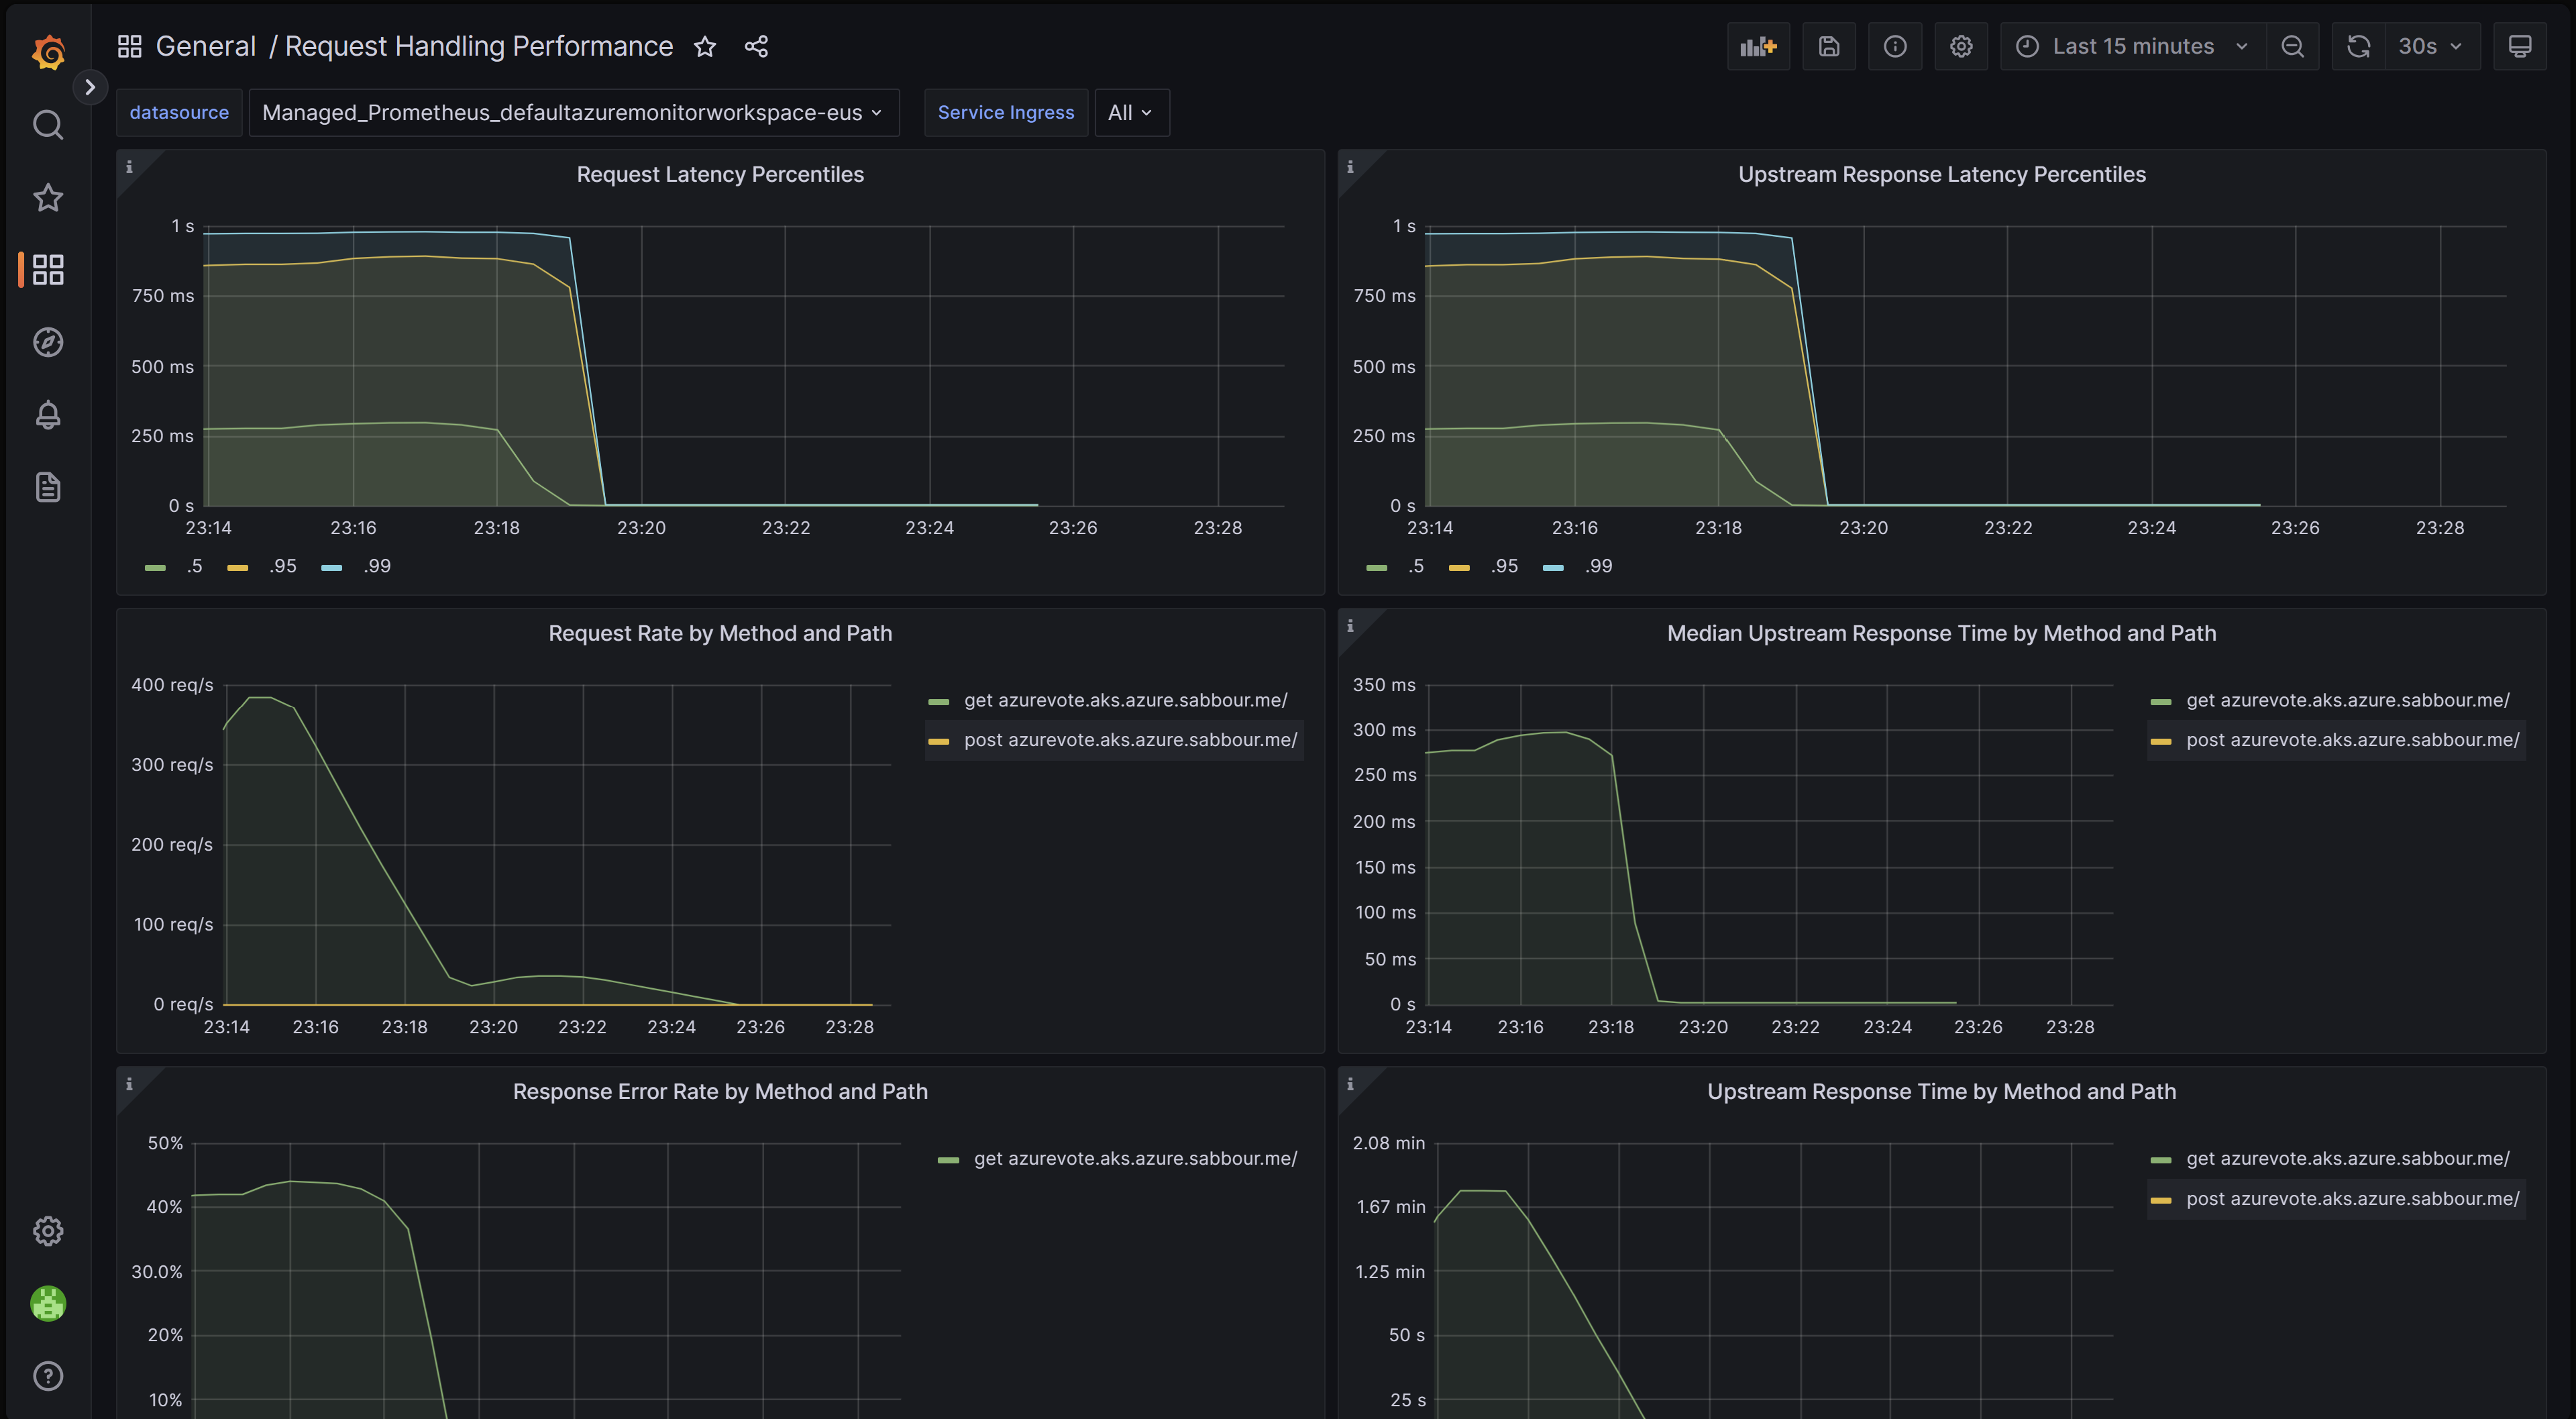
请求处理性能仪表板
借助此仪表板,可以了解不同入口上游目标的请求处理性能,这些目标是入口控制器将流量转发到的应用程序终结点。 仪表板显示全部请求的 P50、P95 和 P99 百分位数及上游响应时间。 你还可以查看请求错误和延迟的聚合。 使用此仪表板查看和改进应用程序的性能和可伸缩性。
你可以从 GitHub 下载此仪表板。
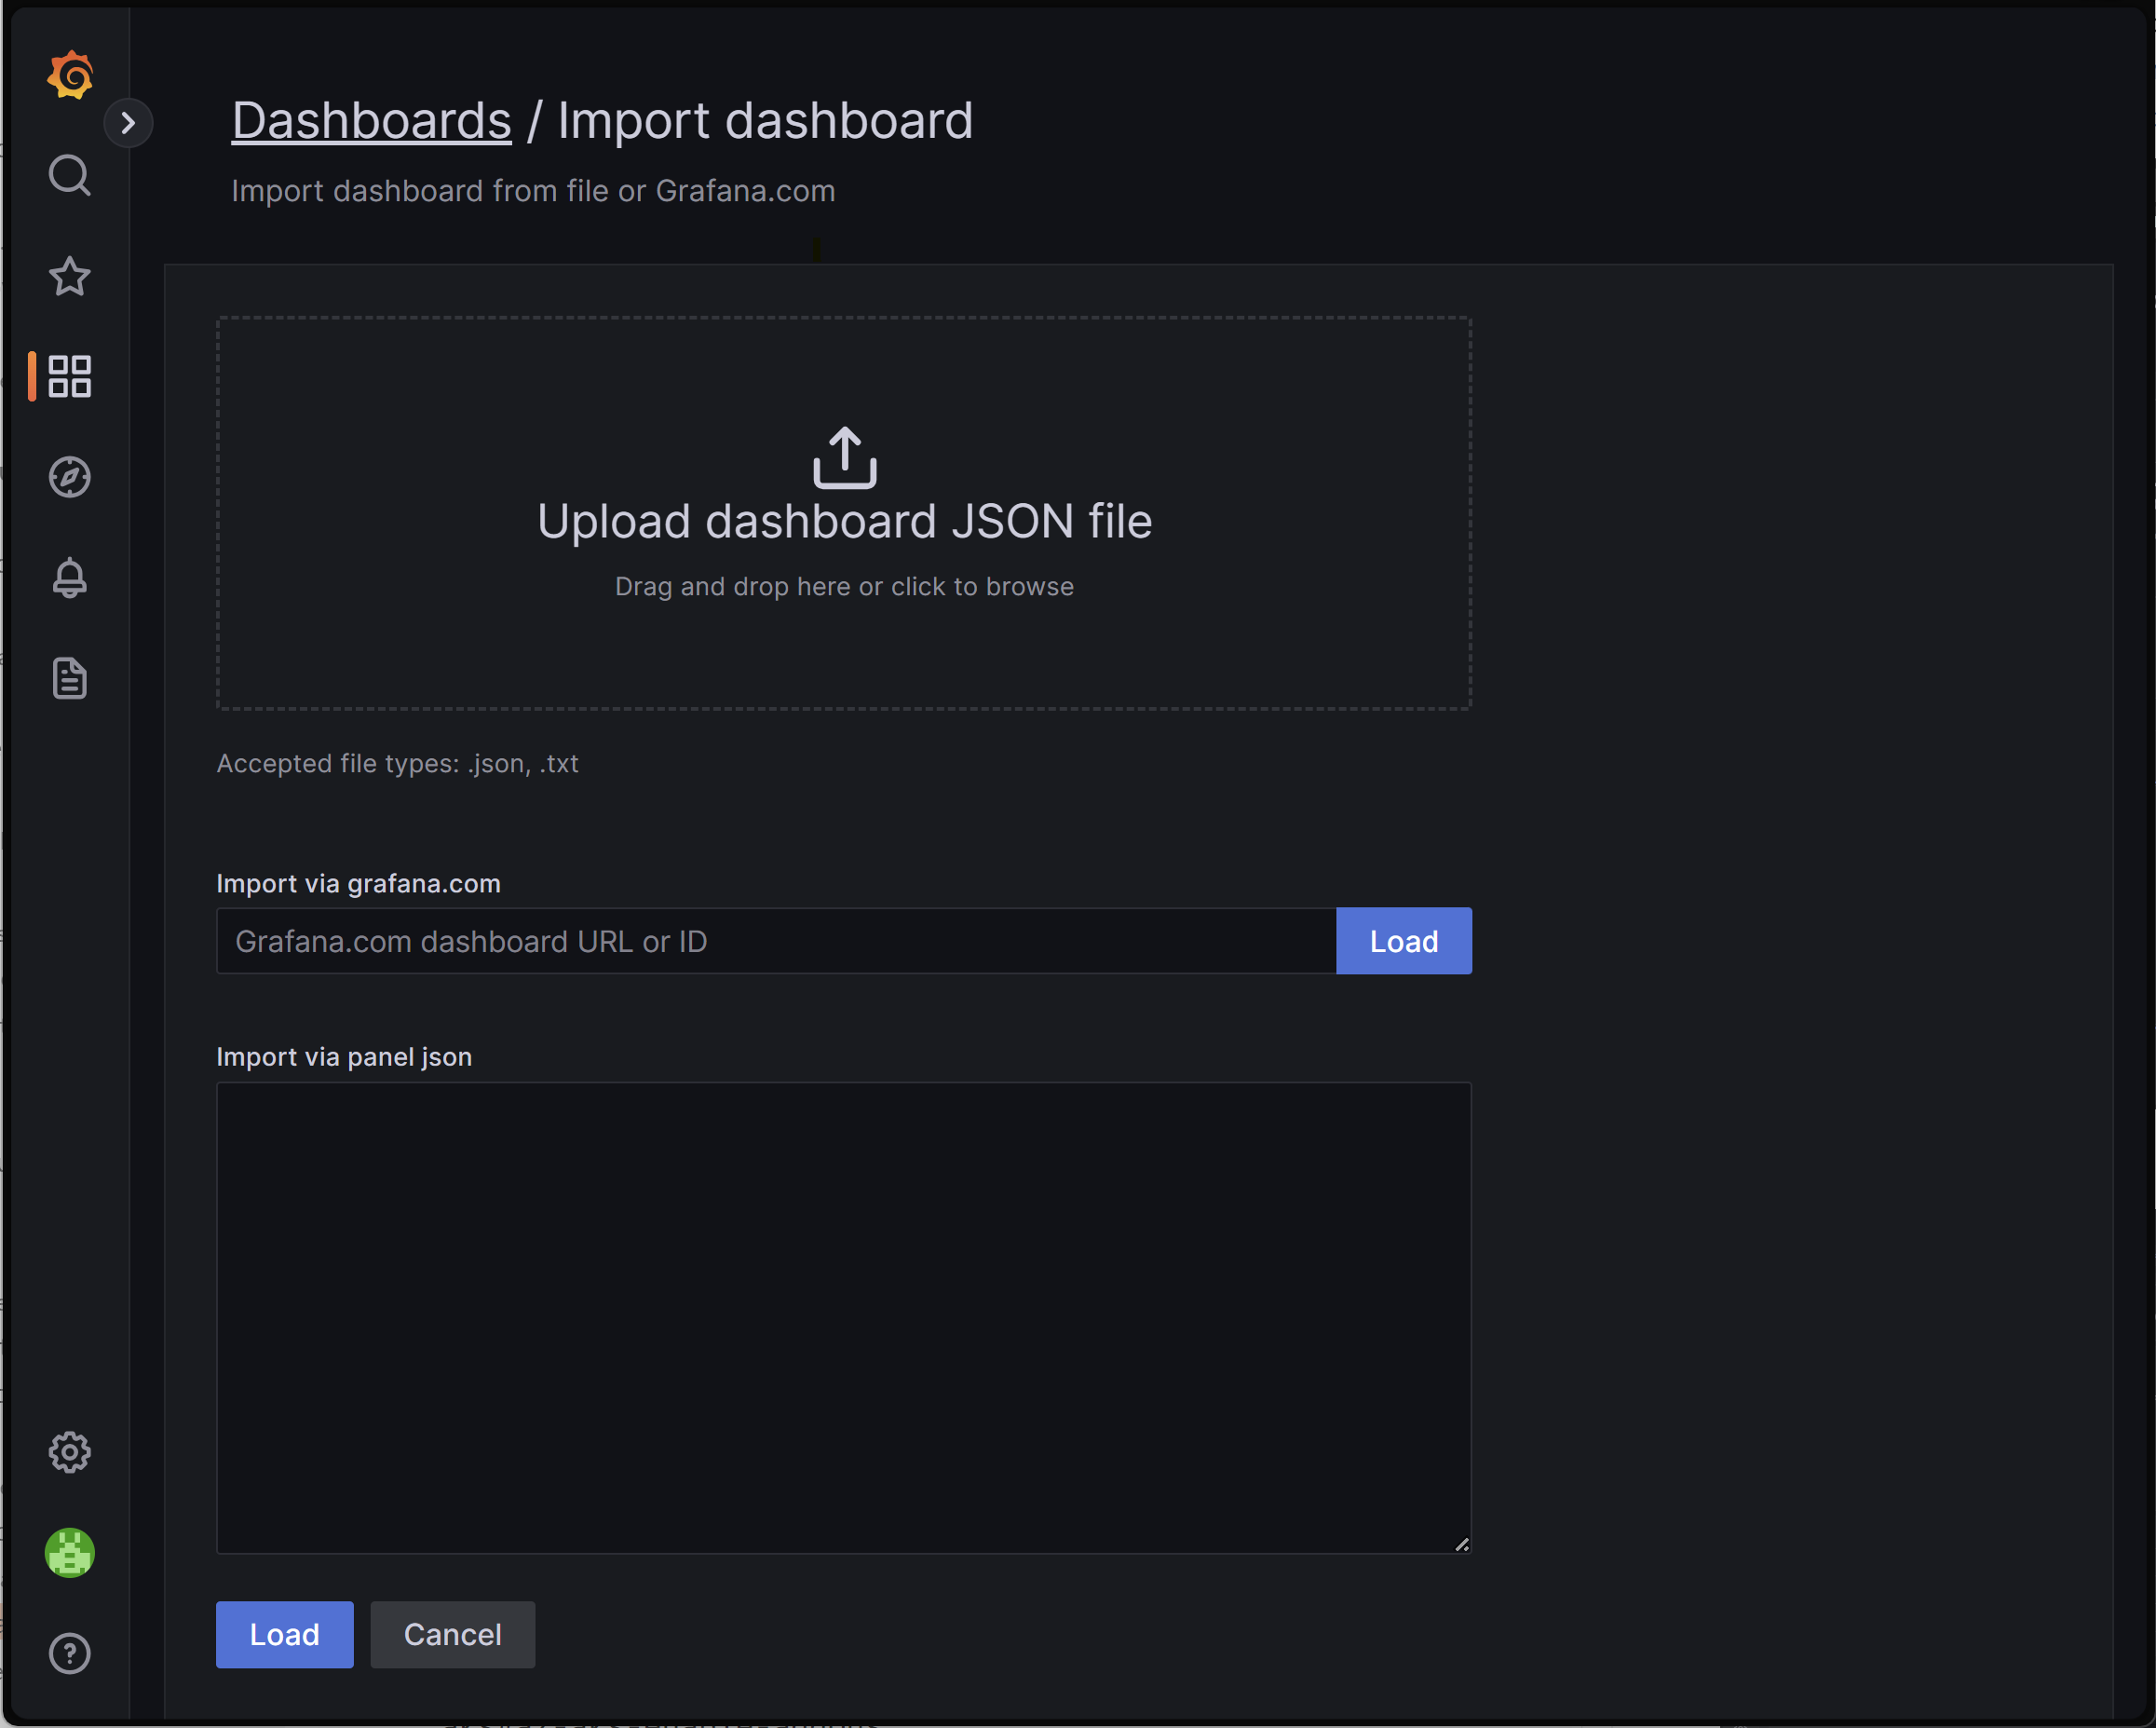
导入仪表板
若要导入 Grafana 仪表板,请展开左侧菜单并单击“仪表板”下的“导入”。
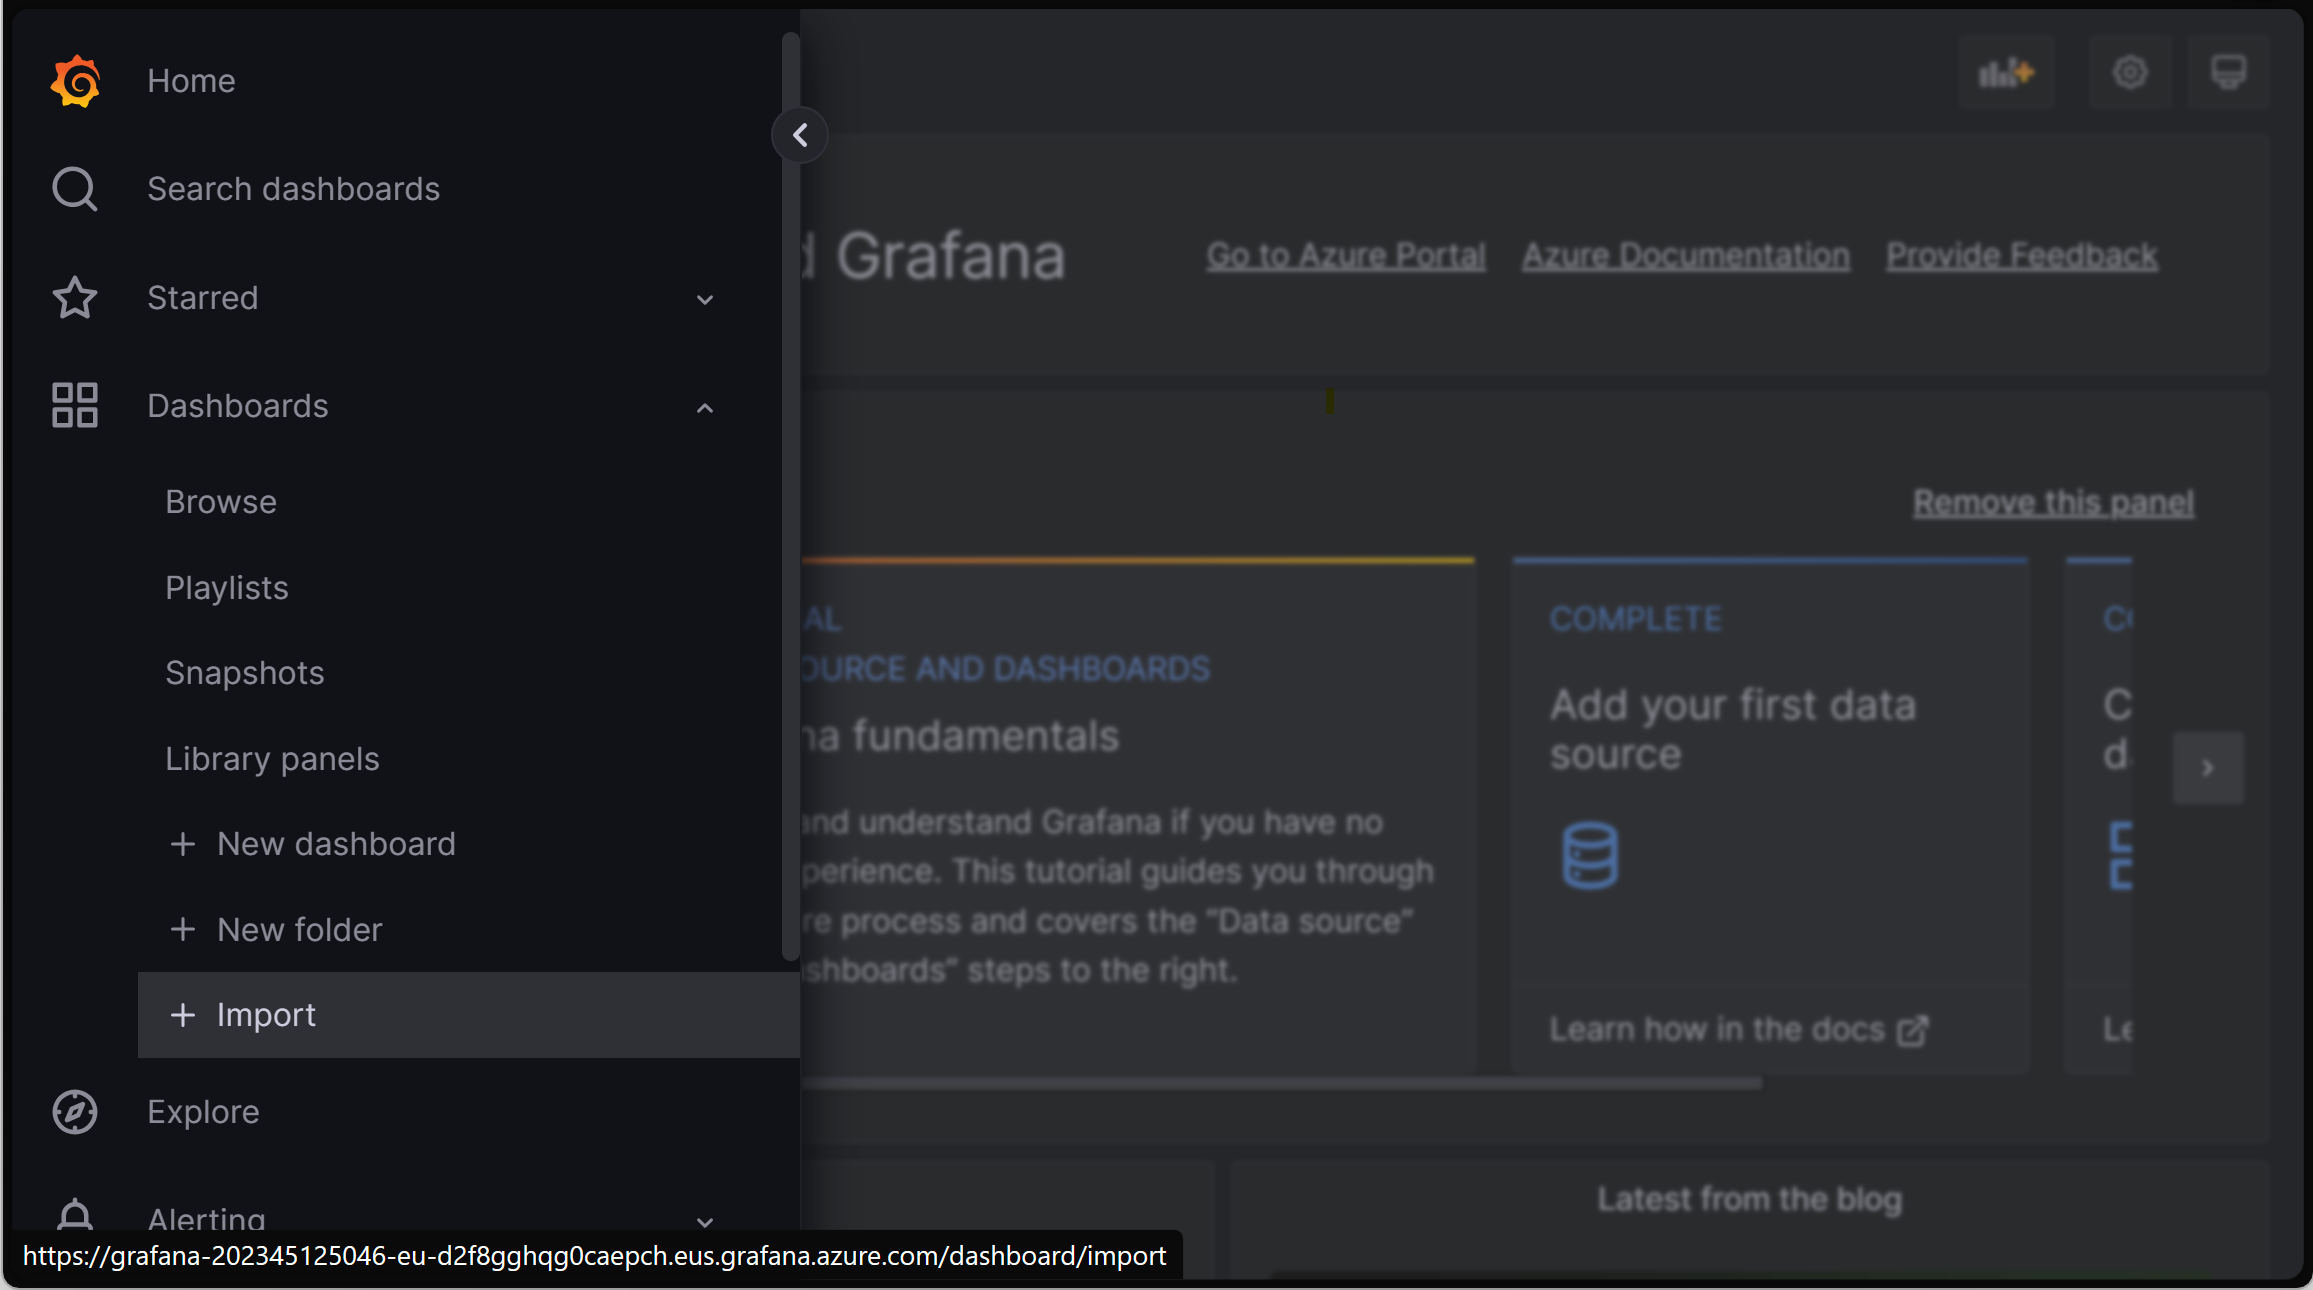
然后上传所需的仪表板文件,然后单击“上传”。
后续步骤
- 可以通过 Kubernetes 事件驱动的自动缩放程序 (KEDA) 使用 Prometheus 抓取的入口指标来配置工作负载的缩放。 详细了解如何将 KEDA 与 AKS 集成。
- 使用 Azure 负载测试创建并运行负载测试,以测试工作负载性能并优化应用程序的可伸缩性。