你当前正在访问 Microsoft Azure Global Edition 技术文档网站。 如果需要访问由世纪互联运营的 Microsoft Azure 中国技术文档网站,请访问 https://docs.azure.cn。
向地图添加多边形层 (Android SDK)
本文介绍如何使用多边形层渲染地图上的 Polygon 和 MultiPolygon 特征几何图形区域。
注意
Azure Maps Android SDK 停用
适用于 Android 的 Azure Maps 本机 SDK 现已弃用,将于 2025 年 3 月 31 日停用。 为了避免服务中断,请在 2025 年 3 月 31 日之前迁移到 Azure Maps Web SDK。 有关详细信息,请参阅 Azure Maps Android SDK 迁移指南。
先决条件
请务必完成快速入门:创建 Android 应用文档中的步骤。 可以将本文中的代码块插入到地图的 onReady 事件处理程序中。
使用多边形层
将多边形层连接到数据源并加载到地图上时,它将渲染具有 Polygon 和 MultiPolygon 特征的区域。 要创建多边形,请将其添加到数据源,并使用多边形层通过 PolygonLayer 类对其进行渲染。
//Create a data source and add it to the map.
DataSource source = new DataSource();
map.sources.add(source);

//Create a rectangular polygon.
source.add(Polygon.fromLngLats(
    Arrays.asList(
        Arrays.asList(
            Point.fromLngLat(-73.98235, 40.76799),
            Point.fromLngLat(-73.95785, 40.80044),
            Point.fromLngLat(-73.94928, 40.79680),
            Point.fromLngLat(-73.97317, 40.76437),
            Point.fromLngLat(-73.98235, 40.76799)
        )
    )
));

//Create and add a polygon layer to render the polygon on the map, below the label layer.
map.layers.add(new PolygonLayer(source,
    fillColor("red"),
    fillOpacity(0.7f)
), "labels");
//Create a data source and add it to the map.
val source = DataSource()
map.sources.add(source)

//Create a rectangular polygon.
source.add(
    Polygon.fromLngLats(
        Arrays.asList(
            Arrays.asList(
                Point.fromLngLat(-73.98235, 40.76799),
                Point.fromLngLat(-73.95785, 40.80044),
                Point.fromLngLat(-73.94928, 40.79680),
                Point.fromLngLat(-73.97317, 40.76437),
                Point.fromLngLat(-73.98235, 40.76799)
            )
        )
    )
)

//Create and add a polygon layer to render the polygon on the map, below the label layer.
map.layers.add(
    PolygonLayer(
        source,
        fillColor("red"),
        fillOpacity(0.7f)
    ), "labels"
)
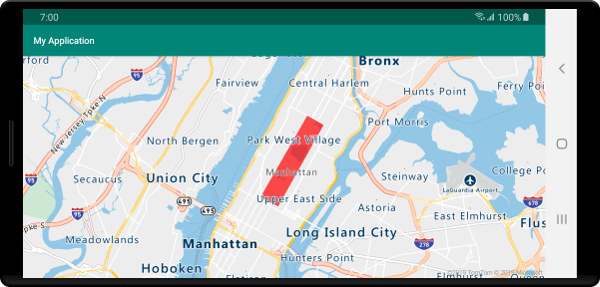
以下屏幕截图显示上述代码使用多边形层渲染了多边形区域。
结合使用多边形和线条层
线条层用于渲染多边形的轮廓。 下面的代码示例像上一个示例一样渲染了一个多边形,但添加了一个线条层。 此线条层是连接到数据源的另一个层。
//Create a data source and add it to the map.
DataSource source = new DataSource();
map.sources.add(source);

//Create a rectangular polygon.
source.add(Polygon.fromLngLats(
    Arrays.asList(
        Arrays.asList(
            Point.fromLngLat(-73.98235, 40.76799),
            Point.fromLngLat(-73.95785, 40.80044),
            Point.fromLngLat(-73.94928, 40.79680),
            Point.fromLngLat(-73.97317, 40.76437),
            Point.fromLngLat(-73.98235, 40.76799)
        )
    )
));

//Create and add a polygon layer to render the polygon on the map, below the label layer.
map.layers.add(new PolygonLayer(source,
    fillColor("rgba(0, 200, 200, 0.5)")
), "labels");

//Create and add a line layer to render the outline of the polygon.
map.layers.add(new LineLayer(source,
    strokeColor("red"),
    strokeWidth(2f)
));
//Create a data source and add it to the map.
val source = DataSource()
map.sources.add(source)

//Create a rectangular polygon.
source.add(
    Polygon.fromLngLats(
        Arrays.asList(
            Arrays.asList(
                Point.fromLngLat(-73.98235, 40.76799),
                Point.fromLngLat(-73.95785, 40.80044),
                Point.fromLngLat(-73.94928, 40.79680),
                Point.fromLngLat(-73.97317, 40.76437),
                Point.fromLngLat(-73.98235, 40.76799)
            )
        )
    )
)

//Create and add a polygon layer to render the polygon on the map, below the label layer.
map.layers.add(
    PolygonLayer(
        source,
        fillColor("rgba(0, 200, 200, 0.5)")
    ), "labels"
)

//Create and add a line layer to render the outline of the polygon.
map.layers.add(
    LineLayer(
        source,
        strokeColor("red"),
        strokeWidth(2f)
    )
)
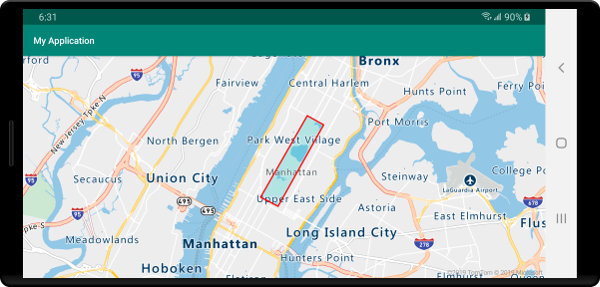
以下屏幕截图显示上述代码渲染了一个多边形,并使用线条层渲染了多边形的轮廓。
提示
当使用线条层勾勒多边形轮廓时,请确保闭合多边形中的所有环,使每组点的起点和终点相同。 如果不这样做,线条层可能不会将多边形的最后一个点连接到第一个点。
使用图案填充多边形
除了为多边形填充颜色之外,还可以使用图像图案来进行填充。 将图像图案加载到地图图像子画面资源中,然后使用多边形层的 fillPattern 选项引用该图像。
//Load an image pattern into the map image sprite.
map.images.add("fill-checker-red", R.drawable.fill_checker_red);

//Create a data source and add it to the map.
DataSource source = new DataSource();
map.sources.add(source);

//Create a polygon.
source.add(Polygon.fromLngLats(
    Arrays.asList(
        Arrays.asList(
            Point.fromLngLat(-50, -20),
            Point.fromLngLat(0, 40),
            Point.fromLngLat(50, -20),
            Point.fromLngLat(-50, -20)
        )
    )
));

//Create and add a polygon layer to render the polygon on the map, below the label layer.
map.layers.add(new PolygonLayer(source,
        fillPattern("fill-checker-red"),
        fillOpacity(0.5f)
), "labels");
//Load an image pattern into the map image sprite.
map.images.add("fill-checker-red", R.drawable.fill_checker_red)

//Create a data source and add it to the map.
val source = DataSource()
map.sources.add(source)

//Create a polygon.
source.add(
    Polygon.fromLngLats(
        Arrays.asList(
            Arrays.asList(
                Point.fromLngLat(-50, -20),
                Point.fromLngLat(0, 40),
                Point.fromLngLat(50, -20),
                Point.fromLngLat(-50, -20)
            )
        )
    )
)

//Create and add a polygon layer to render the polygon on the map, below the label layer.
map.layers.add(
    PolygonLayer(
        source,
        fillPattern("fill-checker-red"),
        fillOpacity(0.5f)
    ), "labels"
)
对于本示例,以下图像已加载到应用的可绘制资源文件夹中。
 |
|---|
| fill-checker-red.png |
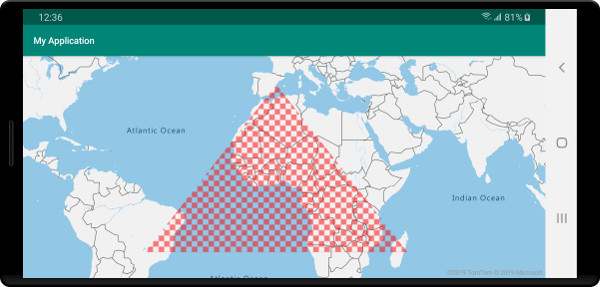
下图显示上述代码在地图上渲染了一个带有填充图案的多边形。
后续步骤
有关可向地图添加的更多代码示例,请参阅以下文章: