你当前正在访问 Microsoft Azure Global Edition 技术文档网站。 如果需要访问由世纪互联运营的 Microsoft Azure 中国技术文档网站,请访问 https://docs.azure.cn。
线条层可用于将 LineString 和 MultiLineString 特征呈现为地图上的路径或路由。 线条层还可用于呈现 Polygon 和 MultiPolygon 特征的轮廓。 数据源连接到线条层以向它提供要呈现的数据。
提示
默认情况下,线条层将呈现数据源中的多边形和线条的坐标。 若要限制该层以便仅呈现 LineString 特征,请将该层的 filter 属性设置为 ['==', ['geometry-type'], 'LineString'] 或 ['any', ['==', ['geometry-type'], 'LineString'], ['==', ['geometry-type'], 'MultiLineString']](如果还想要包含 MultiLineString 特征)。
以下代码演示如何创建线条。 将线条添加到数据源,然后使用 LineLayer 类通过线条层呈现它。
//Create a data source and add it to the map.
var dataSource = new atlas.source.DataSource();
map.sources.add(dataSource);

//Create a line and add it to the data source.
dataSource.add(new atlas.data.LineString([[-73.972340, 40.743270], [-74.004420, 40.756800]]));

//Create a line layer to render the line to the map.
map.layers.add(new atlas.layer.LineLayer(dataSource, null, {
    strokeColor: 'blue',
    strokeWidth: 5
}));
以下屏幕截图显示了上述功能的示例。

可以使用 LineLayerOptions 和使用数据驱动样式表达式来设置线条层的样式。
沿线条添加符号
以下示例演示如何沿地图上的线条添加箭头图标。 使用符号层时,将 placement 选项设置为 line。 此选项将沿线条呈现符号并旋转图标(0 度 = 右)。
function InitMap()
{
    var map = new atlas.Map('myMap', {
    center: [-122.135, 47.65],
    zoom: 11,
    view: "Auto",

    //Add authentication details for connecting to Azure Maps.
    authOptions: {
      authType: 'subscriptionKey',
      subscriptionKey: '{Your-Azure-Maps-Subscription-key}'
    }
  });

  var datasource;

  //Wait until the map resources are ready.
  map.events.add('ready', function () {

    //Load the custom image icon into the map resources.
    map.imageSprite.add('arrow-icon', '/images/icons/purpleArrowRight.png').then(function () {
      //Create a data source and add it to the map.
      datasource = new atlas.source.DataSource();
      map.sources.add(datasource);

      //Create a line and add it to the data source.
      datasource.add(new atlas.data.Feature(new atlas.data.LineString([
        [-122.18822, 47.63208],
        [-122.18204, 47.63196],
        [-122.17243, 47.62976],
        [-122.16419, 47.63023],
        [-122.15852, 47.62942],
        [-122.15183, 47.62988],
        [-122.14256, 47.63451],
        [-122.13483, 47.64041],
        [-122.13466, 47.64422],
        [-122.13844, 47.65440],
        [-122.13277, 47.66515],
        [-122.12779, 47.66712],
        [-122.11595, 47.66712],
        [-122.11063, 47.66735],
        [-122.10668, 47.67035],
        [-122.10565, 47.67498]
      ])));

      //Add a layers for rendering data.
      map.layers.add([
        //Add a line layer for displaying the line.
        new atlas.layer.LineLayer(datasource, null, {
          strokeColor: 'DarkOrchid',
          strokeWidth: 3
        }),

        //Add a symbol layer for rendering the arrow along the line.
        new atlas.layer.SymbolLayer(datasource, null, {
          //Specify how much space should be between the symbols in pixels.
          lineSpacing: 100,

          //Tell the symbol layer that the symbols are being rendered along a line.
          placement: 'line',
          iconOptions: {
            image: 'arrow-icon',
            allowOverlap: true,
            anchor: 'center',
            size: 0.8
          }
        })
      ]);
    });
  });
}
此代码会创建如下所示的地图:

注意
有关上述示例中使用的映像文件的副本,请参阅 GitHub 中的 purpleArrowRight.png。
提示
Azure Maps Web SDK 提供了多个可与符号层一起使用的可自定义的图像模板。 有关详细信息,请参阅如何使用图像模板文档。
向线条添加笔划渐变
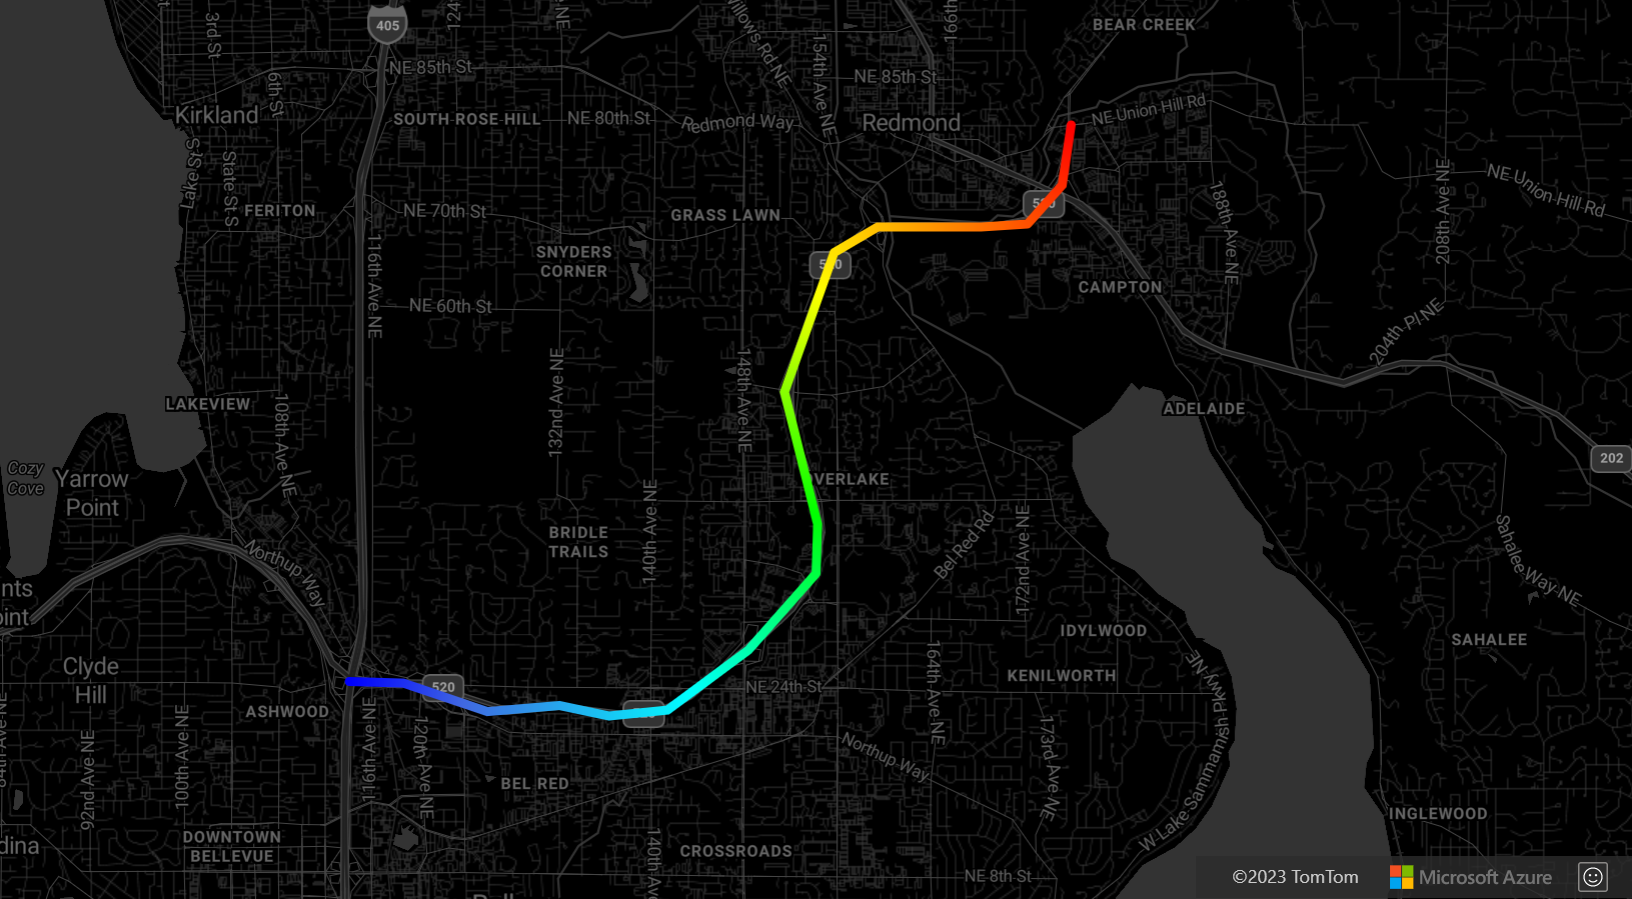
可以将一种笔划颜色应用于线条。 还可以使用颜色渐变填充线条,以显示从一个线段到下一个线段的转换。 例如,线条渐变可用于表示随时间和距离推移的变化,或是一连串连接的对象间的不同温度。 若要将此特征应用于线条,数据源必须将 lineMetrics 选项设置为 true,随后可以将颜色渐变表达式传递到线条的 strokeColor 选项。 笔划渐变表达式必须引用将计算线条指标公开给表达式的 ['line-progress'] 数据表达式。
如需展示如何将笔划渐变应用于地图上的线条的全功能示例,请参阅 Azure Maps 示例中的具有笔划渐变的线条。 有关此示例的源代码,请参阅带笔划渐变的线条源代码。
自定义线条层
线条层有多个样式选项。 如需以交互方式演示线条选项的全功能示例,请参阅 Azure Maps 示例中的线条层选项。 有关此示例的源代码,请参阅线条层选项源代码。

后续步骤
详细了解本文中使用的类和方法:
有关可向地图添加的更多代码示例,请参阅以下文章: