Important
此功能目前以公共预览版提供。
自定义可视化让您能够在 AI/BI 仪表板中创建超出内置可视化类型范围的图表。 自定义可视化效果使用 Vega-Lite 库从 JSON 规范呈现图表。
自定义可视化可以渲染超越内置选项的专用图表类型。 以下系统发育树采用力导向布局,将相关记录围绕共享的群体和家族中心分组:

要逐步构建图表,请参见 示例可视化。 如需参考其他图表类型的规范,请参见 “更多图表规范”。
创建自定义可视化效果
创建自定义可视化:
- 选择数据集。
- 在“可视化效果配置”窗格中,选择“高级可视化”部分下的“自定义 Viz”。
- 在 “字段” 部分中,添加要使用的字段。 每个字段都有唯一 的名称。 使用这些名称来引用 Vega-Lite 规范中的字段。
- 在Vega-Lite 规范编辑器中输入 Vega-Lite JSON 规范 。
参考数据集列
Vega-Lite 规范中的参考列可通过以下方式之一实现:
使用
"field": "{columnName}"。 以下示例将xField列分配给 x 轴:"encoding": { "x": { "field": "xField", "type": "quantitative" } }在表达式中,使用
datum["{columnName}"]或datum.{columnName}。 以下示例根据x列和r列定义一个新的angle列:{ "calculate": "datum.r * cos(datum.angle)", "as": "x" }
有关详细信息,请参阅 datum Vega 表达式文档中的内容。
继承仪表板主题
自定义可视化效果会自动适应仪表板的主题,包括浅色和深色模式。 以下图表元素继承主题值,无需对规范进行任何更改:
- 坐标轴、图例、标题和页眉的字体与仪表板中配置的字体一致。
- 轴线与主动模式仪表盘的网格线颜色相匹配。
- 图表背景在小组件的主题背景上呈透明状态。
在规范块 config 中定义的设置优先于继承的默认值。
引用表达式中的主题值
若要使用支持主题的值对标记进行样式设置,请在 Vega-Lite 表达式 ({ "expr": "..." }) 中引用以下信号:
| 信号 | 说明 |
|---|---|
colors |
活动模式的预解析颜色标记。 将这些值用于常见值,例如 colors.textPrimary.default, colors.gridColor和 colors.markHighlightColor。 不要用 [mode] 对这些内容建立索引;它们已被解析。 |
mode |
当前颜色模式,为 'light' 或 'dark' 之一。 使用它为提供各模式变体的 dashboardTheme 字段建立索引。 |
dashboardTheme |
仪表板所有者配置的完整主题,包括字体(resolvedFontSettings)、分类调色板(visualizationColors)和按模式颜色(gridLineColor)。 具有按模式变体的字段需要 [mode] 索引。 |
信号colorsdashboardTheme是独立的。 该 colors 信号提供为主动模式解析的便利令牌,同时 dashboardTheme 展示完整的所有者配置主题。 先使用 colors,对于字体、完整调色板或 dashboardTheme 未提供的任何值,则使用 colors。
以下示例展示了如何引用主题值:
将仪表板的正文字体用于文本标记:
{ "expr": "dashboardTheme.resolvedFontSettings.fieldValue.fontFamily" }将仪表板的标题颜色用于活动模式:
{ "expr": "dashboardTheme.resolvedFontSettings.fieldTitle.fontColor[mode]" }使用仪表板的分类调色板中的一个颜色:
{ "expr": "dashboardTheme.visualizationColors[0]" }
注意
colors激活模式的标记已经解决了。 跳 [mode] 过索引,使用 colors.markHighlightColor,而不是 colors.markHighlightColor[mode]。 在 下具有各模变体的字段 dashboardTheme ,如 dashboardTheme.gridLineColor[mode],需要索引 [mode] 。
根据所选内容筛选其他小部件
自定义可视化效果可以充当交叉筛选源:当用户单击标记时,选择会筛选仪表板上的其他小组件。 若要启用此功能,请添加具有保留名称 databricks_mark_selection的点选择参数。 渲染器会检测此名称,并将所选项关联到仪表板的交叉筛选状态。
"params": [
  {
    "name": "databricks_mark_selection",
    "select": { "type": "point", "fields": ["categoryName"] }
  }
]
需要满足以下要求:
- 参数
name必须严格为databricks_mark_selection。 任何其他名称都被视为常规参数,不会驱动交叉筛选。 -
select.type必须为point。 区间(画笔)选择不能用作交叉筛选源。 -
select.fields必须列出小组件配置的 “字段” 部分中定义的字段名称,而不是原始列名。 - 仅在
select.fields中列出维度(分组)字段。 聚合度量值(如SUM(...)或AVG(...))无法驱动交叉筛选器。 - 若要选择多个字段,请将它们一起列出:
"fields": ["categoryName", "regionName"]
突出显示所选标记
若要突出显示所选标记,请在基于填充的标记类型(如stroke、strokeWidth或bar)上使用arc和rect条件,并保持color编码绑定到您的字段。 请将笔画设置为 { "expr": "colors.markHighlightColor" },以便高亮部分在浅色和深色模式下均清晰可辨。
以下示例演示了当单击某个条形时,如何按 categoryName 筛选仪表板的其余部分。 选中的条形会应用主题描边,未选中的条形会变暗,同时保留其颜色编码。
JSON 规范
{
  "$schema": "https://vega.github.io/schema/vega-lite/v6.json",
  "data": { "name": "databricks_query" },
  "width": "container",
  "height": "container",
  "config": { "autosize": { "type": "fit", "contains": "padding" } },
  "params": [
    {
      "name": "databricks_mark_selection",
      "select": { "type": "point", "fields": ["categoryName"] }
    }
  ],
  "mark": { "type": "bar", "stroke": null },
  "encoding": {
    "x": { "field": "categoryName", "type": "nominal" },
    "y": { "field": "salesValue", "type": "quantitative" },
    "color": { "field": "categoryName", "type": "nominal" },
    "fillOpacity": {
      "condition": { "param": "databricks_mark_selection", "value": 1 },
      "value": 0.3
    }
    "stroke": {
      "condition": {
        "param": "databricks_mark_selection",
        "empty": false,
        "value": { "expr": "colors.markHighlightColor" }
      },
      "value": null
    },
    "strokeWidth": {
      "condition": { "param": "databricks_mark_selection", "empty": false, "value": 2 },
      "value": 0
    }
  }
}
自动调整图表大小
若要调整图表大小以适应其容器,请在规范的顶层添加以下设置:
"width": "container",
"height": "container",
"config": {
  "autosize": {
    "type": "fit",
    "contains": "padding"
  }
}
示例可视化
以下示例一步步讲解定制可视化,从简单的分层图表到更高级的系统发育树。
带有滚动均值的分层图表
此示例使用 Databricks 示例数据集中的天气数据创建一个分层图表,用于绘制原始温度数据点,并叠加一条滚动平均线。
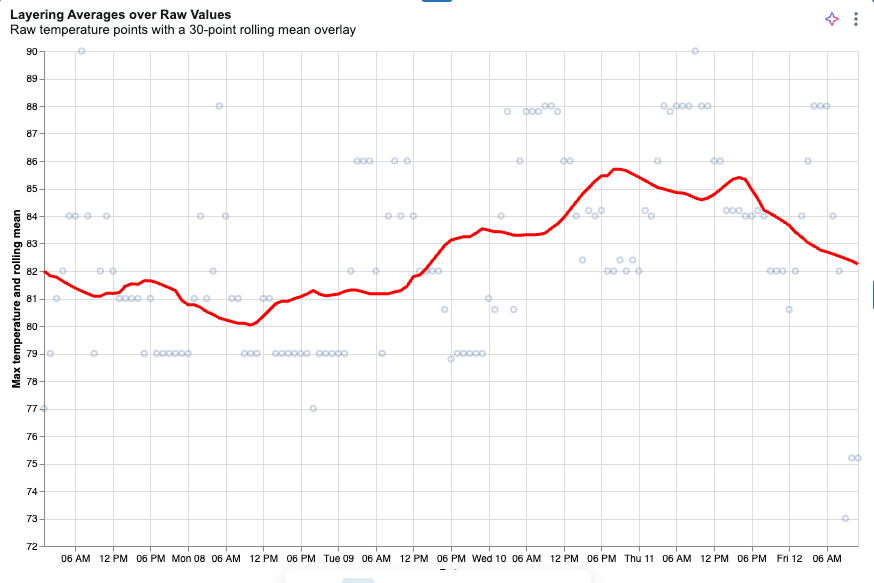
使用以下查询创建数据集:
SELECT date, temperature AS temp_max
FROM samples.accuweather.historical_hourly_imperial
WHERE city_name = 'singapore'
ORDER BY date;
在可视化配置窗格中的 “高级”下,选择“ 自定义 Viz”。
选择在上一步中创建的数据集。
在 “字段” 部分中,添加日期列的字段并将其 名称 设置为
date。添加温度列的字段并将其 名称 设置为
temp_max。将以下规范复制到 Vega-Lite 规范 编辑器中。 如果x轴被裁剪,请参见 自动调整图表大小。
JSON 规范
{
  "$schema": "https://vega.github.io/schema/vega-lite/v5.json",
  "width": "container",
  "height": "container",
  "config": {
    "autosize": { "type": "fit", "contains": "padding" }
  },
  "data": { "name": "databricks_query" },
  "transform": [
    {
      "window": [{ "field": "temp_max", "op": "mean", "as": "rolling_mean" }],
      "frame": [-15, 15]
    }
  ],
  "encoding": {
    "x": { "field": "date", "type": "temporal", "title": "Date" },
    "y": {
      "type": "quantitative",
      "scale": { "zero": false },
      "axis": { "title": "Max temperature and rolling mean" }
    }
  },
  "layer": [
    {
      "mark": { "type": "point", "opacity": 0.3 },
      "encoding": { "y": { "field": "temp_max", "title": "Max temperature" } }
    },
    {
      "mark": { "type": "line", "color": "red", "size": 3 },
      "encoding": { "y": { "field": "rolling_mean", "title": "Rolling mean of max temperature" } }
    }
  ]
}
系统发育树
本例使用一小部分样本数据构建本页顶部所示的系统发育树。 Vega-Lite 会在你提供的坐标上绘制点,但不会计算网络图本身的节点位置。 这个计算在数据到达图表之前就在查询中完成,查询会预先计算每个点的x和y坐标。 查询会发出三种记录类型,规范将其渲染为独立的图层: path 行绘制弯曲的分支, node 行绘制叶子圆, label 行用于定位组标签。
下载示例数据。 每一行代表一个化石发现,并
dig_longitudedig_latitude标注其发掘地点坐标。单击边栏中的
 仪表板。
仪表板。单击“ 创建仪表板”。
单击“数据”选项卡。
点击 添加数据,然后点击 上传数据。
将下载的文件放入文件上传面板的 创建或修改表 中。
选择你想存储表的 目录 和 模式 ,然后输入表名。
单击“创建表”。 完整表格会自动作为数据集添加。
点击添加SQL数据集,然后粘贴查询。 在查询的从句中,将
FROM目录、模式和表名称替换为创建表时使用的名称。按照“ 创建自定义可视化”中的步骤创建自定义可视化。 在字段部分,添加以下字段,使用每个字段名称作为名称:
record_type,x,yfossil_tagpoint_ordersuborderroar_scoreclade_labelgenus_symbolfamily_taxonlabel_text把 规范 用作你的 Vega-Lite JSON。
SQL查询
WITH base AS (
  SELECT
    fossil_tag,
    genus_symbol,
    clade_label,
    suborder,
    family_taxon,
    dig_longitude,
    dig_latitude,
    roar_score
  FROM
    `my_catalog`.`default`.`dino_table`
),
root_pt AS (
  SELECT
    AVG(dig_longitude) AS rx,
    AVG(dig_latitude) AS ry
  FROM
    base
),
group_pts AS (
  SELECT
    suborder,
    AVG(dig_longitude) AS gx,
    AVG(dig_latitude) AS gy
  FROM
    base
  GROUP BY
    suborder
),
family_pts AS (
  SELECT
    suborder,
    family_taxon,
    AVG(dig_longitude) AS fx,
    AVG(dig_latitude) AS fy
  FROM
    base
  GROUP BY
    suborder,
    family_taxon
),
ctx AS (
  SELECT
    b.fossil_tag,
    b.suborder,
    b.family_taxon,
    b.clade_label,
    b.genus_symbol,
    b.dig_longitude,
    b.dig_latitude,
    b.roar_score,
    r.rx,
    r.ry,
    g.gx,
    g.gy,
    f.fx,
    f.fy
  FROM
    base b
      CROSS JOIN root_pt r
      JOIN group_pts g
        ON b.suborder = g.suborder
      JOIN family_pts f
        ON b.suborder = f.suborder
        AND b.family_taxon = f.family_taxon
),
waypoints AS (
  SELECT
    fossil_tag,
    suborder,
    family_taxon,
    clade_label,
    genus_symbol,
    roar_score,
    0 AS point_order,
    rx AS x,
    ry AS y
  FROM
    ctx
  UNION ALL
  SELECT
    fossil_tag,
    suborder,
    family_taxon,
    clade_label,
    genus_symbol,
    roar_score,
    1,
    rx + 0.30 * (gx - rx),
    ry + 0.30 * (gy - ry)
  FROM
    ctx
  UNION ALL
  SELECT
    fossil_tag,
    suborder,
    family_taxon,
    clade_label,
    genus_symbol,
    roar_score,
    2,
    gx + 0.15 * (fx - gx),
    gy + 0.15 * (fy - gy)
  FROM
    ctx
  UNION ALL
  SELECT
    fossil_tag,
    suborder,
    family_taxon,
    clade_label,
    genus_symbol,
    roar_score,
    3,
    gx + 0.50 * (fx - gx) + 0.03 * (dig_longitude - fx),
    gy + 0.50 * (fy - gy) + 0.03 * (dig_latitude - fy)
  FROM
    ctx
  UNION ALL
  SELECT
    fossil_tag,
    suborder,
    family_taxon,
    clade_label,
    genus_symbol,
    roar_score,
    4,
    fx + 0.15 * (dig_longitude - fx),
    fy + 0.15 * (dig_latitude - fy)
  FROM
    ctx
  UNION ALL
  SELECT
    fossil_tag,
    suborder,
    family_taxon,
    clade_label,
    genus_symbol,
    roar_score,
    5,
    fx + 0.65 * (dig_longitude - fx),
    fy + 0.65 * (dig_latitude - fy)
  FROM
    ctx
  UNION ALL
  SELECT
    fossil_tag,
    suborder,
    family_taxon,
    clade_label,
    genus_symbol,
    roar_score,
    6,
    dig_longitude,
    dig_latitude
  FROM
    ctx
)
SELECT
  fossil_tag,
  suborder,
  point_order,
  x,
  y,
  family_taxon,
  clade_label,
  genus_symbol,
  roar_score,
  'path' AS record_type,
  CAST(NULL AS STRING) AS label_text
FROM
  waypoints
UNION ALL
SELECT
  fossil_tag,
  suborder,
  99 AS point_order,
  dig_longitude AS x,
  dig_latitude AS y,
  family_taxon,
  clade_label,
  genus_symbol,
  roar_score,
  'node' AS record_type,
  CAST(NULL AS STRING) AS label_text
FROM
  base
UNION ALL
SELECT
  g.suborder AS fossil_tag,
  g.suborder AS suborder,
  100 AS point_order,
  g.gx
    + (g.gx - r.rx)
      * CASE LOWER(g.suborder)
        WHEN 'titanosauria' THEN 0.10
        WHEN 'hadrosauria' THEN 0.25
        WHEN 'ornithopoda' THEN 1.30
        WHEN 'stegosauria' THEN 0.73
        ELSE 0.55
      END AS x,
  g.gy
    + (g.gy - r.ry)
      * CASE LOWER(g.suborder)
        WHEN 'titanosauria' THEN 0.10
        WHEN 'hadrosauria' THEN 0.25
        WHEN 'ornithopoda' THEN 1.30
        WHEN 'stegosauria' THEN 0.73
        ELSE 0.55
      END AS y,
  CAST(NULL AS STRING) AS family_taxon,
  CAST(NULL AS STRING) AS clade_label,
  CAST(NULL AS STRING) AS genus_symbol,
  CAST(NULL AS DOUBLE) AS roar_score,
  'label' AS record_type,
  g.suborder AS label_text
FROM
  group_pts g CROSS JOIN root_pt r
JSON 规范
{
  "$schema": "https://vega.github.io/schema/vega-lite/v5.json",
  "data": { "name": "databricks_query" },
  "width": "container",
  "height": "container",
  "background": "white",
  "config": {
    "autosize": { "type": "fit", "contains": "padding" },
    "view": { "stroke": null }
  },
  "layer": [
    {
      "transform": [{ "filter": "datum.record_type === 'path'" }],
      "mark": {
        "type": "line",
        "interpolate": "basis",
        "strokeCap": "round",
        "strokeJoin": "round"
      },
      "encoding": {
        "x": {
          "field": "x",
          "type": "quantitative",
          "axis": null,
          "scale": { "zero": false, "nice": false }
        },
        "y": {
          "field": "y",
          "type": "quantitative",
          "axis": null,
          "scale": { "zero": false, "nice": false }
        },
        "detail": { "field": "fossil_tag", "type": "nominal" },
        "order": { "field": "point_order", "type": "quantitative" },
        "color": {
          "field": "suborder",
          "type": "nominal",
          "scale": { "scheme": "tableau10" },
          "legend": null
        },
        "opacity": { "value": 0.3 },
        "strokeWidth": { "value": 0.8 }
      }
    },
    {
      "transform": [{ "filter": "datum.record_type === 'node'" }],
      "mark": {
        "type": "circle",
        "opacity": 0.9,
        "stroke": "white",
        "strokeWidth": 0.3
      },
      "encoding": {
        "x": {
          "field": "x",
          "type": "quantitative",
          "axis": null,
          "scale": { "zero": false, "nice": false }
        },
        "y": {
          "field": "y",
          "type": "quantitative",
          "axis": null,
          "scale": { "zero": false, "nice": false }
        },
        "color": {
          "field": "suborder",
          "type": "nominal",
          "scale": { "scheme": "tableau10" },
          "legend": { "title": "Suborder", "orient": "right" }
        },
        "size": {
          "field": "roar_score",
          "type": "quantitative",
          "scale": { "domain": [0, 100], "range": [4, 150] },
          "legend": null
        },
        "tooltip": [
          { "field": "clade_label", "title": "Clade" },
          { "field": "genus_symbol", "title": "Symbol" },
          { "field": "suborder", "title": "Suborder" },
          { "field": "family_taxon", "title": "Family" },
          { "field": "roar_score", "title": "Roar Score", "format": ".1f" }
        ]
      }
    },
    {
      "transform": [{ "filter": "datum.record_type === 'label'" }],
      "mark": {
        "type": "text",
        "fontSize": 12,
        "fontWeight": "bold",
        "opacity": 0.85
      },
      "encoding": {
        "x": {
          "field": "x",
          "type": "quantitative",
          "axis": null,
          "scale": { "zero": false, "nice": false }
        },
        "y": {
          "field": "y",
          "type": "quantitative",
          "axis": null,
          "scale": { "zero": false, "nice": false }
        },
        "text": { "field": "label_text", "type": "nominal" },
        "color": {
          "field": "suborder",
          "type": "nominal",
          "scale": { "scheme": "tableau10" },
          "legend": null
        }
      }
    }
  ]
}
更多图表规格
以下规范展示的图表不属于内置可视化类型。 有关更多示例,请参阅 Vega-Lite 示例库。
子弹图
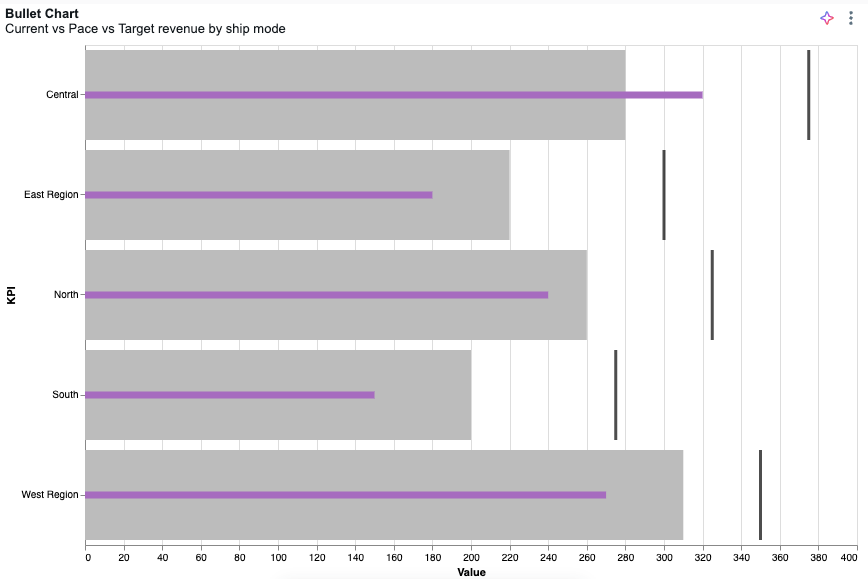
在categoryField部分中定义currentField、paceField、targetField和。
JSON 规范
{
  "$schema": "https://vega.github.io/schema/vega-lite/v5.json",
  "width": "container",
  "height": "container",
  "data": { "name": "databricks_query" },
  "config": {
    "autosize": { "type": "fit", "contains": "padding" }
  },
  "transform": [
    {
      "fold": ["targetField", "paceField", "currentField"],
      "as": ["measure_name", "measure_value"]
    },
    {
      "calculate": "toNumber(datum.measure_value)",
      "as": "measure_value"
    },
    {
      "calculate": "{ \"targetField\": \"Target\", \"paceField\": \"Pace\", \"currentField\": \"Current\" }[datum.measure_name]",
      "as": "measure_label"
    },
    {
      "calculate": "indexof([\"Target\", \"Pace\", \"Current\"], datum.measure_label)",
      "as": "measure_order"
    }
  ],
  "layer": [
    {
      "mark": "bar",
      "params": [
        {
          "name": "legend_click",
          "select": { "type": "point", "fields": ["measure_label"] },
          "bind": "legend"
        }
      ],
      "encoding": {
        "color": { "field": "measure_label" },
        "opacity": { "value": 0 }
      }
    },
    {
      "transform": [{ "filter": { "param": "legend_click" } }],
      "layer": [
        {
          "layer": [
            {
              "mark": { "type": "bar", "tooltip": true },
              "encoding": { "color": { "field": "measure_label", "legend": null } },
              "transform": [{ "filter": { "field": "measure_label", "oneOf": ["Pace"] } }]
            },
            {
              "mark": { "type": "bar", "height": 7, "tooltip": true },
              "encoding": { "color": { "field": "measure_label", "legend": null } },
              "transform": [{ "filter": { "field": "measure_label", "oneOf": ["Current"] } }]
            },
            {
              "mark": { "type": "tick", "tooltip": true, "thickness": 3 },
              "encoding": { "color": { "field": "measure_label", "legend": null } },
              "transform": [{ "filter": { "field": "measure_label", "oneOf": ["Target"] } }]
            }
          ],
          "encoding": {
            "x": {
              "field": "measure_value",
              "type": "quantitative",
              "stack": null,
              "title": "Value",
              "axis": { "orient": "bottom" }
            },
            "color": {
              "scale": {
                "domain": ["Target", "Pace", "Current"],
                "range": ["#000000", "#bcbcbc", "#A66BBF"]
              }
            },
            "order": {
              "field": "measure_order",
              "type": "quantitative",
              "sort": "descending"
            }
          }
        }
      ],
      "encoding": {
        "y": {
          "field": "categoryField",
          "type": "ordinal",
          "title": "Category",
          "axis": { "labelOverlap": true }
        },
        "tooltip": [
          { "field": "categoryField", "type": "nominal", "title": "Category" },
          { "field": "currentField", "type": "quantitative", "title": "Current" },
          { "field": "paceField", "type": "quantitative", "title": "Pace" },
          { "field": "targetField", "type": "quantitative", "title": "Target" }
        ]
      }
    }
  ]
}
仪表
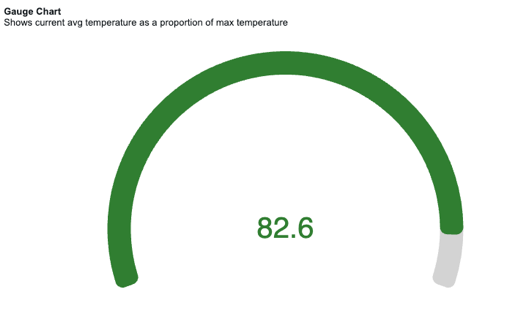
在$valueField部分中定义$totalField和。
JSON 规范
{
  "$schema": "https://vega.github.io/schema/vega-lite/v6.json",
  "width": "container",
  "height": "container",
  "data": { "name": "databricks_query" },
  "config": {
    "concat": { "spacing": 0 },
    "autosize": { "type": "fit", "contains": "padding" }
  },
  "params": [
    { "name": "ring_max", "expr": "min(width, height) / 2 - 16" },
    { "name": "ring_width", "expr": "max(12, (min(width, height) / 2) * 0.12)" },
    { "name": "ring_gap", "expr": "max(4, (min(width, height) / 2) * 0.03)" },
    { "name": "label_color", "value": "#000000" },
    { "name": "ring_background_opacity", "value": 0.3 },
    { "name": "ring0_percent", "value": 100 },
    { "name": "ring0_outer", "expr": "ring_max + 2" },
    { "name": "ring0_inner", "expr": "ring_max + 1" },
    { "name": "ring1_outer", "expr": "ring0_inner - ring_gap" },
    { "name": "ring1_inner", "expr": "ring1_outer - ring_width" },
    { "name": "ring1_middle", "expr": "(ring1_outer + ring1_inner) / 2" },
    { "name": "arc_size", "expr": "220" }
  ],
  "transform": [
    { "as": "ratio", "calculate": "datum['$valueField'] / datum['$totalField']" },
    { "as": "_arc_start_degrees", "calculate": "360 - ( arc_size / 2 )" },
    { "as": "_arc_end_degrees", "calculate": "0 + ( arc_size / 2 )" },
    { "as": "_arc_start_radians", "calculate": "2 * 3.14 * ( datum['_arc_start_degrees'] - 360 ) / 360" },
    { "as": "_arc_end_radians", "calculate": "2 * 3.14 * datum['_arc_end_degrees'] / 360" },
    { "as": "_arc_total_radians", "calculate": "datum['_arc_end_radians'] - datum['_arc_start_radians']" },
    { "as": "_ring_start_radians", "calculate": "datum['_arc_start_radians']" },
    {
      "as": "_ring_end_radians",
      "calculate": "datum['_arc_start_radians'] + ( datum['_arc_total_radians'] * datum['ratio'] )"
    }
  ],
  "layer": [
    {
      "mark": {
        "type": "arc",
        "color": "lightgrey",
        "theta": { "expr": "datum['_arc_start_radians']" },
        "radius": { "expr": "ring1_outer" },
        "theta2": { "expr": "datum['_arc_end_radians']" },
        "radius2": { "expr": "ring1_inner" },
        "cornerRadius": 10
      }
    },
    {
      "name": "RING",
      "mark": {
        "type": "arc",
        "theta": { "expr": "datum['_ring_start_radians']" },
        "radius": { "expr": "ring1_outer" },
        "theta2": { "expr": "datum['_ring_end_radians']" },
        "radius2": { "expr": "ring1_inner" },
        "cornerRadius": 10
      },
      "encoding": {
        "color": {
          "value": "#307E31",
          "condition": [
            { "test": "datum['ratio'] < 0.33", "value": "#880808" },
            { "test": "datum['ratio'] < 0.66", "value": "#E49B0F" }
          ]
        }
      }
    },
    {
      "mark": { "type": "text", "fontSize": 40 },
      "encoding": {
        "text": { "field": "$valueField" },
        "color": {
          "value": "#307E31",
          "condition": [
            { "test": "datum['ratio'] < 0.33", "value": "#880808" },
            { "test": "datum['ratio'] < 0.66", "value": "#E49B0F" }
          ]
        }
      }
    }
  ]
}
雷达图
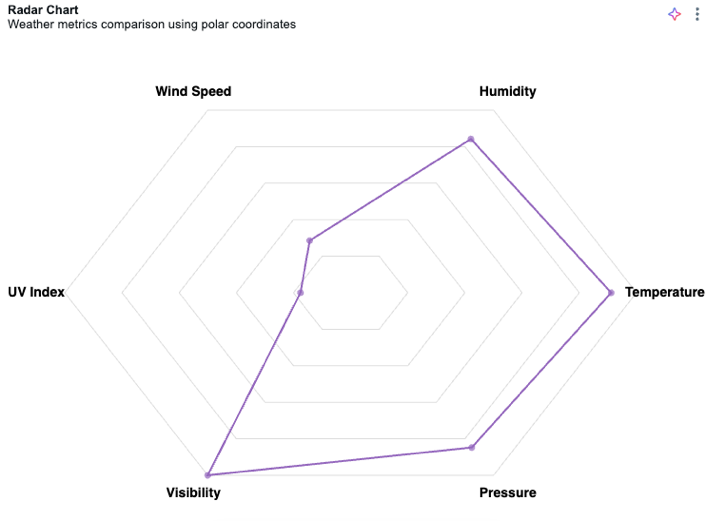
在$key部分中定义$value和。
JSON 规范
{
  "$schema": "https://vega.github.io/schema/vega-lite/v5.json",
  "width": "container",
  "height": "container",
  "config": {
    "autosize": { "type": "fit", "contains": "padding" }
  },
  "data": { "name": "databricks_query" },
  "transform": [
    { "window": [{ "op": "row_number", "as": "category" }] },
    { "calculate": "datum.category - 1", "as": "category" },
    {
      "joinaggregate": [
        { "op": "count", "as": "numCategories" },
        { "op": "max", "field": "$value", "as": "maxValue" }
      ]
    },
    { "calculate": "2 * PI * datum.category / datum.numCategories", "as": "angle" },
    { "calculate": "100 * datum['$value'] / datum.maxValue", "as": "r" },
    { "calculate": "datum.r * cos(datum.angle)", "as": "x" },
    { "calculate": "datum.r * sin(datum.angle)", "as": "y" },
    { "calculate": "110 * cos(datum.angle)", "as": "label_x" },
    { "calculate": "110 * sin(datum.angle)", "as": "label_y" }
  ],
  "layer": [
    {
      "transform": [
        { "joinaggregate": [{ "op": "count", "as": "numCategories" }] },
        { "aggregate": [{ "op": "max", "field": "numCategories", "as": "numCategories" }] },
        { "calculate": "[0,1,2,3,4,5,6,7,8,9,10,11,12,13,14,15,16,17,18,19,20]", "as": "cats" },
        { "flatten": ["cats"], "as": ["cat"] },
        { "filter": "datum.cat <= datum.numCategories" },
        { "calculate": "2 * PI * datum.cat / datum.numCategories", "as": "angle" },
        { "calculate": "100 * cos(datum.angle)", "as": "x" },
        { "calculate": "100 * sin(datum.angle)", "as": "y" }
      ],
      "mark": { "type": "line", "color": "#ddd", "strokeWidth": 1 },
      "encoding": {
        "x": { "field": "x", "type": "quantitative", "scale": { "domain": [-120, 120] }, "axis": null },
        "y": { "field": "y", "type": "quantitative", "scale": { "domain": [-120, 120] }, "axis": null },
        "order": { "field": "cat" }
      }
    },
    {
      "transform": [
        { "joinaggregate": [{ "op": "count", "as": "numCategories" }] },
        { "aggregate": [{ "op": "max", "field": "numCategories", "as": "numCategories" }] },
        { "calculate": "[20,40,60,80,100]", "as": "levels" },
        { "flatten": ["levels"], "as": ["level"] },
        { "calculate": "[0,1,2,3,4,5,6,7,8,9,10,11,12,13,14,15,16,17,18,19,20]", "as": "cats" },
        { "flatten": ["cats"], "as": ["cat"] },
        { "filter": "datum.cat <= datum.numCategories" },
        { "calculate": "2 * PI * datum.cat / datum.numCategories", "as": "angle" },
        { "calculate": "datum.level", "as": "r" },
        { "calculate": "datum.r * cos(datum.angle)", "as": "x" },
        { "calculate": "datum.r * sin(datum.angle)", "as": "y" }
      ],
      "mark": { "type": "line", "color": "#ddd", "strokeWidth": 1 },
      "encoding": {
        "x": { "field": "x", "type": "quantitative" },
        "y": { "field": "y", "type": "quantitative" },
        "detail": { "field": "level" },
        "order": { "field": "cat" }
      }
    },
    {
      "mark": { "type": "line", "color": "#9467bd", "strokeWidth": 2, "interpolate": "linear-closed" },
      "encoding": {
        "x": { "field": "x", "type": "quantitative" },
        "y": { "field": "y", "type": "quantitative" },
        "order": { "field": "category" }
      }
    },
    {
      "mark": { "type": "point", "filled": true, "size": 50, "color": "#9467bd" },
      "encoding": {
        "x": { "field": "x", "type": "quantitative" },
        "y": { "field": "y", "type": "quantitative" }
      }
    },
    {
      "mark": { "type": "text", "fontSize": 14, "fontWeight": "bold" },
      "encoding": {
        "x": { "field": "label_x", "type": "quantitative" },
        "y": { "field": "label_y", "type": "quantitative" },
        "text": { "field": "$key", "type": "nominal" }
      }
    }
  ],
  "view": { "stroke": null }
}
径向图表
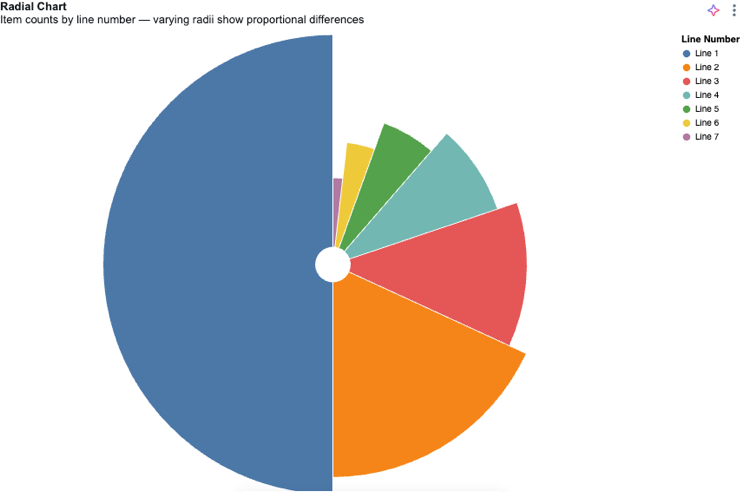
在$valueField部分中定义$colorField和。
JSON 规范
{
  "$schema": "https://vega.github.io/schema/vega-lite/v6.json",
  "width": "container",
  "height": "container",
  "config": {
    "autosize": { "type": "fit", "contains": "padding" }
  },
  "data": { "name": "databricks_query" },
  "transform": [
    {
      "aggregate": [{ "op": "sum", "field": "$valueField", "as": "total" }],
      "groupby": ["$colorField"]
    },
    {
      "window": [{ "op": "rank", "as": "rank" }],
      "sort": [{ "field": "total", "order": "descending" }]
    }
  ],
  "layer": [
    {
      "mark": { "type": "arc", "innerRadius": 20, "stroke": "#fff" }
    }
  ],
  "encoding": {
    "theta": {
      "field": "total",
      "type": "quantitative",
      "scale": { "type": "sqrt" },
      "stack": true,
      "sort": "descending"
    },
    "radius": { "field": "total", "scale": { "type": "sqrt", "zero": true } },
    "color": {
      "field": "$colorField",
      "type": "nominal",
      "title": "Sub-Category",
      "sort": { "field": "total", "order": "descending" },
      "legend": { "orient": "right" }
    },
    "tooltip": [
      { "field": "$colorField", "type": "nominal", "title": "Sub-Category" },
      { "field": "total", "type": "quantitative", "title": "Sales" }
    ]
  },
  "view": { "stroke": null }
}
旭日图
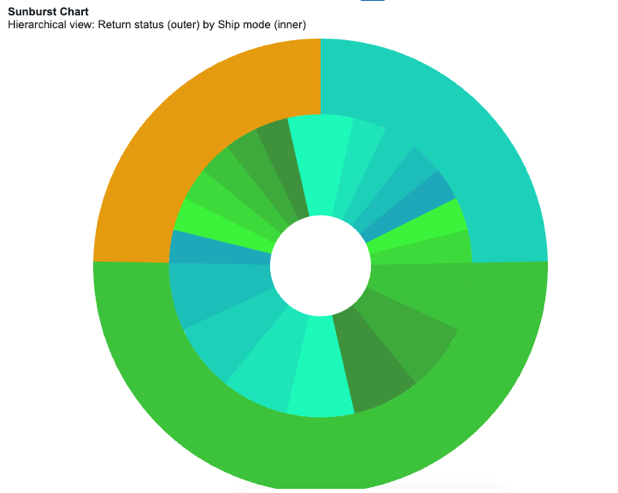
在outerGroupField部分中定义 innerGroupField、sizeField 和 。
JSON 规范
{
  "$schema": "https://vega.github.io/schema/vega-lite/v5.json",
  "width": "container",
  "height": "container",
  "data": { "name": "databricks_query" },
  "config": {
    "autosize": { "type": "fit", "contains": "padding" }
  },
  "transform": [
    { "calculate": "datum['outerGroupField']", "as": "OUTSIDE" },
    { "calculate": "datum['innerGroupField']", "as": "INSIDE" },
    { "calculate": "datum.OUTSIDE + '-' + datum.INSIDE", "as": "OUT_IN" },
    { "calculate": "toNumber(datum['sizeField'])", "as": "SIZE" }
  ],
  "resolve": {
    "scale": { "color": "independent" },
    "legend": { "color": "independent" }
  },
  "layer": [
    {
      "mark": {
        "type": "arc",
        "tooltip": true,
        "innerRadius": { "expr": "min(width, height)/9" },
        "outerRadius": { "expr": "min(width, height)/3" }
      },
      "encoding": {
        "theta": { "field": "SIZE", "type": "quantitative", "stack": true },
        "color": {
          "field": "OUT_IN",
          "type": "ordinal",
          "sort": "ascending",
          "title": "Inner Grouping",
          "scale": {
            "range": [
              "#1DF9B9",
              "#1DE5B9",
              "#1DD1B9",
              "#1DBDB9",
              "#1DA9B9",
              "#3DF23B",
              "#3DDA3B",
              "#3DC23B",
              "#3DAA3B",
              "#3D923B"
            ]
          }
        },
        "order": { "field": "OUT_IN", "sort": "ascending" },
        "tooltip": [
          { "field": "OUTSIDE", "type": "nominal", "title": "Outer Grouping" },
          { "field": "INSIDE", "type": "nominal", "title": "Inner Grouping" },
          { "field": "SIZE", "type": "quantitative", "title": "Count" }
        ]
      }
    },
    {
      "transform": [
        {
          "aggregate": [{ "op": "sum", "field": "SIZE", "as": "total_users" }],
          "groupby": ["OUTSIDE"]
        }
      ],
      "mark": {
        "type": "arc",
        "tooltip": true,
        "innerRadius": { "expr": "min(width, height)/3" }
      },
      "encoding": {
        "theta": {
          "field": "total_users",
          "type": "quantitative",
          "stack": true,
          "sort": "ascending",
          "title": "Users Count"
        },
        "color": {
          "field": "OUTSIDE",
          "type": "ordinal",
          "sort": "ascending",
          "title": "Outer Grouping",
          "scale": { "range": ["#1DD1B9", "#3DC23B"] }
        },
        "order": { "field": "OUTSIDE", "sort": "ascending" },
        "tooltip": [
          { "field": "OUTSIDE", "type": "nominal", "title": "Outer Grouping" },
          { "field": "total_users", "type": "quantitative", "title": "Count" }
        ]
      }
    }
  ]
}
Limitations
- 不支持树状图。 Vega-Lite 不支持树状图。
- 图像标记仅支持以 PNG、JPEG 或 WebP 格式表示的内联 base64
data:图像 URL(例如data:image/png;base64,...),大小为 37 KB 或更少。 不支持远程图片 URL(https:或http:)、相对 URL、SVG 图像以及由字段或表达式驱动的图片 URL。