你当前正在访问 Microsoft Azure Global Edition 技术文档网站。 如果需要访问由世纪互联运营的 Microsoft Azure 中国技术文档网站,请访问 https://docs.azure.cn。
Microsoft Sentinel中的自定义图形使安全研究人员和分析师能够创建其安全数据的定制图形表示形式。 通过构建自定义图形,可以对特定攻击模式进行建模、调查威胁,并运行高级图形算法来发现数字环境中隐藏的关系。 本指南将指导你完成使用 Microsoft Sentinel Visual Studio Code 扩展中的 Jupyter 笔记本创建和管理自定义图形的步骤。
本文重点介绍如何使用代码手动创作自定义图形。 有关 AI 驱动的体验,请参阅 Microsoft Sentinel 中的 AI 辅助自定义图形创作。
先决条件
在 Microsoft Sentinel 中创建自定义图形需要满足以下条件:
- Visual Studio Code 的Microsoft Sentinel扩展。 有关详细信息,请参阅在 Microsoft Sentinel data Lake 上运行笔记本。
- Visual Studio Code的 Jupyter 扩展。
- Microsoft Sentinel配置了适当权限的数据湖。 有关详细信息,请参阅载入到Microsoft Sentinel数据湖。
启用 Microsoft Entra ID 连接器以引入本文示例代码中使用的Microsoft Entra资产表。 有关详细信息,请参阅 Microsoft Sentinel data Lake 中的资产数据引入。
权限
若要与自定义图形交互,需要在数据湖Sentinel以下 XDR 权限。 下表列出了常见图形操作的权限要求:
| 图形操作 | 所需的权限 |
|---|---|
| 为笔记本图建模和生成笔记本图 | 使用具有数据的自定义Microsoft Defender XDR统一 RBAC 角色 (管理Microsoft Sentinel数据收集的) 权限。 |
| 在租户中保留图形 | 使用以下Microsoft Entra ID角色之一: 安全操作员 安全管理员 全局管理员 |
| 查询持久化图形 | 使用具有安全数据基础知识的自定义Microsoft Defender XDR统一 RBAC 角色, (读取Microsoft Sentinel数据收集) 权限。 |
重要
必须有权读取图形中使用的数据。 如果无权访问特定数据集,该数据将不会包含在图形中。 若要创建图形,不得受Sentinel范围的限制。 作用域内用户无法创建自定义图形。
Microsoft Entra ID角色提供跨数据湖中所有工作区的广泛访问权限。 有关详细信息,请参阅 Microsoft Sentinel 中的角色和权限。
安装 Visual Studio Code 和 Microsoft Sentinel 扩展
使用 Microsoft Sentinel Visual Studio Code 扩展中的 Jupyter 笔记本创建自定义图形。 有关详细信息,请参阅安装Visual Studio Code和Microsoft Sentinel扩展
创建自定义图形
若要创建和使用自定义图形,请完成以下步骤:
- 为自定义图形建模
- 通过计划图形作业来保留自定义图形
- 查看和管理自定义图形
为自定义图形建模
使用 Microsoft Sentinel Visual Studio Code 扩展中的 Jupyter 笔记本创建自定义图形。
以下步骤将引导你使用示例笔记本创建第一个自定义图形。
设置笔记本并连接到数据湖
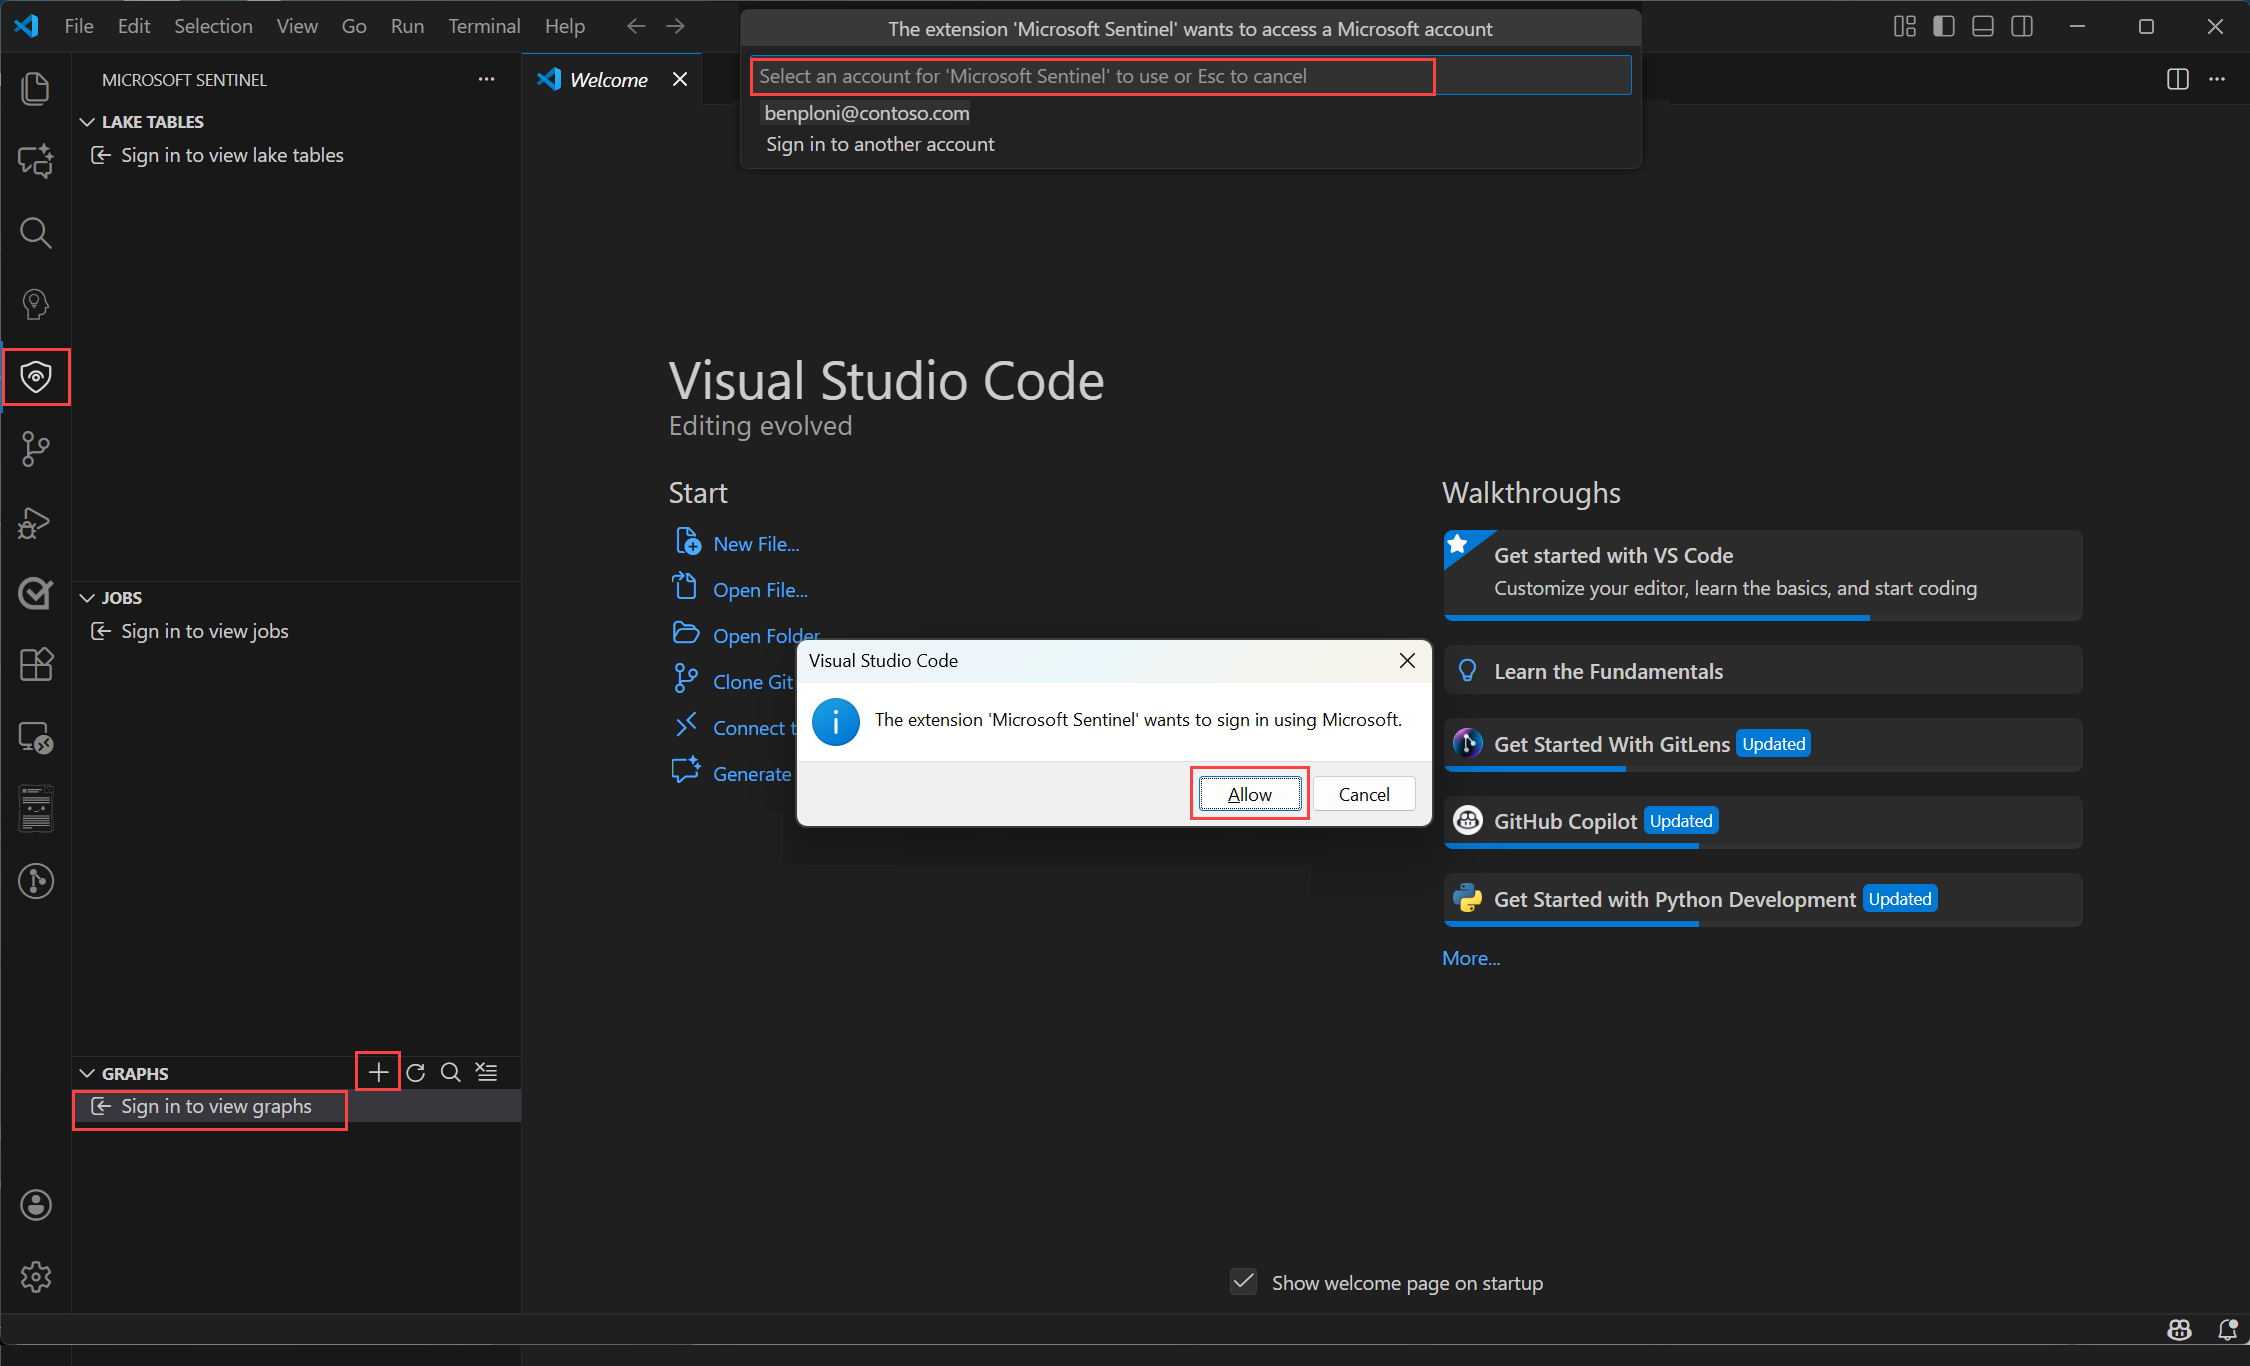
在安装了 Microsoft Sentinel 扩展的Visual Studio Code中,选择左侧菜单中的“Microsoft Sentinel”图标。
选择“ 登录”以查看图形
此时将显示一个对话框,其中包含扩展名“Microsoft Sentinel”想要使用Microsoft登录的文本。 选择 “允许” 以登录。
使用凭据登录。
登录后,选择 + 并选择“ 创建新笔记本”。
命名笔记本文件并将其保存在工作区中的相应位置。
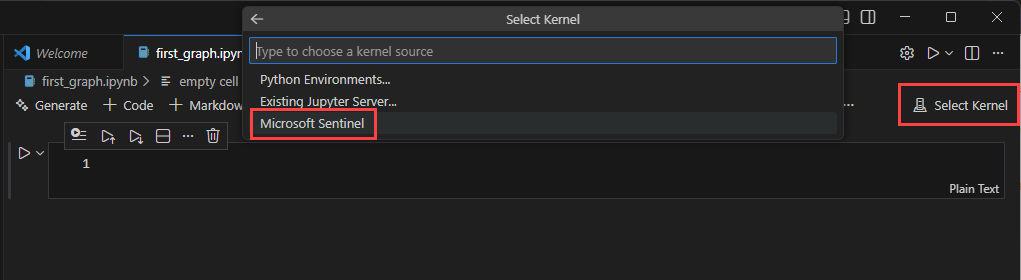
选择笔记本窗口右上角的 “选择内核” ,选择 Spark 计算池。
选择“Microsoft Sentinel”,然后选择任何可用的 Spark 池。
提示
可以使用 AI 提示来帮助创建自定义图形笔记本。 有关详细信息,请参阅 Microsoft Sentinel 中的 AI 辅助自定义图形创作。
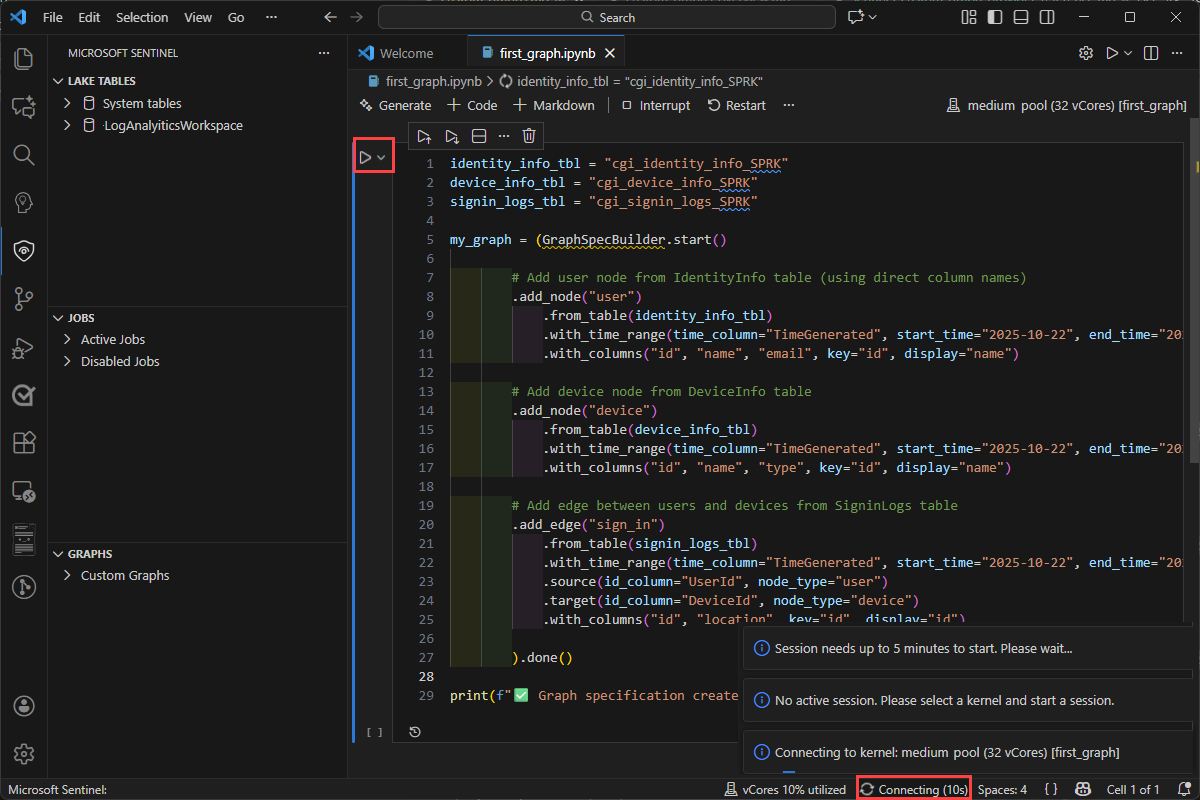
通过选择单元格左侧的运行单元格三角形图标,将单元格运行到 。 首次运行单元格时,如果尚未选择内核,系统可能会提示你选择内核。
首次运行单元格时,大约需要 5 分钟才能启动 Spark 会话。


创建图形
以下示例创建一个图形来遍历Microsoft Entra组成员身份并了解嵌套组关系。 示例代码可帮助你开始使用一个简单的用例,了解自定义图形功能,并利用图形遍历的强大功能进行调查。 可以从 Sentinel data Lake 中的任何可用表创建图形。
连接到工作区并读取Entra资产表以开始构建图形。
from pyspark.sql import functions as F
from sentinel_lake.providers import MicrosoftSentinelProvider

lake_provider = MicrosoftSentinelProvider(spark=spark)

# Use the "System tables" workspace which contains the Entra* Assets tables
# If you are data is in a different workspace, update this variable accordingly and ensure the tables are present
LOG_ANALYTICS_WORKSPACE = "System tables"

# Dynamically get the latest snapshot time from EntraUsers
snapshot_time = (
    lake_provider.read_table("EntraUsers", LOG_ANALYTICS_WORKSPACE)
    .df.agg(F.max("_SnapshotTime").alias("max_snapshot"))
    .collect()[0]["max_snapshot"]
    .strftime("%Y-%m-%dT%H:%M:%SZ")
)
print(f"Using snapshot_time: {snapshot_time}")

snapshot_filter = (F.col("_SnapshotTime") == F.lit(snapshot_time).cast("timestamp"))

# Load EntraMembers - edges: group contains user/group/servicePrincipal
df_members = (
    lake_provider.read_table("EntraMembers", LOG_ANALYTICS_WORKSPACE)
    .filter(
        snapshot_filter
        & (F.col("sourceType") == "group")
        & (F.col("targetType").isin("user", "group", "servicePrincipal"))
    )
)

# Load EntraGroups - nodes
df_groups = (
    lake_provider.read_table("EntraGroups", LOG_ANALYTICS_WORKSPACE)
    .filter(snapshot_filter)
    .select("id", "displayName", "mailEnabled")
)

# Load EntraUsers - nodes
df_users = (
    lake_provider.read_table("EntraUsers", LOG_ANALYTICS_WORKSPACE)
    .filter(snapshot_filter)
    .select("id", "accountEnabled", "displayName", "department",
            "lastPasswordChangeDateTime", "userPrincipalName", "usageLocation")
)

# Load EntraServicePrincipals - nodes
df_service_principals = (
    lake_provider.read_table("EntraServicePrincipals", LOG_ANALYTICS_WORKSPACE)
    .filter(snapshot_filter)
    .select("accountEnabled", "id", "displayName", "servicePrincipalType",
            "tenantId", "organizationId")
)

# Fix for Spark 3.x Parquet datetime rebase issue. Required when reading Parquet files
# written by Spark 2.x which used the Julian calendar, whereas Spark 3.x uses Proleptic
# Gregorian. Without these settings, timestamp columns (e.g. lastPasswordChangeDateTime)
# may throw errors or return incorrect values. Safe to remove if all data was written by
# Spark 3.x (typical for current Fabric/Sentinel environments).
spark.conf.set("spark.sql.parquet.datetimeRebaseModeInRead", "CORRECTED")
spark.conf.set("spark.sql.parquet.datetimeRebaseModeInWrite", "CORRECTED")
spark.conf.set("spark.sql.parquet.int96RebaseModeInRead", "CORRECTED")
spark.conf.set("spark.sql.parquet.int96RebaseModeInWrite", "CORRECTED")
准备生成图形所需的节点和边缘数据帧
# ============================================================
# NODE PREPARATION
# ============================================================

# EntraUser nodes - keyed by user id
user_nodes = (
    df_users.df
    .select(
        F.col("id"),
        F.col("displayName"),
        F.col("accountEnabled"),
        F.col("department"),
        F.col("lastPasswordChangeDateTime"),
        F.col("userPrincipalName"),
        F.col("usageLocation")
    )
)

# EntraGroup nodes - keyed by group id
group_nodes = (
    df_groups.df
    .select(
        F.col("id"),
        F.col("displayName"),
        F.col("mailEnabled")
    )
)

# EntraServicePrincipal nodes - keyed by SP id
sp_nodes = (
    df_service_principals.df
    .select(
        F.col("id"),
        F.col("displayName"),
        F.col("accountEnabled"),
        F.col("servicePrincipalType"),
        F.col("tenantId"),
        F.col("organizationId")
    )
)

# ============================================================
# EDGE PREPARATION
# ============================================================

# Edge: EntraGroup --Contains--> EntraUser
edge_group_contains_user = (
    df_members.df
    .filter(F.col("targetType") == "user")
    .select(
        F.col("sourceId").alias("SourceGroupId"),
        F.col("targetId").alias("TargetUserId")
    )
    .distinct()
    .withColumn("EdgeKey", F.concat_ws("_", F.col("SourceGroupId"), F.col("TargetUserId")))
)

# Edge: EntraGroup --Contains--> EntraGroup (nested groups)
edge_group_contains_group = (
    df_members.df
    .filter(F.col("targetType") == "group")
    .select(
        F.col("sourceId").alias("SourceGroupId"),
        F.col("targetId").alias("TargetGroupId")
    )
    .distinct()
    .withColumn("EdgeKey", F.concat_ws("_", F.col("SourceGroupId"), F.col("TargetGroupId")))
)

# Edge: EntraGroup --Contains--> EntraServicePrincipal
edge_group_contains_sp = (
    df_members.df
    .filter(F.col("targetType") == "servicePrincipal")
    .select(
        F.col("sourceId").alias("SourceGroupId"),
        F.col("targetId").alias("TargetSPId")
    )
    .distinct()
    .withColumn("EdgeKey", F.concat_ws("_", F.col("SourceGroupId"), F.col("TargetSPId")))
)
定义图形架构并绑定到在上一步中创建的数据帧
from sentinel_graph import GraphSpecBuilder, Graph

# Define the graph schema

entra_group_graph_spec = (
    GraphSpecBuilder.start()

    # === NODES ===

    .add_node("EntraUser")
    .from_dataframe(user_nodes)  # Native Spark DataFrame (from .df + .select + .distinct)
    .with_columns(
        "id", "displayName", "accountEnabled",
        "department", "lastPasswordChangeDateTime", "userPrincipalName", "usageLocation",
        key="id", display="displayName"
    )

    .add_node("EntraGroup")
    .from_dataframe(group_nodes)  # Native Spark DataFrame
    .with_columns(
        "id", "displayName", "mailEnabled",
        key="id", display="displayName"
    )

    .add_node("EntraServicePrincipal")
    .from_dataframe(sp_nodes)  # Native Spark DataFrame
    .with_columns(
        "id", "displayName", "accountEnabled",
        "servicePrincipalType", "tenantId", "organizationId",
        key="id", display="displayName"
    )

    # === EDGES ===

    # EntraGroup --ContainsUser--> EntraUser
    .add_edge("ContainsUser")
    .from_dataframe(edge_group_contains_user)  # Native Spark DataFrame
    .source(id_column="SourceGroupId", node_type="EntraGroup")
    .target(id_column="TargetUserId", node_type="EntraUser")
    .with_columns("SourceGroupId", "TargetUserId", "EdgeKey",
                  key="EdgeKey", display="EdgeKey")

    # EntraGroup --ContainsGroup--> EntraGroup (nested groups)
    .add_edge("ContainsGroup")
    .from_dataframe(edge_group_contains_group)  # Native Spark DataFrame
    .source(id_column="SourceGroupId", node_type="EntraGroup")
    .target(id_column="TargetGroupId", node_type="EntraGroup")
    .with_columns("SourceGroupId", "TargetGroupId", "EdgeKey",
                  key="EdgeKey", display="EdgeKey")

    # EntraGroup --ContainsServicePrincipal--> EntraServicePrincipal
    .add_edge("ContainsServicePrincipal")
    .from_dataframe(edge_group_contains_sp)  # Native Spark DataFrame
    .source(id_column="SourceGroupId", node_type="EntraGroup")
    .target(id_column="TargetSPId", node_type="EntraServicePrincipal")
    .with_columns("SourceGroupId", "TargetSPId", "EdgeKey",
                  key="EdgeKey", display="EdgeKey")

).done()
验证图形架构
# Check the schema of the graph spec to ensure it's correct
entra_group_graph_spec.show_schema()
生成图形,包括准备数据和发布图形
# Build the graph from the spec - this will validate the spec and prepare it for querying
# Alter options is to use Graph.prepare() to prepare the graph nodes and edges in the lake
# and then use Graph.publish() to create the graph. You would typically call prepare() and publish()
# seperately to understand the cost of Graph API calls that are triggeterd by Graph.publish()
# see https://learn.microsoft.com/azure/sentinel/billing?tabs=simplified%2Ccommitment-tiers
intra_group_graph = Graph.build(entra_group_graph_spec)
注意
关闭笔记本会话时,将删除在交互式笔记本会话期间创建的图形。 若要保留图形以供重用和共享,请参阅 持久保存自定义图形
现已在笔记本中创建图形。
若要显示图形的可视表示形式,请在新单元格中粘贴并运行以下代码:
# Query 1: Find nested group relationships nexting up to 8 levels deep
# Update the Entra Group name that you want to traverse from
query_nested_groups = """
MATCH p=(g1:EntraGroup)-[cg]->{1,8}(g2)
WHERE g1.displayName = 'tmplevel3'
RETURN *
"""
intra_group_graph.query(query_nested_groups).show()
此代码运行示例图形查询语言 (GQL) 查询,以检索所有嵌套组成员身份(最多 8 个级别深) 生成的图形在输出中可视化

保留自定义图形
在笔记本中创建图形代码后,可以在交互式会话中运行笔记本或计划图形作业。 在交互式笔记本会话期间创建的图形是临时的,仅在笔记本会话的上下文中可用。 若要保存图形并与团队共享,请计划图形作业以经常重新生成图形。 保存图形后,可从:Sentinel下的Microsoft Defender门户中的图形体验、Visual Studio Code笔记本和图形查询 API 进行访问。
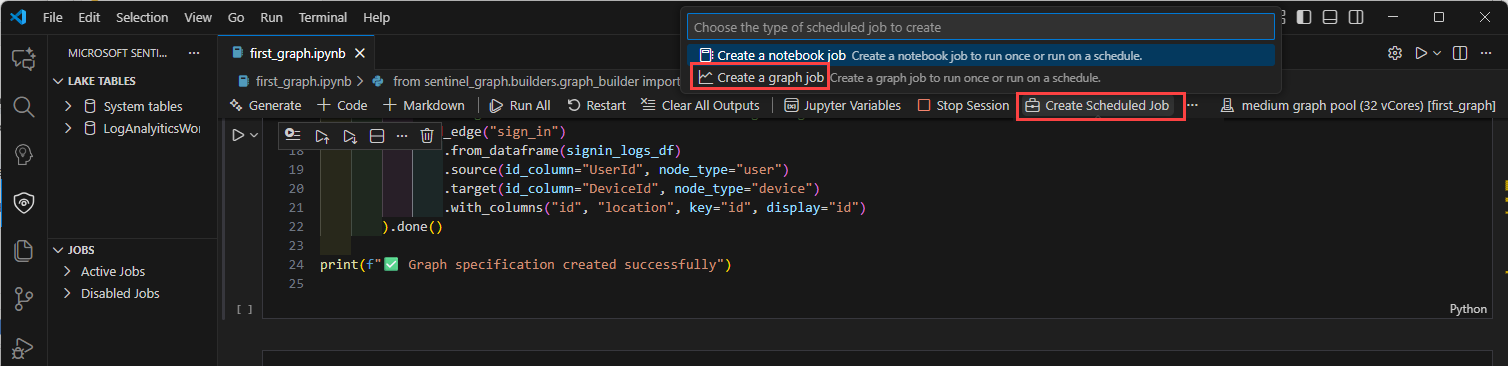
在图形笔记本中,选择“ 创建计划作业”,然后选择“ 创建图形作业”。
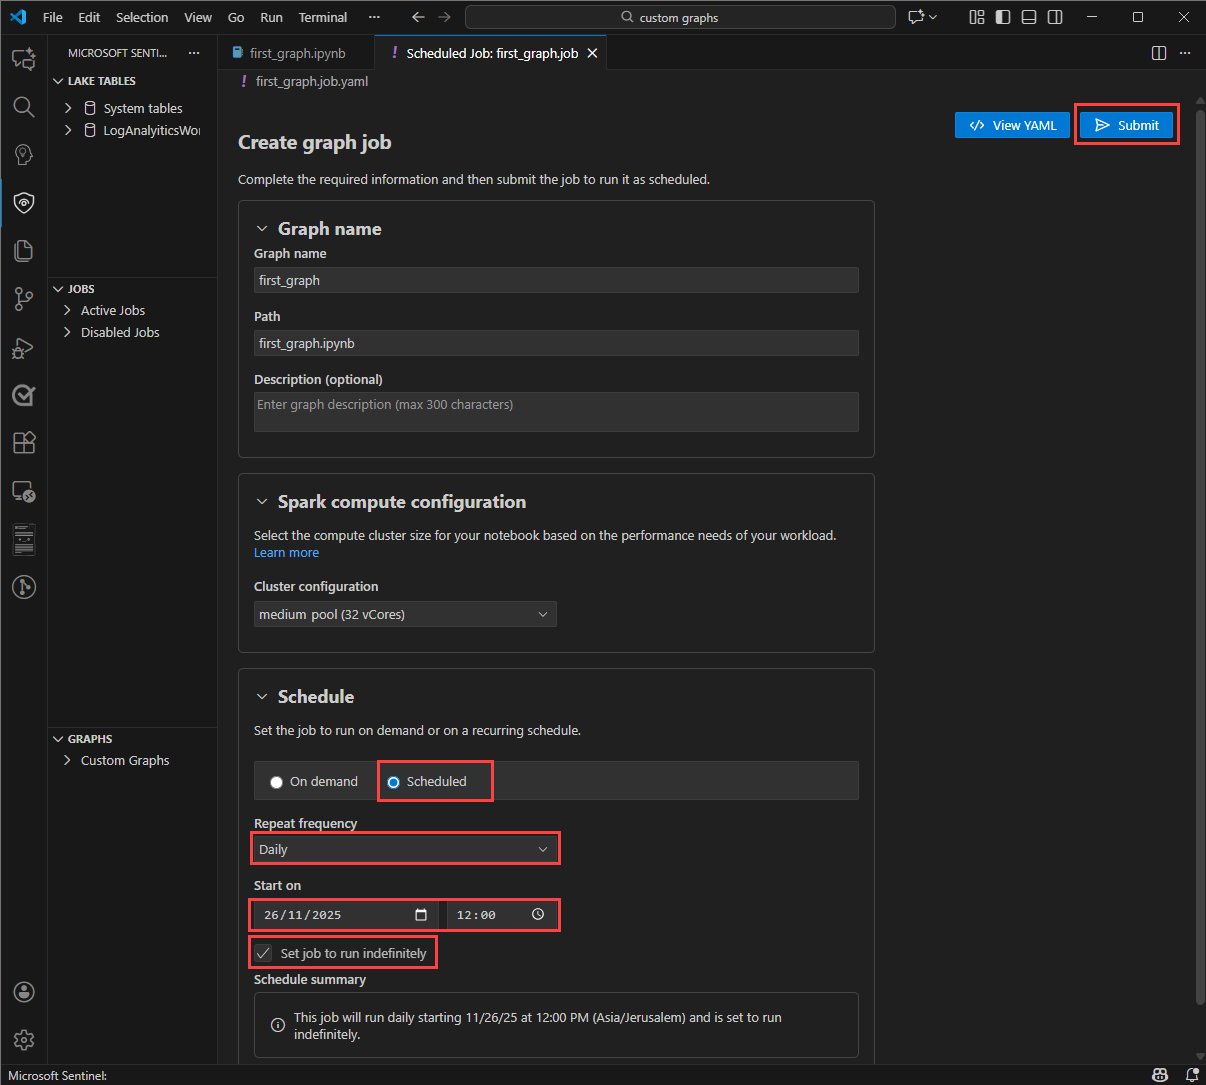
在“创建图形作业”窗体中,输入“图形名称”和“说明”,并验证“路径”中是否包含正确的图形笔记本。
若要在不配置刷新计划的情况下生成图形,请在“计划”部分选择“按需”,然后选择“提交”以创建图形。
注意
使用按需计划创建的图形的默认保留期为 30 天,并在过期时删除。
若要生成图形数据定期刷新的图形,请在“ 计划 ”部分选择“ 计划 ”。
为作业选择 “重复”频率 。 可以选择“按分钟”、“每小时”、“每周”、“每日”或“每月”。
将显示更多选项来配置计划,具体取决于选择的频率。 例如,星期几、一天中的时间或月份中的某一天。
选择“ 准时开始” ,让计划开始运行。
为计划选择“ 结束 时间”以停止运行。 如果不想为计划设置结束时间,请选择“ 将作业设置为无限期运行”。 日期和时间位于时区。
选择“ 提交 ”以保存作业配置并发布作业。 图形生成过程在租户中启动。 在 Sentinel 扩展中查看新创建的图形及其最新状态。


查看和管理自定义图形
创建图形作业后,可以从 Visual Studio Code 中的 Microsoft Sentinel 扩展查看和管理租户中的图形。
从图形列表中,选择具体化图形以查看其详细信息。
选择“ 作业详细信息 ”选项卡可查看图形作业的状态,包括上次运行时、下一次运行时以及生成过程中遇到的任何错误。
选择“ 立即运行” 以在计划时间之外手动触发图形生成。 生成图形时, “状态 ”更改为“ 排队”,然后变为“正在进行”。
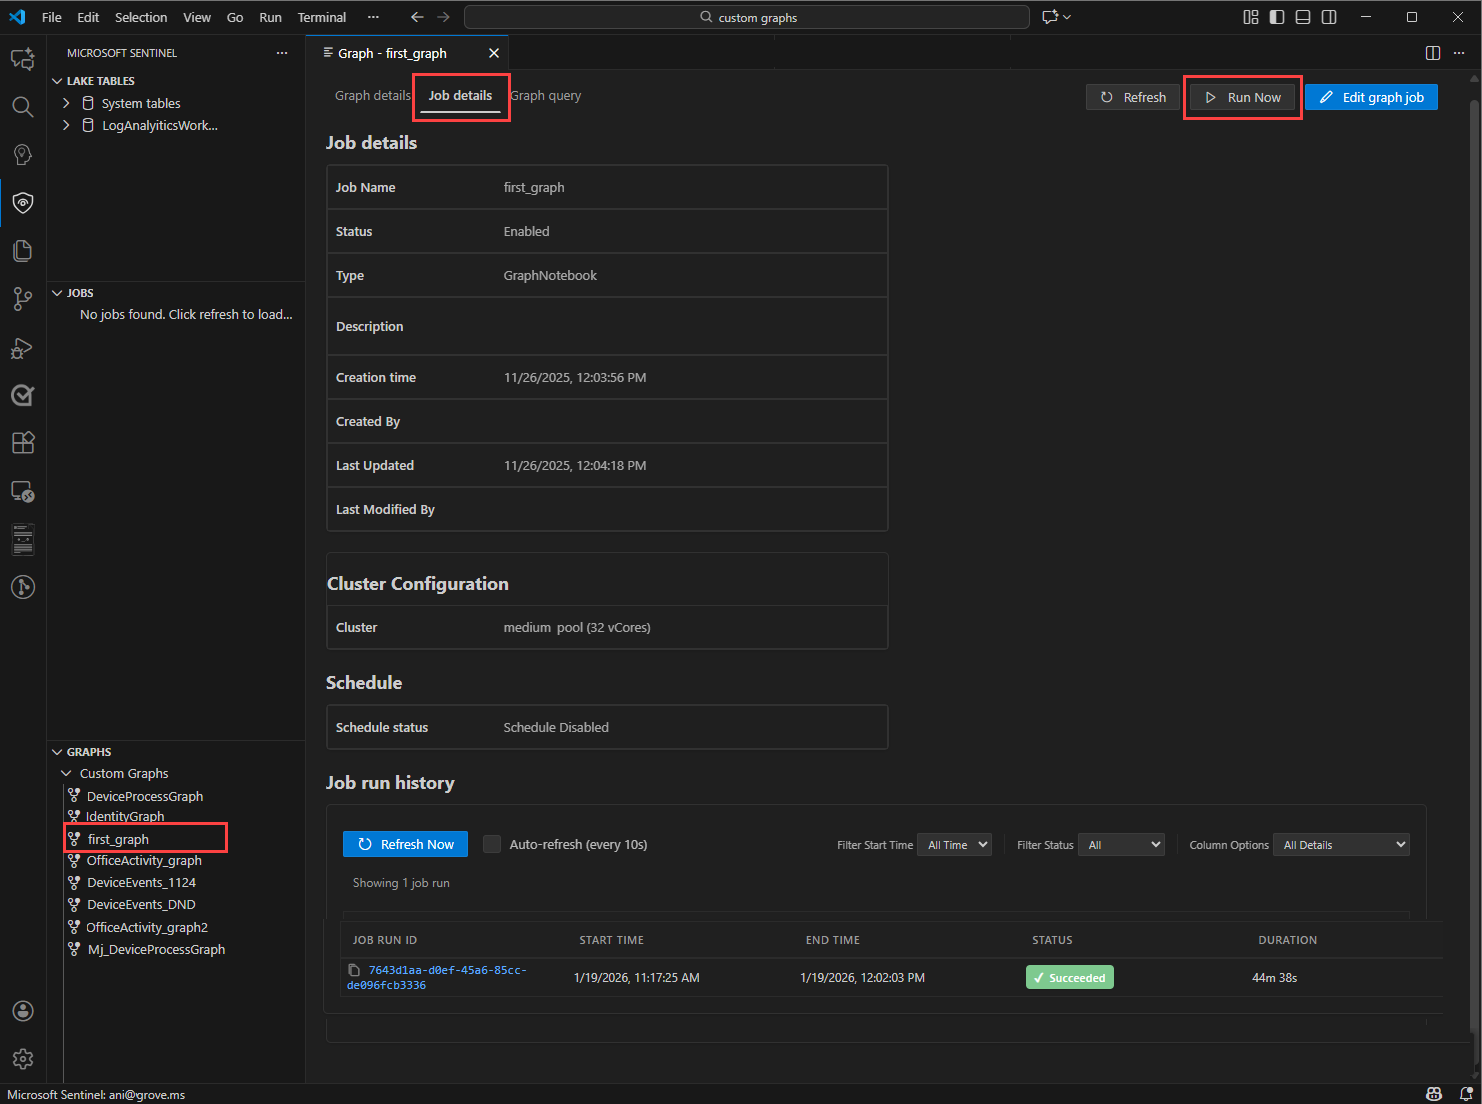
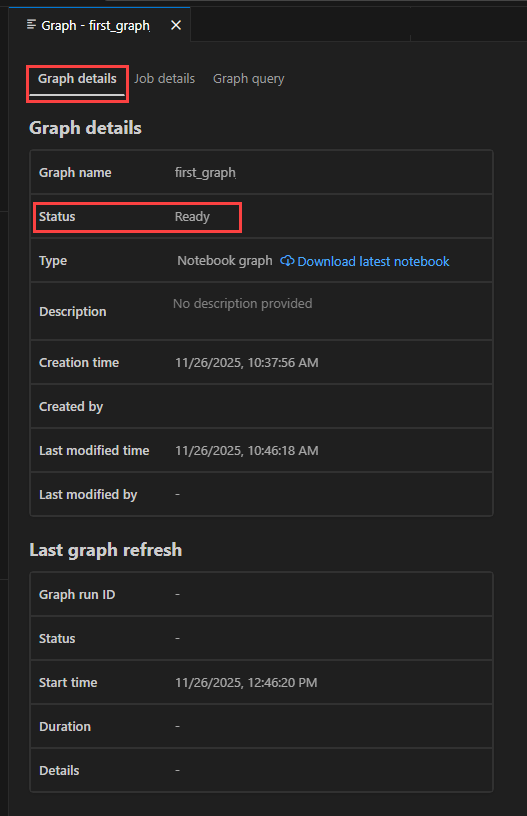
图形生成完成后, “状态” 将更新为 “就绪”。 选择“ 图形详细信息 ”选项卡以查看有关图形的信息。
现在可以从 Defender 门户中Microsoft Sentinel的图形可视化效果中查询和可视化图形。 有关详细信息,请参阅可视化Microsoft Sentinel图形中的图形 (预览) 。

