本文介绍如何在 Microsoft Fabric 中使用可解释的提升计算机(EBM)来训练回归模型。 EBM 是一种机器学习技术,它结合了梯度提升的强大功能,并强调模型可解释性。 EBM 创建决策树的混合,类似于梯度提升,但侧重于生成人类可读的模型。 EBM 为这些预测提供准确的预测和清晰的直观解释。 EBM 非常适合涉及医疗保健、财务和法规合规性的应用程序,其中了解驱动模型决策的基础因素至关重要。
在 SynapseML 中,可以使用由 Apache Spark 提供支持的可扩展的解释性增强算法来训练新模型。 本教程介绍如何使用 Apache Spar 在 Microsoft Fabric 中应用可解释的提升计算机的可伸缩性和可解释性。 在 Microsoft Fabric 中使用可解释的提升计算机目前为预览版。
重要
此功能以 预览版提供。
可解释的提升计算机的优点
EBM 提供独特的可解释性和预测能力混合,这使得它在机器学习模型的透明度和理解性至关重要时成为理想的选择。 借助 EBM,用户可以对驱动预测的基础因素生成有价值的见解,然后他们可以了解模型做出特定决策或预测的原因。 这对于在 AI 系统中构建信任至关重要。
他们能够发现数据中的复杂关系,同时提供清晰和可解释的结果,使得 EBM 在财务、医疗保健、欺诈检测等方面非常有用。在这些方面,模型可解释性不仅有用,而且通常是法规要求。 最终,EBM 可以在模型性能和透明度之间实现平衡,确保准确、可理解和负责任的 AI 解决方案。
先决条件
获取 Microsoft Fabric 订阅。 或者,注册免费的 Microsoft Fabric 试用版。
登录到 Microsoft Fabric。
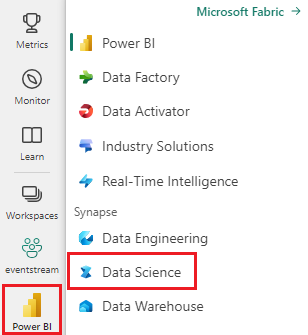
使用主页左下侧的体验切换器切换到 Fabric。

- 选择 + 然后选择 笔记本,在工作区中创建新笔记本。
导入 MLflow
使用 MLflow 可以跟踪模型的参数和结果。 以下代码片段演示如何使用 MLflow 进行试验和跟踪。 该值 ebm-wine-quality 是记录信息的试验的名称。
# Import MLflow
import mlflow

# Create a new experiment for EBM Wine Quality
mlflow.set_experiment("ebm-wine-quality")
加载数据
以下代码片段加载并准备标准 葡萄酒质量数据集,该数据集用作有用的回归任务数据集。 它演示如何加载、作和转换数据集以用于基于 Spark 的机器学习任务。 转换过程涉及将 Pandas 数据帧(使用 as_frame 参数时由 Sklearn 返回)转换为 Spark 数据帧,因为 Spark ML 样式训练器需要:
import sklearn

# Load the Wine Quality Data Set using the as_frame argument for Pandas compatibility.
bunch = sklearn.datasets.load_wine(as_frame=True)

# Extract the data into a Pandas dataframe.
pandas_df = bunch['data']

# Add the target variable to the Pandas dataframe.
pandas_df['target'] = bunch['target']

# Convert the Pandas dataframe to a Spark dataframe.
df = spark.createDataFrame(pandas_df)

# Display the resulting Spark dataframe.
display(df)
准备数据
对于Spark ML样式的学习器,必须将特征组织在向量值列中。 在本例中,将此列称为“功能”。此列包含加载的数据帧中的所有列,但目标变量除外。 此代码片段演示如何使用 VectorAssembler 资源正确构造特征,以便进行基于 Spark ML 的后续建模:
from pyspark.ml.feature import VectorAssembler

# Define the name of the target variable column.
labelColumnName = 'target'

# Create a VectorAssembler to consolidate features.
assembler = VectorAssembler(outputCol='features')

# Specify the input columns, excluding the target column.
assembler.setInputCols([c for c in df.columns if c != labelColumnName])

# Transform the dataframe to include the 'features' column.
df_with_features = assembler.transform(df)
训练模型
以下代码片段使用 Synapse ML 库启动 EBM 回归模型创建过程。 它首先初始化 EBM 回归估算器,并指定回归任务需要它。 然后,它设置标签列名称,以确保模型知道要预测的列。 最后,它将模型拟合到预处理的数据集:
# Import the EBMRegression estimator from Synapse ML.
from synapse.ml.ebm import EbmRegression

# Create an instance of the EBMRegression estimator.
estimator = EbmRegression()

# Set the label column for the regression task.
estimator.setLabelCol(labelColumnName)

# Fit the EBM regression model to the prepared dataset.
model = estimator.fit(df_with_features)
查看全局说明
可以获取可视化包装器,并利用 interpret 库 show 的方法可视化模型的总体说明。 可视化包装器充当桥梁,有助于模型的可视化体验。 以下代码片段演示如何执行此作:
# Get the visualization wrapper for the model.
wrap = model.getVizWrapper()

# Generate the global explanation.
explanation = wrap.explain_global()
接下来,导入 interpret 库,并使用 show 方法显示说明:
import interpret
interpret.show(explanation)
下图中显示的术语“重要性”表示每个术语(特征或交互)对预测的平均绝对贡献(分数)。 这些贡献在训练数据集中被平均化,以考虑每个分箱中的样本数量和样本权重(如果适用)。 该说明显示前 15 个最重要的术语。
查看本地说明
提供的解释在全局级别运行,但在某些情况下,每个功能输出也是有价值的。 训练程序和模型都提供设置 FeaturesScoresCol 列的功能,在填充时,该列引入了另一个矢量值列。 此列中的每个向量与特征列的长度匹配,并且每个值对应于同一索引处的特征。 这些值表示每个特征值对模型的最终输出的贡献。
不同于全局解释,目前不存在与针对每个功能的输出的 interpret 可视化效果的直接集成。 这是因为全局可视化效果主要使用特征数(通常较小值)进行缩放,而本地解释使用行计数进行缩放(对于 Spark 数据帧而言,它可以是实质性的)。
以下代码片段演示如何设置和使用 FeaturesScoresCol 列:
# Set the FeaturesScoresCol to include per-feature outputs.
prediction = model.setFeatureScoresCol("featurescores").transform(df_with_features)

# For small datasets, you can collect the results to a single machine without issues.
# However, for larger datasets, caution should be exercised when collecting all rows locally.
# In this example, we convert to Pandas for easy local inspection.
predictions_pandas = prediction.toPandas()
predictions_list = prediction.collect()
打印第一个示例详细信息:
# Extract the first example from the collected predictions.

first = predictions_list[0]

# Print the lengths of the features and feature scores.
print('Length of the features is', len(first['features']), 'while the feature scores have length', len(first['featurescores']))

# Print the values of the features and feature scores.
print('Features are', first['features'])
print('Feature scores are', first['featurescores'])
代码片段显示了如何访问和打印特征以及预测中的第一个示例对应的特征分数。 此代码生成以下输出:
Length of the features is 13 while the feature scores have length 13
Features are [14.23, 1.71, 2.43, 15.6, 127.0, 2.8, 3.06, 0.28, 2.29, 5.64, 1.04, 3.92, 1065.0]
Feature scores are [-0.05929027436479602,-0.06788488062509922,-0.0385850430666259,-0.2761907140329337,-0.0423377816119861,0.03582834632321236,0.07759833436021146,-0.08428610897153033,-0.01322508472067107,-0.05477604157900576,0.08087667928468423,0.09010794901713073,-0.09521961842295387]
