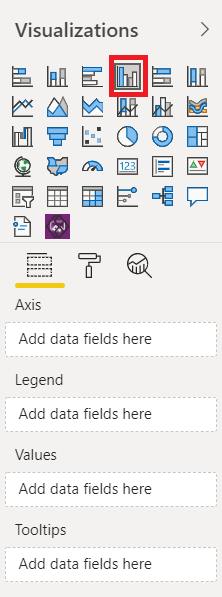
视觉对象的功能是可视化类型可以接受的数据角色。 例如,此图像显示 可视化 窗格中 簇状柱形图 的可视化功能。
获取视觉对象的功能,以确定在报表或视觉对象级别显示哪些数据。 用于获取功能 IVisualCapabilities的两个 API。
export interface IVisualCapabilities {
  dataRoles?: IVisualDataRole[];
}
dataRoles 定义视觉对象期望的角色以及应如何填充这些角色。 此数据需要使用以下视觉数据绑定 API。 其中每个 API 都要求目标 dataRolename 作为输入参数。
dataRoles 由 IVisualDataRole 接口表示:
interface IVisualDataRole {
    name: string;
    kind: VisualDataRoleKind;
    kindPreference?: VisualDataRoleKindPreference;
    displayName?: string;
    description?: string;
}
-
名称 -
VisualDataRole的唯一标识符。 - 类型 - 指示视觉数据的角色类型。
- kindPreference - 指示要使用的角色类型的视觉首选项。
- displayName - 角色的显示名称。
- 说明 - 工具提示的文本。
可以为报表上安装的现装视觉对象和自定义视觉对象检索视觉元数据。
如何在报表级别获取视觉功能
使用 getVisualCapabilities API 查找在报表级别显示的视觉数据。
getVisualCapabilities(visualType: string): Promise<models.IVisualCapabilities>
例
下面是一个代码示例,用于在报表级别查找 条形图 视觉对象中的功能。
let capabilities = await report.getVisualCapabilities('barChart');
如何在视觉对象级别获取视觉功能
使用 getCapabilities API 确定视觉对象级别显示的数据。
getCapabilities(): Promise<models.IVisualCapabilities>
例
下面是一个代码示例,用于在视觉对象级别查找视觉对象中的功能。
let capabilities = await visual.getCapabilities();
例如,获取 clusteredColumnChart 的功能将返回以下内容:
{
    "dataRoles": [
        {
            "name": "Category",
            "displayName": "Axis",
            "description": "Fields to place on the horizontal or vertical axis",
            "kind": 0
        },
        {
            "name": "Series",
            "displayName": "Legend",
            "description": "The categorical field to show for color",
            "kind": 0
        },
        {
            "name": "Y",
            "displayName": "Values",
            "description": "The numeric amounts to plot",
            "kind": 1
        },
        {
            "name": "Rows",
            "displayName": "Small multiples",
            "description": "Split your visual into multiple, smaller visuals based on your selected fields",
            "kind": 0
        },
        {
            "name": "Tooltips",
            "displayName": "Tooltips",
            "description": "Add additional data fields that people can see in the tooltip when they hover on part of this visualization.",
            "kind": 1
        }
    ]
}