在 Power BI 嵌入式 快速创建个性化视觉对象 展示应用程序,用户可以编辑现有报表视觉对象并创建自己的个性化视觉对象,即使他们没有以前的 Power BI 体验。 展示代码演示如何使用 Power BI 报表创作 API 在运行时创建和编辑多种类型的可视化效果。 有关使用报表创作 API 的详细信息,请参阅 报表创作概述。
快速创建个性化视觉对象展示体验
虚构公司 Contoso 使用 快速创建个性化视觉对象展示 展示 Power BI 嵌入式报表及其销售数据的多个可视化效果。 柱形图、面积图、条形图、饼图和折线图将收入和机会显示为行业类型、销售人员和商机状态的功能。
嵌入报表具有 “创建快速视觉对象”按钮,用户可以选择根据数据创建新视觉对象。
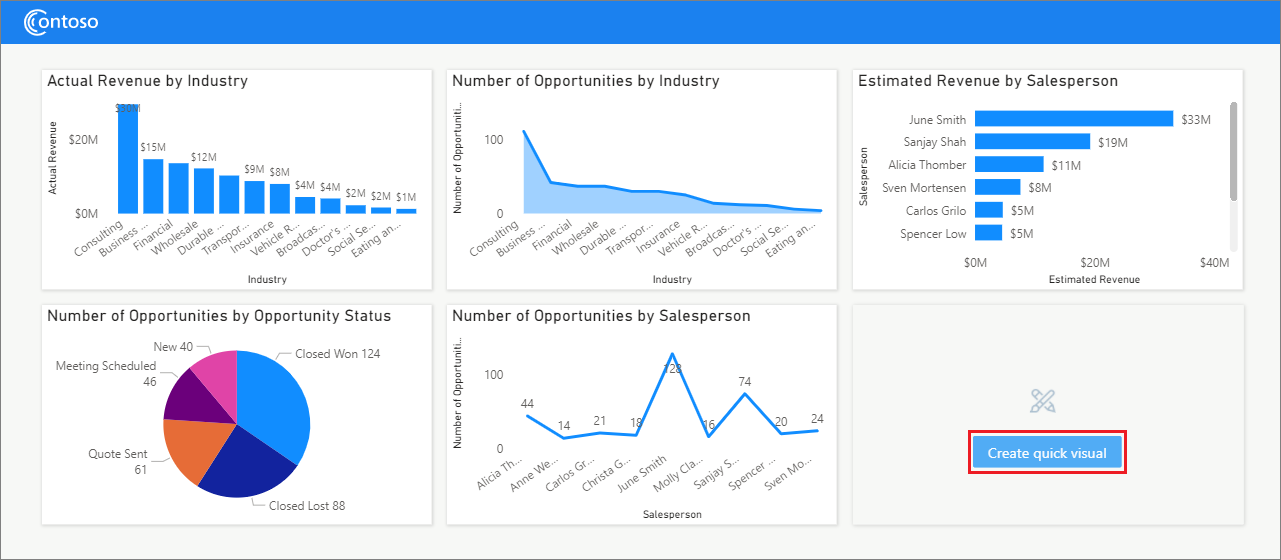
创建新的快速视觉对象
报表用户可以 在查看会话期间随时选择“创建快速视觉对象”按钮,以基于 Contoso 销售数据创建新视觉对象。
例如,如果用户希望看到显示基于商机状态的实际收入的柱形图,则选择
在
填写 轴 和 值 字段后,用户可以选择各种格式选项,例如是否显示实际值和标签。 它们还可以为视觉对象编写和设置标题的格式。
对话框中的嵌入报表预览在用户生成可视化效果时显示可视化效果。
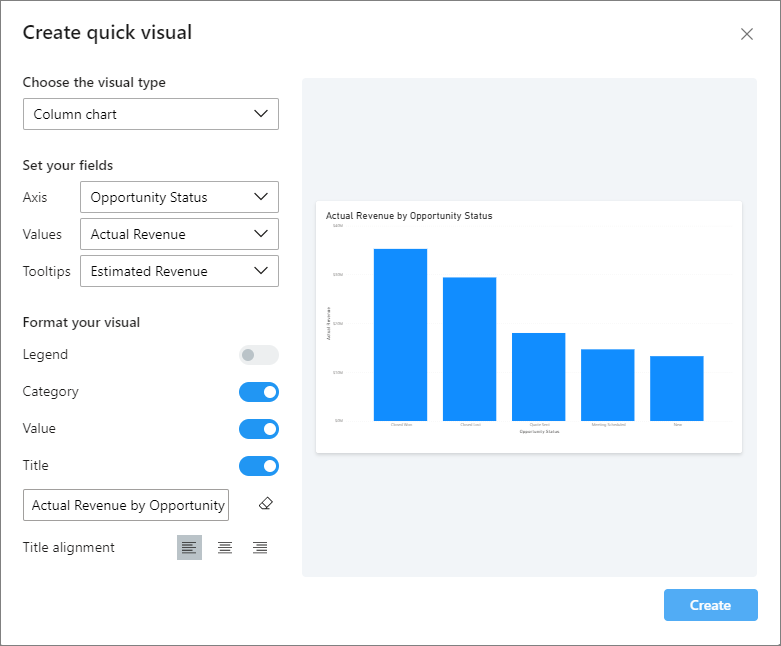
视觉对象完成后,用户选择 创建,新的可视化效果将显示在报表中。
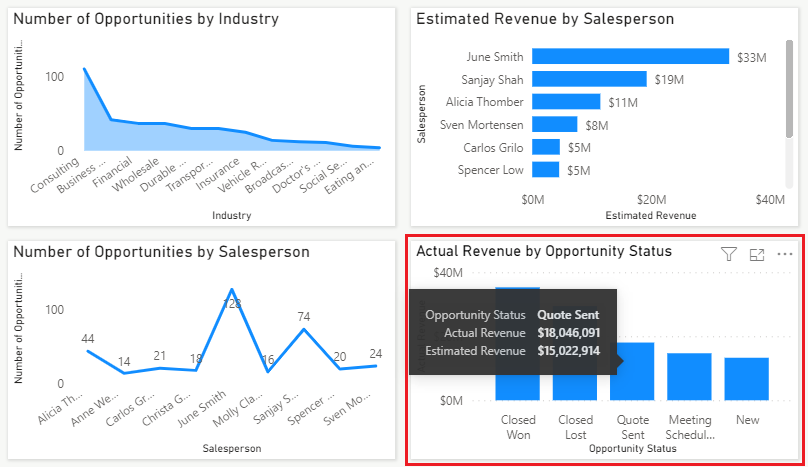
当用户将鼠标悬停在可视化效果中的数据点上时,将显示工具提示。 由于用户在创建视觉对象时
更改现有视觉对象
报表用户可以更改报表中的任何现有视觉对象,方法是在视觉对象的右上角选择“更多选项” 省略号(...),然后选择“更改视觉对象”。
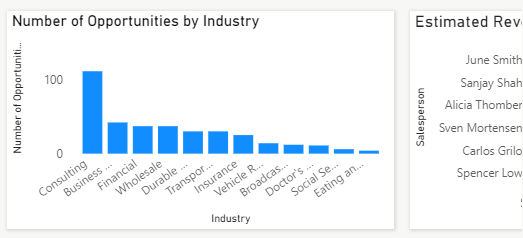
例如,报表用户可能希望将行业机会数 面积图更改为柱形图,因为数据不连续。 当用户选择 更改视觉对象时,将打开 “创建快速视觉对象”对话框,用户可以更改任何设置。
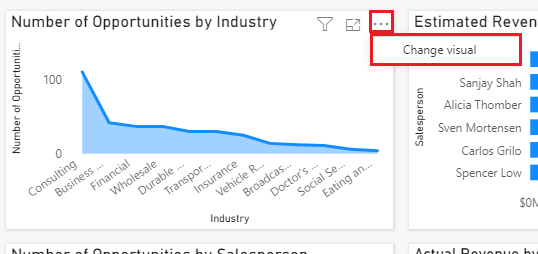
在此示例中,用户已将视觉对象类型更改为 柱形图。 数据现在显示为柱形图。
快速创建个性化视觉对象展示代码
实现展示的代码位于 PowerBI-Embedded-Showcases GitHub 存储库中。
应用程序 HTML 代码 生成嵌入的报表容器和元素、对话框、文本字段和按钮。
报表 JavaScript 代码 定义可视化效果类型、处理命令和事件,并执行所有报表嵌入和交互。
可以使用 Power BI 客户端库的 powerbi-report-authoring 扩展来帮助轻松快速地创作报表和视觉对象。 有关详细信息,请参阅 报表创作概述。
有关创建视觉对象并将其绑定到数据的详细信息,请参阅 创建视觉对象。 有关视觉属性的详细信息,请参阅 设置视觉属性的格式。
创建和配置视觉对象
使用 createVisual 和指定视觉对象类型(如 barChart 或 pieChart)创建 Power BI 视觉对象。 然后将视觉对象类型绑定到属性、角色、字段和数据。 展示 visuals.js 文件定义此应用程序支持的视觉对象类型的属性、数据角色、数据字段和目标。
在 index.js 文件中,以下代码在 创建快速视觉对象 对话框中创建嵌入的视觉对象,并设置并应用其属性。 例如,legend 属性为饼图视觉对象启用,但为条形图和柱形图禁用。
// Based on the state object, create a visual inside the modal
async function createVisualInsideTheModalInEditMode(visualType, dataRoles) {

    // Create visual inside the modal
    const newVisual = await visualCreatorShowcaseState.page.createVisual(visualType, getVisualLayout());

    // Update state
    visualCreatorShowcaseState.newVisual = newVisual.visual;
    visualCreatorShowcaseState.visualType = newVisual.visual.type;
    const visual = newVisual.visual;
    const newVisualType = visual.type;

    // Enable the legend property for pie chart
    if (visualCreatorShowcaseState.visualType === "pieChart") {
        visual.setProperty(propertyToSelector("legend"), { schema: schemas.property, value: true });
    }

    // Add properties to the created visual
    Object.entries(visualCreatorShowcaseState.properties).forEach(property => {
        let [propertyName, propertyValue] = property;
    ...
        // Check the validity of the given property for the given visual-type and apply it to the visual
        applyValidPropertiesToTheVisual(visual, newVisualType, propertyName, propertyValue);
    });

    // Disable the legend for the column and bar charts
    if (visualCreatorShowcaseState.visualType === "columnChart" || visualCreatorShowcaseState.visualType === "barChart") {
        visual.setProperty(propertyToSelector("legend"), { schema: schemas.property, value: false });
    }
更改视觉对象类型
在 “创建快速视觉对象”对话框中,只要所选视觉对象类型保持不变,所有现有编辑字段都可用。 创建新视觉对象或更改视觉对象类型时,当用户选择新的视觉对象类型后,相关的编辑字段将变为可用。
如果用户编辑视觉对象以更改类型,则以下代码将更改视觉对象类型,例如从面积图更改为柱形图。 有关更改视觉对象类型的详细信息,请参阅 更改视觉对象类型。
        const oldVisualType = selectedVisual.visual.type;
        const oldVisual = selectedVisual.visual;
        if (oldVisualType !== visualCreatorShowcaseState.visualType) {

            // If visual-type is changed, remove all active data-fields on the visual
            await removeAllActiveDataRoles(oldVisual, oldVisualType);

            // Change the visual type
            await oldVisual.changeType(visualCreatorShowcaseState.visualType);
        }
将“更改视觉对象”命令添加到“更多选项”菜单
报表 embedConfiguration 使用 扩展菜单命令 API 向报表添加 changeVisual 命令,该命令显示在每个可视化效果的 更多选项 菜单中。
let config = {
...
    settings: {
        ...
        extensions: [
            {
                command: {
                    name: "changeVisual",
                    title: "Change visual",
                    extend: {
                        visualOptionsMenu: {
                            title: "Change visual",
                            menuLocation: models.MenuLocation.Top,
配置还隐藏所有默认的、预先存在的 Power BI 更多选项 菜单命令,例如 导出数据 和 排序。 有关自定义视觉命令的详细信息,请参阅 自定义菜单命令。
处理更改视觉对象并创建快速视觉对象选择事件
以下代码处理 更改视觉对象 命令选择,创建快速视觉对象 按钮单击事件。 该代码侦听命令或按钮选择,并打开 创建快速视觉对象 模式对话框以编辑或创建视觉对象。
    // Listen for the commandTriggered event
    baseReportState.report.on("commandTriggered", function (event) {

        // Open the modal and set the fields, properties and title for the visual
        openModalAndFillState(event.detail);
    });

    baseReportState.report.on("buttonClicked", function () {

        // Show the modal to create the visual
        openModalAndFillState();
    });