本文提供代码示例,演示如何使用 PowerPoint JavaScript API 创建表和控制格式设置。
创建空表
若要创建空表,请调用 ShapeCollection.addTable () 方法并指定表所需的行数和列数。 下面的代码示例演示如何创建包含 3 行和 4 列的表。
await PowerPoint.run(async (context) => {
    const shapes = context.presentation.getSelectedSlides().getItemAt(0).shapes;

    // Add a table (which is a type of Shape).
    const shape = shapes.addTable(3, 4);
    await context.sync();
});
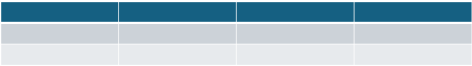
前面的示例未指定任何选项,因此表默认为 PowerPoint 提供的格式设置。 下图显示了在 PowerPoint 中使用默认格式创建的空表的示例。
指定值
创建表时,可以使用字符串值填充表。 为此,请提供 TableAddOptions 对象中的值的 2 维数组。 下面的代码示例创建一个表,其中包含从“1”到“12”的字符串值。 请注意以下事项:
- 空单元格必须指定为空字符串“”。 如果值未定义或缺失,
addTable将引发错误。 - 外部数组包含行列表。 每行都是包含字符串单元格值列表的内部数组。
- 名为 的函数
insertTableOnCurrentSlide用于本文的其他示例。
async function run() {
    const options: PowerPoint.TableAddOptions = {
        values: [
            ["1", "2", "", "4"], // Cell 3 is blank.
            ["5", "6", "7", "8"],
            ["9", "10", "11", "12"]
        ],
    };

    await insertTableOnCurrentSlide(3, 4, options);
}

async function insertTableOnCurrentSlide(rowCount: number, columnCount: number, options: PowerPoint.TableAddOptions) {
    await PowerPoint.run(async (context) => {
        const shapes = context.presentation.getSelectedSlides().getItemAt(0).shapes;

        // Add a table (which is a type of Shape).
        const shape = shapes.addTable(rowCount, columnCount, options);
        await context.sync();
    });
}
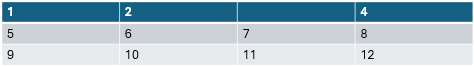
上一示例创建一个具有值的表,如下图所示。
指定单元格格式
创建表格时,可以指定单元格格式,包括边框样式、填充样式、字体样式、水平对齐方式、缩进级别和垂直对齐方式。 这些格式由 TableCellProperties 对象指定。
统一单元格格式
统一单元格格式应用于整个表格。 例如,如果将统一字体颜色设置为白色,则所有表格单元格都将使用白色字体。 统一单元格格式对于控制所需的整个表的默认格式非常有用。
使用 TableAddOptions.uniformCellProperties 属性为整个表指定统一单元格格式。 下面的代码示例演示如何将所有表格单元格设置为深板蓝色填充颜色和加粗的白色字体。
const rowCount = 3;
const columnCount = 4;
const options: PowerPoint.TableAddOptions = {
    values: [
        ["1", "2", "", "4"],
        ["5", "6", "7", "8"],
        ["9", "10", "11", "12"]
    ],
    uniformCellProperties: {
        fill: { color: "darkslateblue" },
        font: { bold: true, color: "white" }
    }
};
await insertTableOnCurrentSlide(rowCount, columnCount, options);
上一示例创建一个表,如下图所示。

特定单元格格式
特定单元格格式适用于单个单元格,并覆盖统一单元格格式(如果有)。 使用 TableAddOptions.specificCellProperties 属性设置单个单元格格式。 下面的代码示例演示如何将第 1 行第 1 列单元格的填充颜色设置为黑色。
请注意, specificCellProperties 必须是与表的 2D 大小完全匹配的 2D 数组。 该示例首先创建整个空的 2D 对象数组。 然后,它会在创建 options 对象后,设置第 1 行第 1 列的特定单元格格式。
const rowCount = 3;
const columnCount = 4;
// Compact syntax to create a 2D array filled with empty and distinct objects.
const specificCellProperties = Array(rowCount).fill("").map(_ => Array(columnCount).fill("").map(_ => ({})));
const options: PowerPoint.TableAddOptions = {
    values: [
        ["1", "2", "", "4"],
        ["5", "6", "7", "8"],
        ["9", "10", "11", "12"]
    ],
    uniformCellProperties: {
        fill: { color: "darkslateblue" },
        font: { bold: true, color: "white" }
    },
    specificCellProperties // Array values are empty objects at this point.
};
// Set fill color for specific cell at row 1, column 1.
options.specificCellProperties[1][1] = {
    fill: { color: "black" }
};
await insertTableOnCurrentSlide(rowCount, columnCount, options);
上一示例创建一个表格,该表将特定格式应用于第 1 行第 1 列的单元格,如下图所示。

前面的示例使用 字体 属性,该属性的类型为 FontProperties。 属性 font 允许指定许多属性,例如粗体、斜体、名称、颜色等。 下面的代码示例演示如何为单元格的字体指定多个属性。
options.specificCellProperties[1][1] = {
    font: {
        color: "orange",
        name: "Arial",
        size: 50,
        allCaps: true,
        italic: true
    }
};
还可以指定 FillProperties 类型的 fill 属性。 属性 fill 可以指定颜色和透明度百分比。 下面的代码示例演示如何使用颜色“深红色”和 50% 透明度为所有表格单元格创建填充。
uniformCellProperties: {
    fill: {
        color: "darkred",
        transparency: 0.5
    }
}
Borders
使用 TableCellProperties.borders 对象为表中的单元格定义边框。 下面的代码示例演示如何将第 1 行第 1 行单元格的边框设置为粗细为 3 的红色边框。
const columnCount = 3;
const rowCount = 3;
// Compact syntax to create a 2D array filled with empty and distinct objects.
const specificCellProperties = Array(rowCount).fill(undefined).map(_ => Array(columnCount).fill(undefined).map(_ => ({})));
const options: PowerPoint.TableAddOptions = {
    values: [
        ["1", "2", "3"],
        ["4", "5", "6"],
        ["7", "8", "9"]
    ],
    uniformCellProperties: {
        fill: {
            color: "lightcyan",
            transparency: 0.5
        },
    },
    specificCellProperties
};
options.specificCellProperties[1][1] = {
    font: {
        color: "red",
        name: "Arial",
        size: 50,
        allCaps: true,
        italic: true
    },
    borders: {
        bottom: {
            color: "red",
            weight: 3
        },
        left: {
            color: "red",
            weight: 3
        },
        right: {
            color: "red",
            weight: 3
        },
        top: {
            color: "red",
            weight: 3
        }
    }
};
await insertTableOnCurrentSlide(rowCount, columnCount, options);
水平和垂直对齐
使用 TableCellProperties.horizontalAlignment 属性可控制单元格中的文本对齐方式。 以下示例演示如何将表格中的三个单元格的水平对齐方式设置为左对齐、右对齐和居中对齐方式。 有关所有对齐选项的列表,请参阅 ParagraphHorizontalAlignment 枚举。
const rowCount = 3;
const columnCount = 3;
// Compact syntax to create a 2D array filled with empty and distinct objects.
const specificCellProperties = Array(rowCount).fill("").map(_ => Array(columnCount).fill("").map(_ => ({})));
const options: PowerPoint.TableAddOptions = {
    values: [
        ["Left aligned, top", "\n\n", ""],
        ["Centered", "\n\n", ""],
        ["Right aligned, bottom", "\n\n", ""]
    ],
    uniformCellProperties: {
        fill: { color: "lightblue" },
        borders: {
            bottom: {
                color: "black",
                weight: 3
            },
            left: {
                color: "black",
                weight: 3
            },
            right: {
                color: "black",
                weight: 3
            },
            top: {
                color: "black",
                weight: 3
            }
        }
    },
    specificCellProperties // Array values are empty objects at this point.
};
options.specificCellProperties[0][0] = {
    horizontalAlignment: PowerPoint.ParagraphHorizontalAlignment.left,
    verticalAlignment: PowerPoint.TextVerticalAlignment.top
};
options.specificCellProperties[1][0] = {
    horizontalAlignment: PowerPoint.ParagraphHorizontalAlignment.center,
    verticalAlignment: PowerPoint.TextVerticalAlignment.middle
};
options.specificCellProperties[2][0] = {
    horizontalAlignment: PowerPoint.ParagraphHorizontalAlignment.right,
    verticalAlignment: PowerPoint.TextVerticalAlignment.bottom
};
await insertTableOnCurrentSlide(3, 3, options);
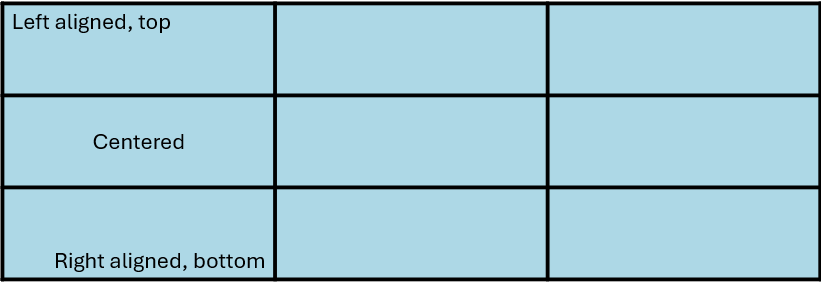
上一示例创建一个表格,该表采用左/上、居中和右/下文本对齐方式,如下图所示。
指定行宽和列宽
使用 TableAddOptions.rows 和 TableAddOptions.columns 属性指定行宽和列宽。 属性 rows 是 TableRowProperties 的数组,用于设置每行的 rowHeight 属性。 同样,属性 columns 是 TableColumnProperties 的数组,用于设置每个列的 columnWidth 属性。 宽度或高度以磅为单位设置。
如果 PowerPoint 需要适合文本,则设置的高度或宽度可能不受 PowerPoint 的允许。 例如,如果文本对于某一列来说太宽,PowerPoint 将增加行高,以便将文本换行到下一行。 同样,如果指定的字号小于指定字号中的单个字符,则列宽将增加。
下面的代码示例演示如何为新表设置行高和列宽。 请注意,行和列属性必须设置为等于其计数的对象数组。
const columnCount = 3;
const rowCount = 3;
const options: PowerPoint.TableAddOptions = {
    values: [
        ["Width 72pt", "Width 244pt", "Width 100pt"],
        ["", "", ""],
        ["", "^\n\nHeight 200 pt\n\nv", ""]
    ],
    // Initialize columns with an array of empty objects for each column.
    columns: Array(columnCount).fill("").map(_ => ({})),
    rows: Array(columnCount).fill("").map(_ => ({})),
    uniformCellProperties: {
        fill: { color: "lightcyan" },
        horizontalAlignment: PowerPoint.ParagraphHorizontalAlignment.center,
        verticalAlignment: PowerPoint.TextVerticalAlignment.middle,
        borders: {
            bottom: {
                color: "black",
                weight: 3
            },
            left: {
                color: "black",
                weight: 3
            },
            right: {
                color: "black",
                weight: 3
            },
            top: {
                color: "black",
                weight: 3
            }
        }
    }
};
options.columns[0].columnWidth = 72;
options.columns[1].columnWidth = 244;
options.columns[2].columnWidth = 100;
options.rows[2].rowHeight = 200;
await insertTableOnCurrentSlide(rowCount, columnCount, options);
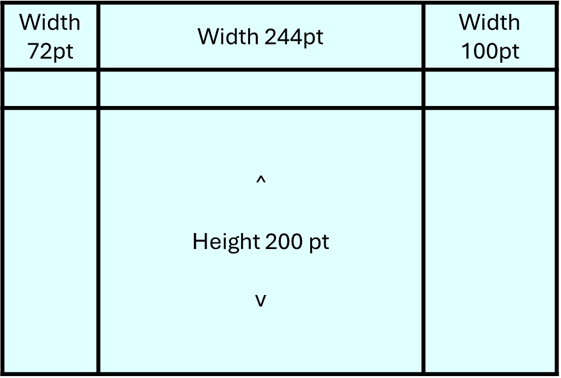
上一示例创建一个具有三个自定义列宽和一个自定义行高度的表,如下图所示。
指定合并区域
合并区域是两个或更多个单元格组合在一起,以便它们共享单个值和格式。 在外观上,合并区域跨越多个行或多列。 在设置合并区域的值或格式时,按其左上方表单元格位置 (行、列) 编制索引。 合并区域的左上角单元格始终用于设置值和格式设置。 合并区域中的所有其他单元格必须是未应用格式的空字符串。
若要指定合并区域,请提供左上位置,该区域 (行、列) 以及行和列中的区域长度。 下图显示了合并区域(大小为 3 行乘以 2 列为单位)的这些值的示例。 请注意,合并区域不能相互重叠。
使用 TableAddOptions.mergedAreas 属性可以指定一个或多个合并区域。 以下代码示例演示如何创建包含两个合并区域的表。 关于代码示例,请注意以下事项:
values 属性只能指定合并区域的左上角的值。 合并区域中的所有其他单元格值必须指定空字符串 (“”) 。
每个合并区域必须指定 (行、列) 的左上角位置,以及合并区域的单元格中行计数和列计数的长度。
const rowCount = 3;
const columnCount = 4;
// Compact syntax to create a 2D array filled with empty and distinct objects.
const specificCellProperties = Array(rowCount).fill("").map(_ => Array(columnCount).fill("").map(_ => ({})));
const options: PowerPoint.TableAddOptions = {
    values: [
        ["1", "This is a merged cell", "", "4"],
        ["5", "6", "This is also a merged cell", "8"],
        ["9", "10", "", "12"]
    ],
    uniformCellProperties: {
        fill: { color: "darkslateblue" },
        font: { bold: true, color: "white" },
        borders: {
            bottom: {
                color: "black",
                weight: 3
            },
            left: {
                color: "black",
                weight: 3
            },
            right: {
                color: "black",
                weight: 3
            },
            top: {
                color: "black",
                weight: 3
            }
        }
    },
    mergedAreas: [{ rowIndex: 0, columnIndex: 1, rowCount: 1, columnCount: 2 },
    { rowIndex: 1, columnIndex: 2, rowCount: 2, columnCount: 1 }
    ],
    specificCellProperties // Array values are empty objects at this point.
};
// Set fill color for specific cell at row 1, column 1.
options.specificCellProperties[1][1] = {
    fill: { color: "black" }
};
await insertTableOnCurrentSlide(rowCount, columnCount, options);
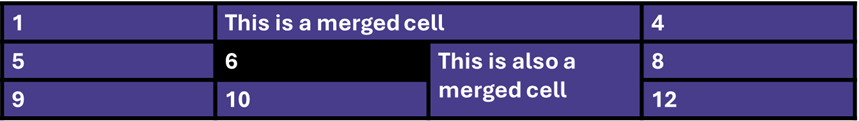
上一示例创建一个包含两个合并区域的表,如下图所示。
获取和设置表单元格值
创建表后,可以获取或设置单元格中的字符串值。 请注意,这是表中唯一可以更改的部分。 不能更改边框、字体、宽度或其他单元格属性。 如果需要更新表,请将其删除并重新创建。 下面的代码示例演示如何查找现有表并为表中的单元格设置新值。
await PowerPoint.run(async (context) => {
    // Load shapes.
    const shapes = context.presentation.getSelectedSlides().getItemAt(0).shapes;
    shapes.load("items");
    await context.sync();
    // Find the first shape of type table.
    const shape = shapes.items.find((shape) => shape.type === PowerPoint.ShapeType.table)
    const table = shape.getTable();
    table.load();
    await context.sync();
    // Set the value of the specified table cell.
    const cell = table.getCellOrNullObject(1, 1);
    cell.text = "A new value";
});
还可以从表中获取以下只读属性。
- rowCount
- columnCount
以下示例演示如何获取表属性并将其记录到控制台。 该示例还演示如何获取表中的合并区域。
await PowerPoint.run(async (context) => {
    // Load shapes.
    const shapes = context.presentation.getSelectedSlides().getItemAt(0).shapes;
    shapes.load("items");
    await context.sync();
    // Find the first shape of type table.
    const shape = shapes.items.find((shape) => shape.type === PowerPoint.ShapeType.table)
    const table = shape.getTable();
    // Load row and column counts.
    table.load("rowCount, columnCount");
    // Load the merged areas.
    const mergedAreas = table.getMergedAreas();
    mergedAreas.load("items");
    await context.sync();
    // Log the table properties.
    console.log(mergedAreas);
    console.log(table.rowCount);
    console.log(table.columnCount);
});