(Project) 的图表对象
Chart 对象表示 Project 中报表上的图表。
Project 中的 Chart 对象包括其他 Office 应用程序为 Office Art 实现的标准成员。 例如,请参阅 Word、Excel 和 PowerPoint 的 VBA 对象模型中的 Chart 对象。
在 Project 中,图表由 Chart 对象表示,该对象包含在 Report 对象中的 Shape 对象或 ShapeRange 集合中。 有关显示 Project 对象模型层次结构中 Chart 对象的关系图,请参阅 Application and Projects 对象映射。
备注
未实现 Chart 对象的宏录制。 也就是说,在 Project 中记录宏并手动添加图表、添加图表元素或在报表中手动设置图表格式时,不会记录添加和操作图表的步骤。
使用 Shapes.AddChart 方法向报表添加图表。 若要确定 Shape 还是 ShapeRange 包含图表,请使用 HasChart 方法。
Project 中的 Chart 对象不实现事件。 因此,Project 中的图表不能像在 Excel 中那样对“ 选择” 或 “计算”等事件进行动画处理以与鼠标事件交互或响应。
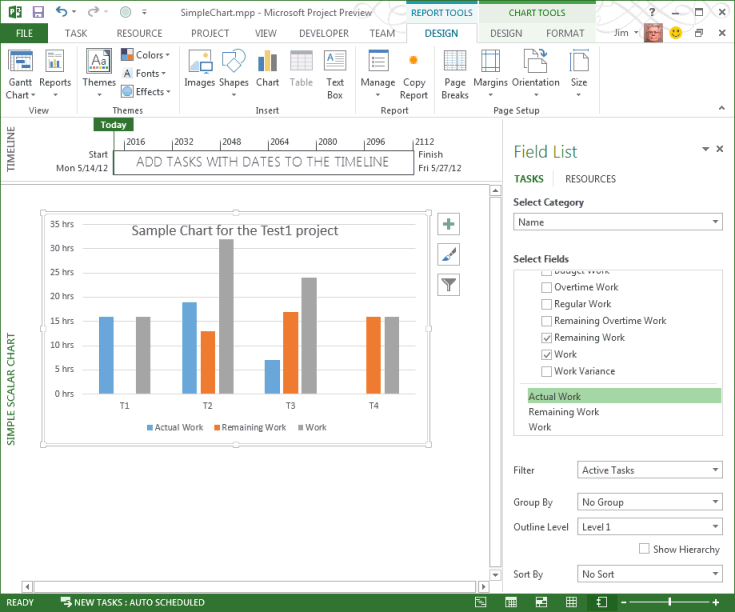
以下示例为活动项目中的任务创建一个简单的标量图。 图表显示 “实际工时”、“ 剩余工时”和“ 工时 ”默认字段。
若要创建一些示例数据,请向新项目添加四个任务,为这些任务分配本地资源,并设置工期和实际工时的各种值。 例如,请尝试表 1 中的值。
表 1. 简单图表的示例数据
| 任务名称 | Duration | 实际工时 |
|---|---|---|
| T1 | 二 维和 | 16 |
| T2 | 5d | 19 |
| T3 | 4d | 7 |
| T4 | 二 维和 | 0 |
Sub AddSimpleScalarChart()
    Dim chartReport As Report
    Dim reportName As String

    ' Add a report.
    reportName = "Simple scalar chart"
    Set chartReport = ActiveProject.Reports.Add(reportName)

    ' Add a chart.
    Dim chartShape As Shape
    Set chartShape = ActiveProject.Reports(reportName).Shapes.AddChart()

    chartShape.Chart.SetElement (msoElementChartTitleCenteredOverlay)
    chartShape.Chart.ChartTitle.Text = "Sample Chart for the Test1 project"
End Sub
运行 AddSimpleScalarChart 宏时,Project 会创建报表并添加图表。 图表具有默认特征,但标题由 SetElement 属性指定为覆盖在图表上,而不是图表上方的默认位置。
图 1. 图表显示表 1 中的数据
 若要删除图表,可以删除包含图表的形状。 以下宏删除 由 AddSimpleScalarChart 宏创建的报表上的图表,并将空报表保留为活动视图。
Sub DeleteTheShape()
    Dim i As Integer
    Dim reportName As String
    Dim theShape As MSProject.Shape

    reportName = "Simple scalar chart"

    For i = 1 To ActiveProject.Reports.Count
        If ActiveProject.Reports(i).Name = reportName Then
            Set theShape = ActiveProject.Reports(i).Shapes(1)
            theShape.Delete
        End If
    Next i
End Sub
若要删除报表,请转到其他视图,然后打开“ 组织器 ”对话框。 报表处于活动状态时,无法删除报表。 组织器位于功能区的“开发工具”选项卡上,也可在“报表”组中的“设计”选项卡上的“管理”菜单上使用。 在“组织程序”对话框的“报表”选项卡上,在项目窗格中选择“简单标量图”,然后选择“删除”。 或者,运行以下宏以删除报表。
Sub DeleteTheReport()
    Dim i As Integer
    Dim reportName As String

    reportName = "Simple scalar chart"

    ' To delete the active report, change to another view.
    ViewApplyEx Name:="&Gantt Chart"

    ActiveProject.Reports(reportName).Delete
End Sub
有关于 Office VBA 或本文档的疑问或反馈? 请参阅 Office VBA 支持和反馈,获取有关如何接收支持和提供反馈的指南。