Chart object (Project)
The Chart object represents a chart on a report in Project.
The Chart object in Project includes the standard members that other Office applications implement for Office Art. For example, see the Chart object in the VBA object model for Word, Excel, and PowerPoint.
In Project, a chart is represented by a Chart object, which is contained by a Shape object or a ShapeRange collection in a Report object. For a diagram that shows the Chart object in the Project object model hierarchy, see Application and Projects object map.
Note
Macro recording for the Chart object is not implemented. That is, when you record a macro in Project and manually add a chart, add chart elements, or manually format a chart in a report, the steps for adding and manipulating the chart are not recorded.
Use the Shapes.AddChart method to add a chart to a report. To determine whether a Shape or a ShapeRange contains a chart, use the HasChart method.
The Chart object in Project does not implement events. So, a chart in Project cannot be animated to interact with mouse events or respond to events such as Select or Calculate, as it can in Excel.
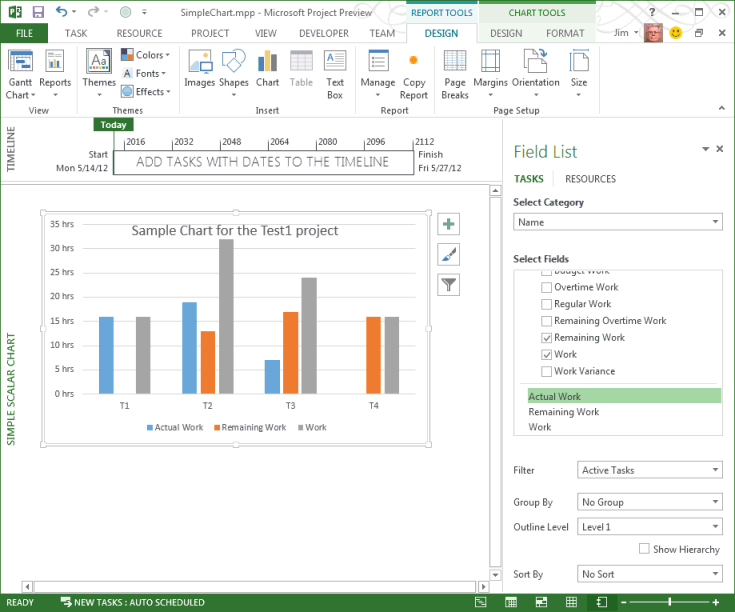
The following example creates a simple scalar chart for tasks in the active project. The chart shows the Actual Work, Remaining Work, and Work default fields.
To create some sample data, add four tasks to a new project, assign local resources to those tasks, and set various values of duration and actual work. For example, try the values in Table 1.
Table 1. Sample data for a simple chart
| Task name | Duration | Actual work |
|---|---|---|
| T1 | 2d | 16 |
| T2 | 5d | 19 |
| T3 | 4d | 7 |
| T4 | 2d | 0 |
Sub AddSimpleScalarChart()
    Dim chartReport As Report
    Dim reportName As String

    ' Add a report.
    reportName = "Simple scalar chart"
    Set chartReport = ActiveProject.Reports.Add(reportName)

    ' Add a chart.
    Dim chartShape As Shape
    Set chartShape = ActiveProject.Reports(reportName).Shapes.AddChart()

    chartShape.Chart.SetElement (msoElementChartTitleCenteredOverlay)
    chartShape.Chart.ChartTitle.Text = "Sample Chart for the Test1 project"
End Sub
When you run the AddSimpleScalarChart macro, Project creates the report and adds a chart. The chart has default features, except the title is specified by the SetElement property to be overlaid on the chart, instead of the default position above the chart.
Figure 1. The chart shows the data in Table 1
 To delete the chart, you can delete the shape that contains the chart. The following macro deletes the chart on the report that is created by the AddSimpleScalarChart macro, and leaves the empty report as the active view.
Sub DeleteTheShape()
    Dim i As Integer
    Dim reportName As String
    Dim theShape As MSProject.Shape

    reportName = "Simple scalar chart"

    For i = 1 To ActiveProject.Reports.Count
        If ActiveProject.Reports(i).Name = reportName Then
            Set theShape = ActiveProject.Reports(i).Shapes(1)
            theShape.Delete
        End If
    Next i
End Sub
To delete the report, go to a different view, and then open the Organizer dialog box. You cannot delete a report while the report is active. The Organizer is available on the DEVELOPER tab of the ribbon, and also on the DESIGN tab, in the Report group, on the Manage menu. On the Reports tab of the Organizer dialog box, select Simple scalar chart in the project pane, and then choose Delete. Alternately, run the following macro to delete the report.
Sub DeleteTheReport()
    Dim i As Integer
    Dim reportName As String

    reportName = "Simple scalar chart"

    ' To delete the active report, change to another view.
    ViewApplyEx Name:="&Gantt Chart"

    ActiveProject.Reports(reportName).Delete
End Sub
Have questions or feedback about Office VBA or this documentation? Please see Office VBA support and feedback for guidance about the ways you can receive support and provide feedback.