Debug your app
When you need to diagnose errors or issues in your app, use the integrated Visual Studio debugger.
Open your app project in Visual Studio.
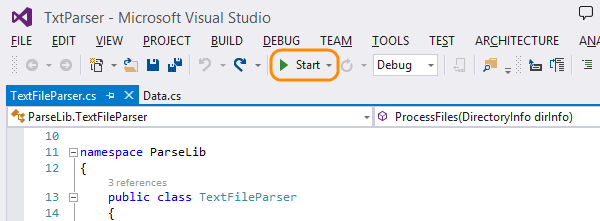
Run your app in debug mode to find exceptions, problems in execution, or data values. Press F5 or choose the Start button.
When the debugger catches an exception, it suspends execution of the app.
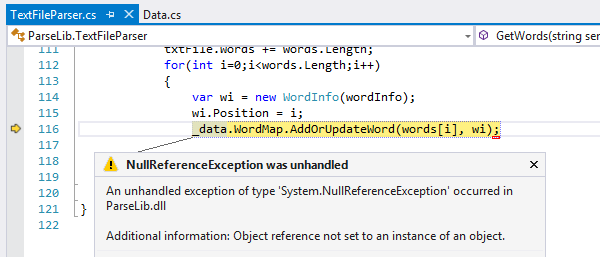
Close the exception dialog to find the uninitialized object. Even at an exception, the debugger lets you examine the state of your app.
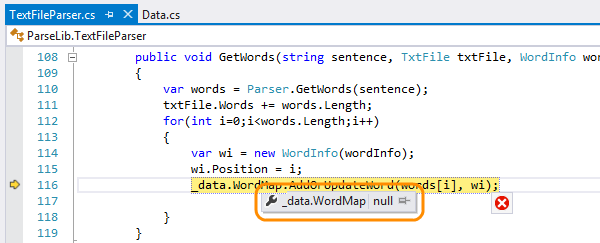
Hover your mouse over the variables to view their values in a data tip.
In the Locals window, you can learn more about the context of the problem.
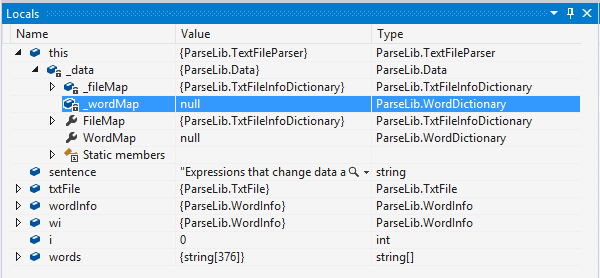
In this case, the property might be a reference to a private field that’s the root of the problem. The next step is usually to move through your code to find where things went wrong.
In the Call Stack window, you can see the path that your app took to reach the point where the exception happened.

Use your knowledge of the code to determine a place to set a breakpoint.
Open the file where you want to start debugging, and then select the line where you want to begin. Press F9 or double-click in the left-hand gutter next to the line.
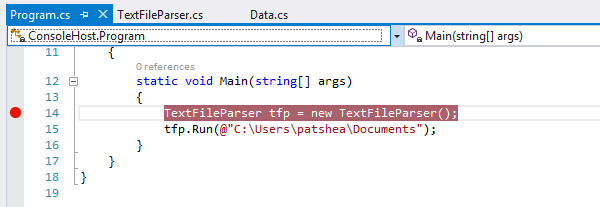
The break point is shown as a red circle in the gutter. The breakpoint halts your app so that you can begin stepping through the code.
Because the debugger caught an exception, you’ll need to restart the debug session. Press Shift + F5, or choose the Stop Debugging button on the tool bar.

Restart the debugging session. Use the stepping commands to move through your code, looking for the method that is most likely to create the uninitialized object. What are the stepping commands?
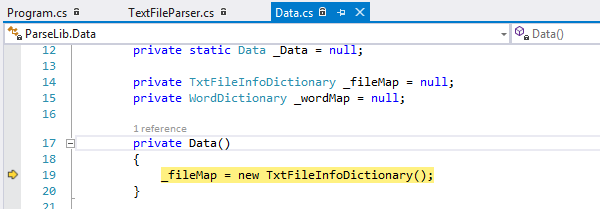
When you have identified the location where you can fix the issue, stop debugging and change or add code.

Restart the debugging session, and run through the app again to confirm your fix.
Q&A
Q:What are the stepping commands?
A:You can move through the app using one of these commands:
**Step Over (F10)**Stepping over a function always executes the next line of code and then suspends execution. It doesn't matter if the line contains a call to a method in your code.
**Step Into (F11)**When you step into a line of code, the debugger performs one of the following actions:
- If the statement is a call to a function in your code, the debugger moves to the first line of the called function and then suspends execution.
- If the next statement is not a call to a function in your code, such as a system or framework function, the debugger executes the statement, moves to the next statement, and then suspends execution.
**Continue (F5)**Continue restarts execution of the app. Execution continues until a breakpoint is reached, an exception occurs, or the application exits.
**Run to cursor (Ctrl + F10)**Running to the cursor acts like a temporary breakpoint. Select a line in the code and choose Run to Cursor from the context menu.
The debugger continues execution of the app until the line containing the cursor is about to be executed, or until a breakpoint is reached between the line where execution resumed and the cursor.
Q:Can I get more control over when my breakpoints fire?
A:Yes, you can temporarily disable breakpoints, and you can set conditions that determine when a breakpoint fires. Learn more here.
Q:Can I debug an app that is not on my Visual Studio machine?
A:Yes. But only if the app is running on a device that is connected over a network, or that is directly connected to the Visual Studio machine. You’ll need to do some configuration to be able to debug this way.
Q:Can I change my code without stopping the debug session?
A:Sometimes, but the rules on when this is possible are complicated. The best way is just to try it. You'll get an error if the language or context does not support editing. If that happens, you can simply remove your changes.
Try this next
- Share your code in TFVC or share your code in Git, depending on how you set up your team project. You can share projects from Eclipse and Xcode, too.
False