适用于:  .NET Framework .NET .NET Standard

Windows 事件跟踪 (ETW) 是一种高效的内核级别跟踪功能,通过此功能,你可以记录用于调试和测试的驱动程序定义的事件。 SqlClient 支持在不同的信息级别捕获 ETW 事件。 若要开始捕获事件跟踪,客户端应用程序应侦听来自 SqlClient 的 EventSource 实现的事件:
Microsoft.Data.SqlClient.EventSource
| 关键字名称 | 值 | 描述 |
|---|---|---|
| ExecutionTrace | 1 | 启用对命令执行前后 Start/Stop 事件的捕获。 |
| 跟踪 | 2 | 启用捕获基本应用程序流跟踪事件。 |
| Scope | 4 | 启用捕获进入和退出事件 |
| NotificationTrace | 8 | 启用捕获 SqlNotification 跟踪事件 |
| 通知范围 | 16 | 启用捕获 SqlNotification 范围进入和退出事件 |
| PoolerTrace | 32 | 启用捕获连接池流跟踪事件。 |
| PoolerScope | 64 | 启用捕获连接池范围跟踪事件。 |
| AdvancedTrace | 128 | 启用捕获高级流跟踪事件。 |
| AdvancedTraceBin | 256 | 启用捕获带有其他信息的高级流跟踪事件。 |
| CorrelationTrace | 512 | 启用捕获关联流跟踪事件。 |
| StateDump | 1024 | 启用捕获完整状态转储 SqlConnection |
| SNITrace | 2048 | 启用从托管网络实现捕获流跟踪事件(仅适用于 .NET Core) |
| SNIScope | 4096 | 启用从托管网络实现捕获范围事件(仅适用于 .NET Core) |
示例
下面的示例对“AdventureWorks”示例数据库上的数据操作启用事件跟踪,并在控制台窗口中显示事件。
using System;
using System.Diagnostics.Tracing;
using Microsoft.Data.SqlClient;

// This listener class will listen for events from the SqlClientEventSource class.
// SqlClientEventSource is an implementation of the EventSource class which gives
// it the ability to create events.
public class SqlClientListener : EventListener
{
    protected override void OnEventSourceCreated(EventSource eventSource)
    {
        // Only enable events from SqlClientEventSource.
        if (eventSource.Name.Equals("Microsoft.Data.SqlClient.EventSource"))
        {
            // Use EventKeyWord 2 to capture basic application flow events.
            // See the above table for all available keywords.
            EnableEvents(eventSource, EventLevel.Informational, (EventKeywords)2);
        }
    }

    // This callback runs whenever an event is written by SqlClientEventSource.
    // Event data is accessed through the EventWrittenEventArgs parameter.
    protected override void OnEventWritten(EventWrittenEventArgs eventData)
    {
        // Print event data.
        Console.WriteLine(eventData.Payload[0]);
    }
}

class Program
{
    public static void Main()
    {
        // Create a new event listener.
        using (SqlClientListener listener = new SqlClientListener())
        {
            string connectionString = "Data Source=localhost; " +
                "Initial Catalog=AdventureWorks; Integrated Security=true";

            // Open a connection to the AdventureWorks database.
            using (SqlConnection connection = new SqlConnection(connectionString))
            {
                connection.Open();

                string sql = "SELECT * FROM Sales.Currency";
                SqlCommand command = new SqlCommand(sql, connection);

                // Perform a data operation on the server.
                SqlDataReader reader = command.ExecuteReader();
                while (reader.Read())
                {
                    // Read the data.
                }
                reader.Close();
            }
        }
    }
}
Native SNI 的事件跟踪支持
Microsoft.Data.SqlClient 在 Microsoft.Data.SqlClient.SNI 和 Microsoft.Data.SqlClient.SNI.runtime(从 v2.1 开始)中提供了事件跟踪支持 。 可使用 Xperf 和 PerfView 工具从本机 DLL 收集事件。
从 Microsoft.Data.SqlClient v3.0 开始,可使用事件收集工具启用事件跟踪,而无需在客户端应用程序中进行任何修改。
在 Microsoft.Data.SqlClient v2.1 中,需要通过使用事件源侦听器配置 来启用事件跟踪。 适用于原生 SNI 的有效 EventCommand 值如下:
// Enables trace events:
EventSource.SendCommand(eventSource, (EventCommand)8192, null);

// Enables flow events:
EventSource.SendCommand(eventSource, (EventCommand)16384, null);

// Enables both trace and flow events:
EventSource.SendCommand(eventSource, (EventCommand)(8192 | 16384), null);
以下示例将在本机 SNI DLL 中启用事件跟踪。
// Native SNI tracing example
using System;
using System.Diagnostics.Tracing;
using Microsoft.Data.SqlClient;

public class SqlClientListener : EventListener
{
    protected override void OnEventSourceCreated(EventSource eventSource)
    {
        if (eventSource.Name.Equals("Microsoft.Data.SqlClient.EventSource"))
        {
            // Enables both trace and flow events
            EventSource.SendCommand(eventSource, (EventCommand)(8192 | 16384), null);
        }
    }
}

class Program
{
    static string connectionString = @"Data Source = localhost; Initial Catalog = AdventureWorks;Integrated Security=true;";

    static void Main(string[] args)
    {
        // Event source listener configuration is not required in v3.0 onwards.
        using (SqlClientListener listener = new SqlClientListener())
        using (SqlConnection connection = new SqlConnection(connectionString))
        {
            connection.Open();
        }
    }
}
使用 Xperf 收集跟踪日志
使用以下命令启动跟踪。
xperf -start trace -f myTrace.etl -on *Microsoft.Data.SqlClient.EventSource运行本机 SNI 跟踪示例以连接到 SQL Server。
使用以下命令停止跟踪。
xperf -stop trace使用 PerfView 打开在步骤 1 中指定的 myTrace.etl 文件。 可以通过
Microsoft.Data.SqlClient.EventSource/SNIScope和Microsoft.Data.SqlClient.EventSource/SNITrace事件名称找到 SNI 跟踪日志。
使用 PerfView 收集跟踪数据
启动 PerfView,并从菜单栏运行
Collect > Collect。配置跟踪文件名、输出路径和提供程序名称。
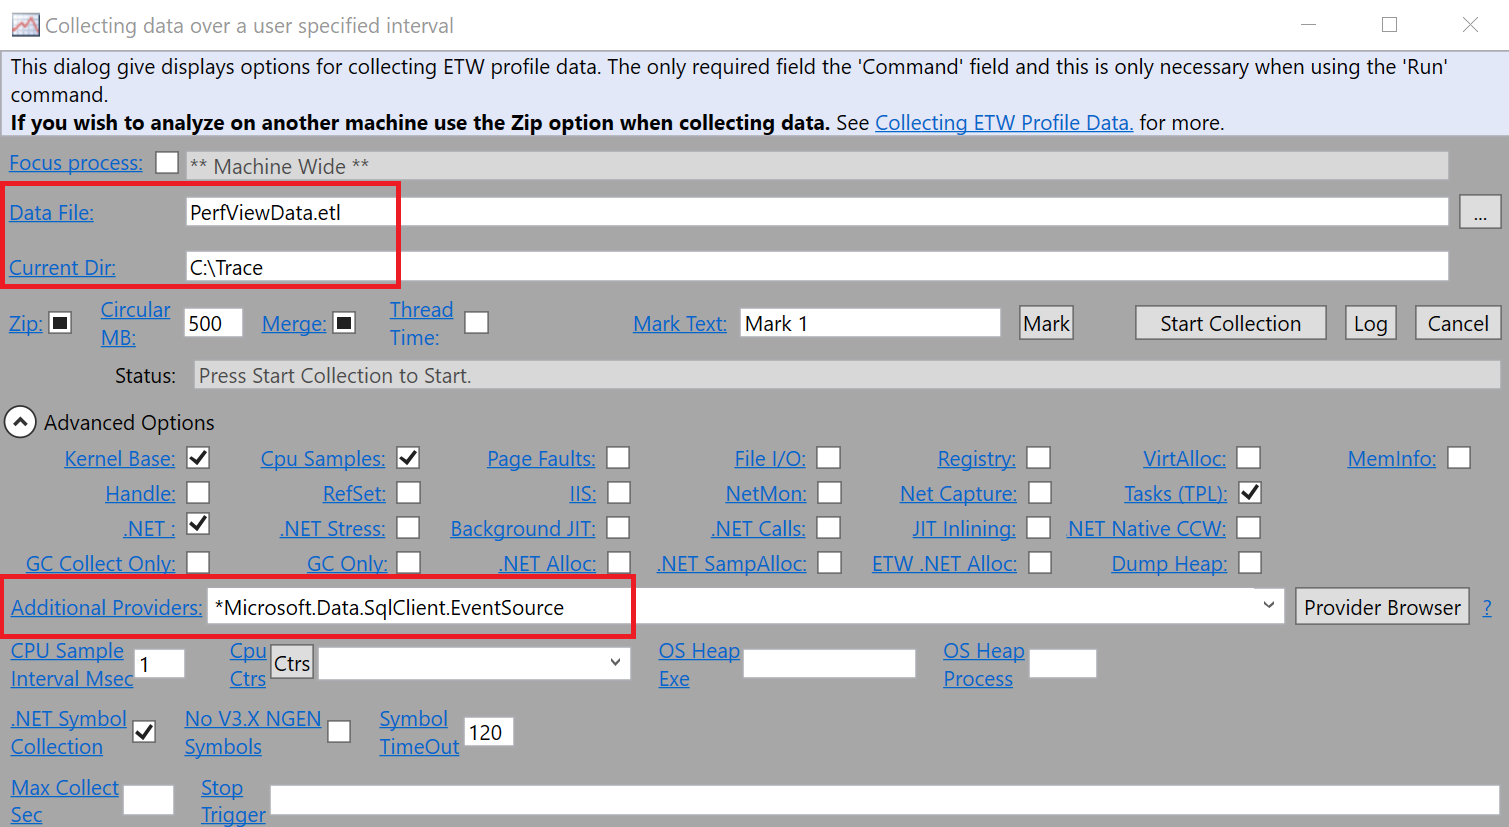
开始收集。
运行本机 SNI 跟踪示例以连接到 SQL Server。
停止 PerfView 中的收集。 根据步骤 2 中的配置,生成 PerfViewData.etl 文件需要一段时间。
在 PerfView 中打开
etl文件。 可以通过Microsoft.Data.SqlClient.EventSource/SNIScope和Microsoft.Data.SqlClient.EventSource/SNITrace事件名称找到 SNI 跟踪日志。
使用 dotnet-trace 收集跟踪信息
在 Linux、macOS 或 Windows 上,可以使用 dotnet-trace 捕获跟踪信息。 dotnet-trace 工具用于收集 .NET 应用程序的跟踪。 有关 dotnet-trace 的详细信息,请参阅 dotnet-trace 性能分析实用工具。可在 PerfView 中查看 dotnet-trace 创建的跟踪。
如果尚未安装,请在客户端计算机上安装 .NET SDK。
运行 dotnet-trace。
--providers参数要求为来自 Microsoft.Data.SqlClient 的跟踪指定提供程序名称和关键字。 关键字选项是转换为十六进制的事件关键字表中关键字值的总和。 若要以MyApplication详细级别从应用程序启动时开始收集所有事件,关键字的总和应为 8191(十六进制表示为1FFF)。 此命令中通过5指定详细级别。dotnet-trace collect --providers Microsoft.Data.SqlClient.EventSource:1FFF:5 -- dotnet MyApplication.dll输出为:
Provider Name                           Keywords            Level               Enabled By
Microsoft.Data.SqlClient.EventSource    0x0000000000001FFF  Verbose(5)          --providers

Launching: dotnet MyApplication.dll
Process        : /usr/lib/dotnet/dotnet
Output File    : /home/appuser/dotnet_20240927_102506.nettrace

[00:00:00:00]   Recording trace 0.00     (B)
Press <Enter> or <Ctrl+C> to exit...

Trace completed.
Process exited with code '1'.
若要在正在运行的应用程序的信息级别收集所有事件,请先查找应用程序的进程 ID。 然后在进程中运行 dotnet-trace。 信息级别由
4指定。dotnet-trace ps 8734 MyApplication /home/appuser/MyApplication/MyApplication dotnet-trace collect --process-id 8734 --providers Microsoft.Data.SqlClient.EventSource:1FFF:4单独运行应用程序,并让其运行足够长的时间以重现该问题。 如果是 CPU 占用率高的问题,通常 5 到 10 秒就足够了。
Provider Name                           Keywords            Level               Enabled By
Microsoft.Data.SqlClient.EventSource    0x0000000000001FFF  LogAlways(0)        --providers

Process        : /usr/lib/dotnet/dotnet
Output File    : /home/appuser/dotnet_20240927_104154.nettrace

[00:00:00:10]   Recording trace 4.096    (KB)
Press <Enter> or <Ctrl+C> to exit...
Stopping the trace. This may take several minutes depending on the application being traced.

Trace completed.
跟踪文件名称以
.nettrace结尾。 如果在 Windows 上未进行跟踪,请将文件复制到 Windows 系统中。 在 PerfView 中查看跟踪文件。