ESG data estate
ESG data estate capability centralizes and harmonizes ESG data from various data sources into datasets based on a standardized sustainability analytical schema. ESG data estate helps eliminate data silos and it normalizes and harmonizes data for various sustainability requirements.
ESG data estate includes the following functionalities:
Ingest - This functionality unifies and standardizes the ESG data sets from disparate data sources such as Microsoft Sustainability Manager and other non-Microsoft sources, for requirements like disclosures, analytics, insights for reduction. Data is ingested and standardized from multiple source systems with the ESG data schema and lakehouses.
Compute - This functionality computes metrics and generates analytical datasets. ESG metrics are calculated with prebuilt or custom data processing artifacts.
Visualize - This functionality helps visualize computed metrics using the aggregated datasets in analytics using built-in and custom dashboards.
ESG data estate resources
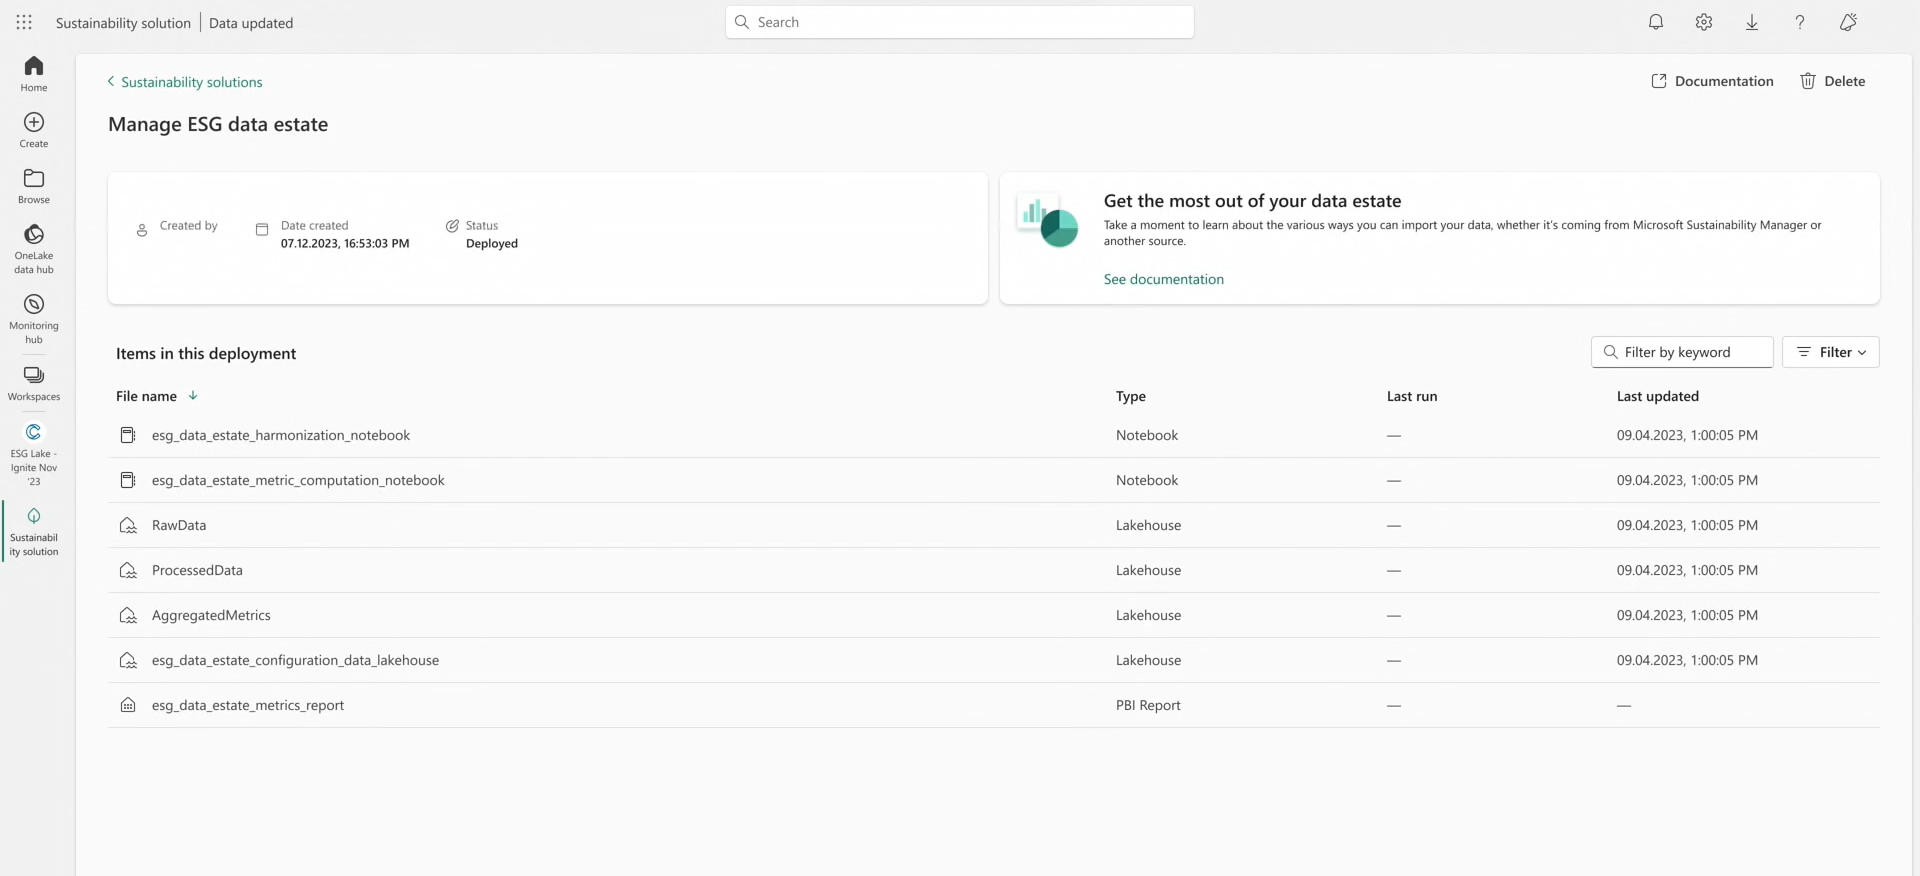
ESG data estate includes notebooks and data lakes that facilitate the transformation, computation, and storage of data from its raw form to computed ESG metrics based on standardized ESG data models.
Data lakes that ESG data estate deploys include:
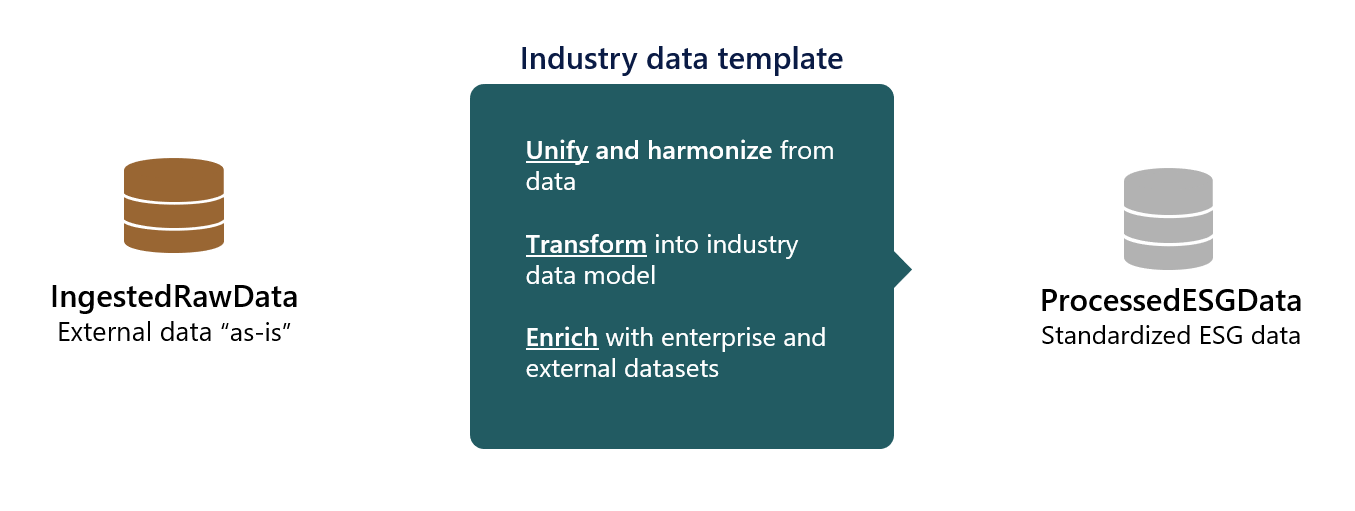
IngestedRawData - Stores raw data from external data sources.
ProcessedESGData - Stores harmonized data that conforms to a standardized ESG data model.
ComputedESGMetrics - Stores computed ESG metrics and aggregated analytical datasets.
ConfigAndDemoData - Stores certain transformation libraries, reference, and demo data.
All resources that ESG data estate deploy are prebuilt and integrated into your Fabric workspace. These resources are open and allow you to customize them according to your specific needs. For more information, see ESG data estate.
Data ingestion and transformation
You can integrate data from disparate sources into your ESG data estate. This functionality deploys the IngestedRawData lakehouse, or data lake, within your Fabric workspace, preserving the source data. After you ingest the source data into the IngestedRawData lakehouse, you can unify and harmonize the data into the sustainability analytical schema. You can also connect select data sources to a lakehouse without the need for data ingestion by using Fabric.
Sustainability analytical schema
The sustainability analytical schema is a purpose-built sustainability schema with entities to store environmental, social, and governance (ESG) data. It also covers business operations tables, such as finance, human resources (HR), and so on. The schema can store data at multiple asset granularities and organizational hierarchies.
The following steps outline the process of integrating emissions, water, and waste data from Microsoft Sustainability Manager and then transforming it into the sustainability analytical schema.
Set up Microsoft Azure Synapse Link - Set up an Azure Synapse Link that enables the flow of data from the Microsoft Sustainability Manager environment into your ESG data estate.
Link the Microsoft Azure Data Lake Storage container - Use the Fabric shortcut functionality to link the Data Lake Storage container with Microsoft Sustainability Manager data to the IngestedRawData lakehouse of the deployed capability.
Transform data - Use the data transformation notebooks to transform data into the sustainability analytical schema.
For more information, see, Import and transform Sustainability Manager data.
Ingest external data and data transformation
You can use Microsoft Fabric ingestion capabilities, such as data pipelines and data flows, to integrate your data from disparate sources into the IngestedRawData lakehouse. After integrating your data, you can transform it to the ESG data model schema by using Microsoft Fabric dataflows, or you can use it to build and run notebooks.
You can explore the ESG data model schema by using the following artifacts, which the system deploys in the workspace during the ESG data estate deployment.
ESGschema.json - This file provides the schema of the tables in Microsoft Cloud for Sustainability ESG data model, including details of columns, primary key, and foreign key relationships for each table. This file is in the Config folder of the ConfigAndDemoData lakehouse.
GenerateESGTables - This notebook provides the Create Table function. You can create empty tables for water, waste, and greenhouse gas (GHG) emissions.
Compute metrics and analytical datasets
After standardizing the data, you can create an ESG metrics mesh that comprises aggregated datasets and computed Corporate Sustainability Reporting Directive (CSRD) metrics that are ready for analytics and reporting. The computation logic for certain CSRD quantitative metrics across ESG is predefined and provided with the ESG data estate capability. You can extend and update these notebooks as required. You can use them to define other metrics and modify the computation logic for the already defined metrics.
The notebooks that you can use for computation of analytical datasets and metrics are:
Data denormalization notebooks - You can set up these notebooks to generate fact tables to support ESG metrics and analytical datasets.
Metric computation notebooks - Support mandatory Corporate Sustainability Reporting Directive (CSRD) and Global Reporting Initiative (GRI)-related metrics, which are customizable and extensible.
Visualize computed metrics
After the system computes the metrics and stores them as tables, you can use the prebuilt Power BI dashboard to:
Visualize and explore the CSRD metrics.
Perform drill-down actions.
View year-over-year comparisons.
You can validate if the data is good for reporting by using the CSRDMetricsReportDataset semantic model.
The following screenshot shows the prebuilt dashboards that you can use to visualize and explore metrics data.


