Microsoft Azure emissions insights
With the Microsoft Azure emissions insights capability, you can centralize, query, and analyze your Azure emissions data. You can analyze trends over time for your emissions by subscriptions and resources, and you can gain insights into the top contributors. You can explore your Azure emissions data through interactive dashboards, allowing you to compare, slice, and drill down into the data by time and resources. Additionally, you can run analytical queries and create custom reports on the Azure emissions data in lakehouses. These reports offer actionable insights to help you identify opportunities for reducing your Microsoft Cloud emissions.
The Microsoft Azure emissions insights capability includes the following features:
Unify - This functionality unifies Microsoft emissions data in one actionable and queryable data lake. It helps fetch and analyze Azure emissions data against the cloud usage.
Enrich - This functionality processes and enriches Microsoft emissions data to support custom reporting and analytics. You can query and drill down into Azure resource level emissions for advanced reporting and analysis.
Analyze - This functionality helps visualize, analyze and report on Microsoft emissions, including tenants, workloads, and emission scopes. You can compare emissions data across subscriptions and resources to identify opportunities to reduce emissions.
Microsoft Azure emissions insights resources
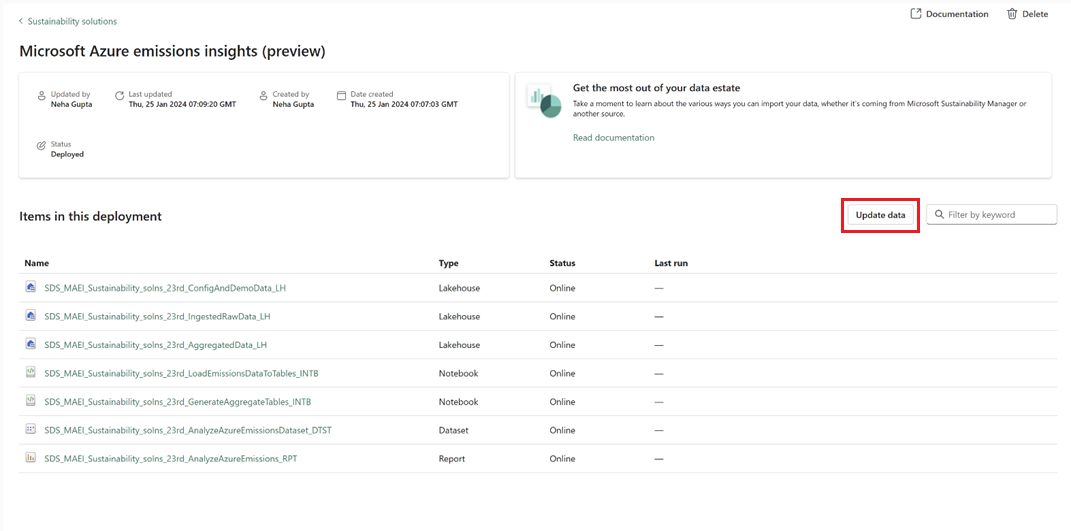
You can deploy notebooks and lakehouses with this capability to ingest, aggregate, and store data.
Lakehouses that the solution deploys for this capability include:
ConfigAndDemoData - Stores the demo data.
IngestedRawData - Stores raw data from external data sources.
AggregatedData - Stores the aggregated data that you can use to analyze emissions.
All resources that this solution deploys are prebuilt and placed into your Fabric workspace. These resources are open, and you can customize them based on your needs. For more information, see Microsoft Azure emissions insights.
Unify Azure emissions data
With the on-demand mechanism to fetch raw Azure emissions data from Microsoft, you can collect data from disparate sources into your IngestedRawData lakehouse. The solution stores the data in the IngestedRawData lakehouse without modifications or transformations.
This feature deploys three lakehouses, two notebooks, one dataset, and one report. You can pull the Azure emissions data into your IngestedRawData lakehouse and monitor the status.
Note
You must have a billing admin role to perform the Update data function.
Enrich emissions data
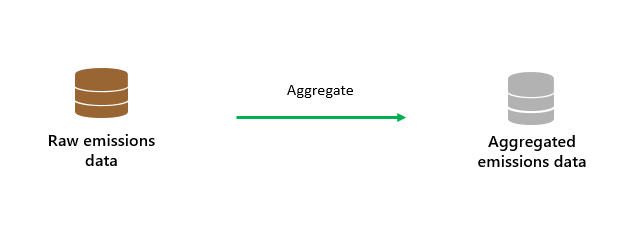
The enrich emissions data feature deploys the notebooks to aggregate raw Azure emissions data by month, subscription, and resource. You can enrich the aggregated data with contextual information to analyze the trends over time for your emissions.
Visualize and analyze emissions
After the data loads into the tables, you can use the prebuilt Power BI dashboard for analyzing the emissions. The prebuilt dashboards drill down and compare Azure emissions data across subscriptions and resources. You can visualize trends in Azure emissions data based on the resource changes.


