Exercise - Review the waste quantity dashboard
In this exercise, you assume the persona of Amber Rodriguez, sustainability specialist for Contoso Corp, and use the waste quantity dashboards to gain insights.
Access the waste insights dashboards
To access the waste sustainability dashboards, follow these steps:
Important
Make sure that you've completed the previous exercise to ensure that the dashboards and reports show meaningful data.
In the Sustainability Manager application, on the left navigation pane, select Analytics > Waste insights.

You can review the dashboards in the following tabs:
Waste quantity (the default view)
Waste quality
Circularity (Input material)
Circularity (Finished good)

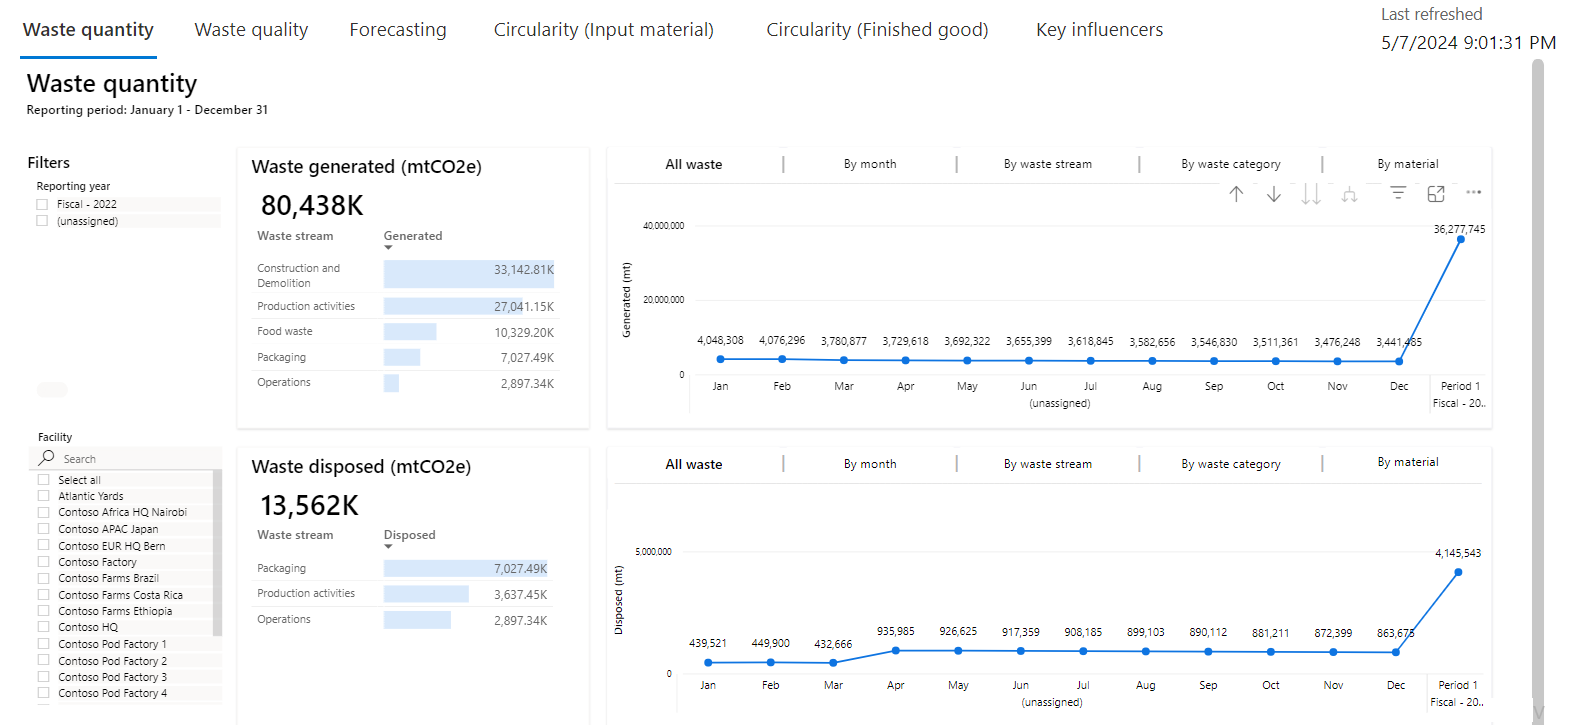
Review the Waste quantity dashboard
You can view your organization’s waste quantity data. It displays the total waste generated by diversion method, hazardous and radioactive waste type at a facility, or organizational unit level for the reporting period.
To review the Waste quantity dashboard, follow these steps:
Select the Waste quantity tab. The Waste quantity tab opens by default.
Review the dashboards on the following tabs:
Waste generated
Waste disposed
Waste recovered
The corresponding charts for each tile have these five tabs:
All waste
By month
By waste stream
By waste category
By material
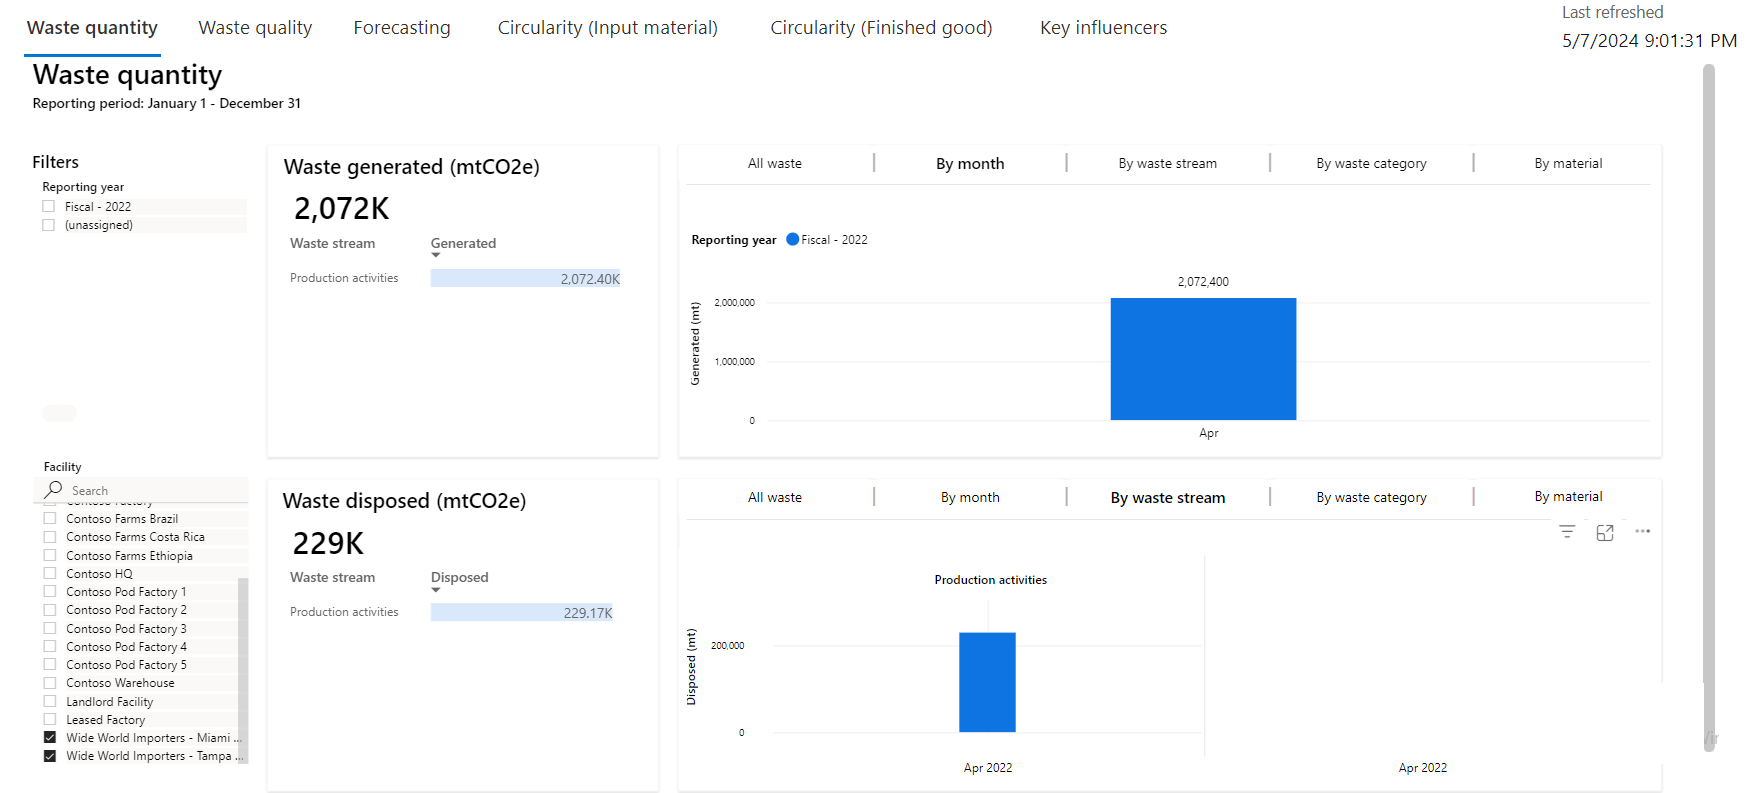
Select Wide World Importers - Miami Office or Wide World Importers - Tampa Office.
The waste data is analyzed with respect to all tabs that are available for each waste quantity transaction.


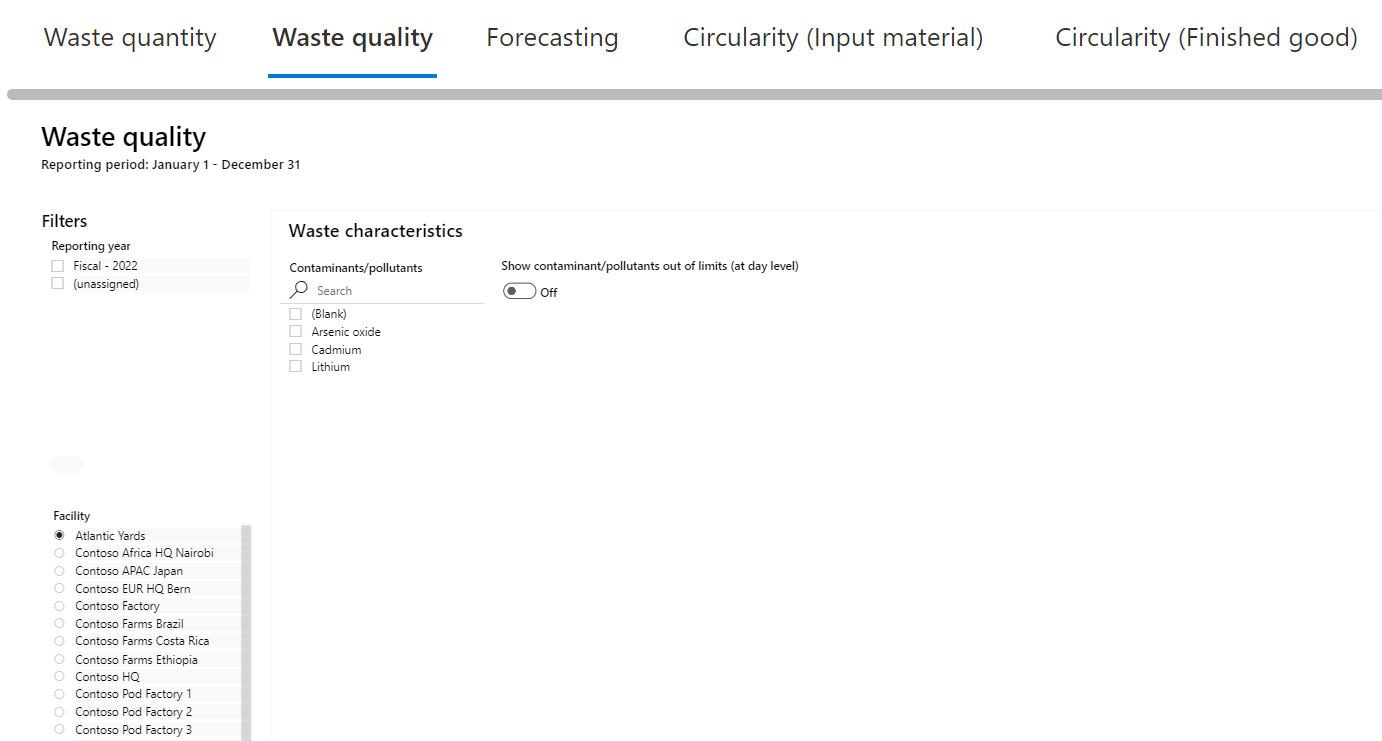
Review the Waste quality dashboard
You view the waste quality or characteristics related data at a facility or organizational unit level by reporting period. The waste quality or characteristics data primarily consist of the hazardous or special waste quality characteristics information. This information is for the waste recycled or disposed from the facilities.
Select the Waste quality tab. You can filter by the reporting years. You can also use the filters waste quality characteristic, facility, or organizational hierarchy.

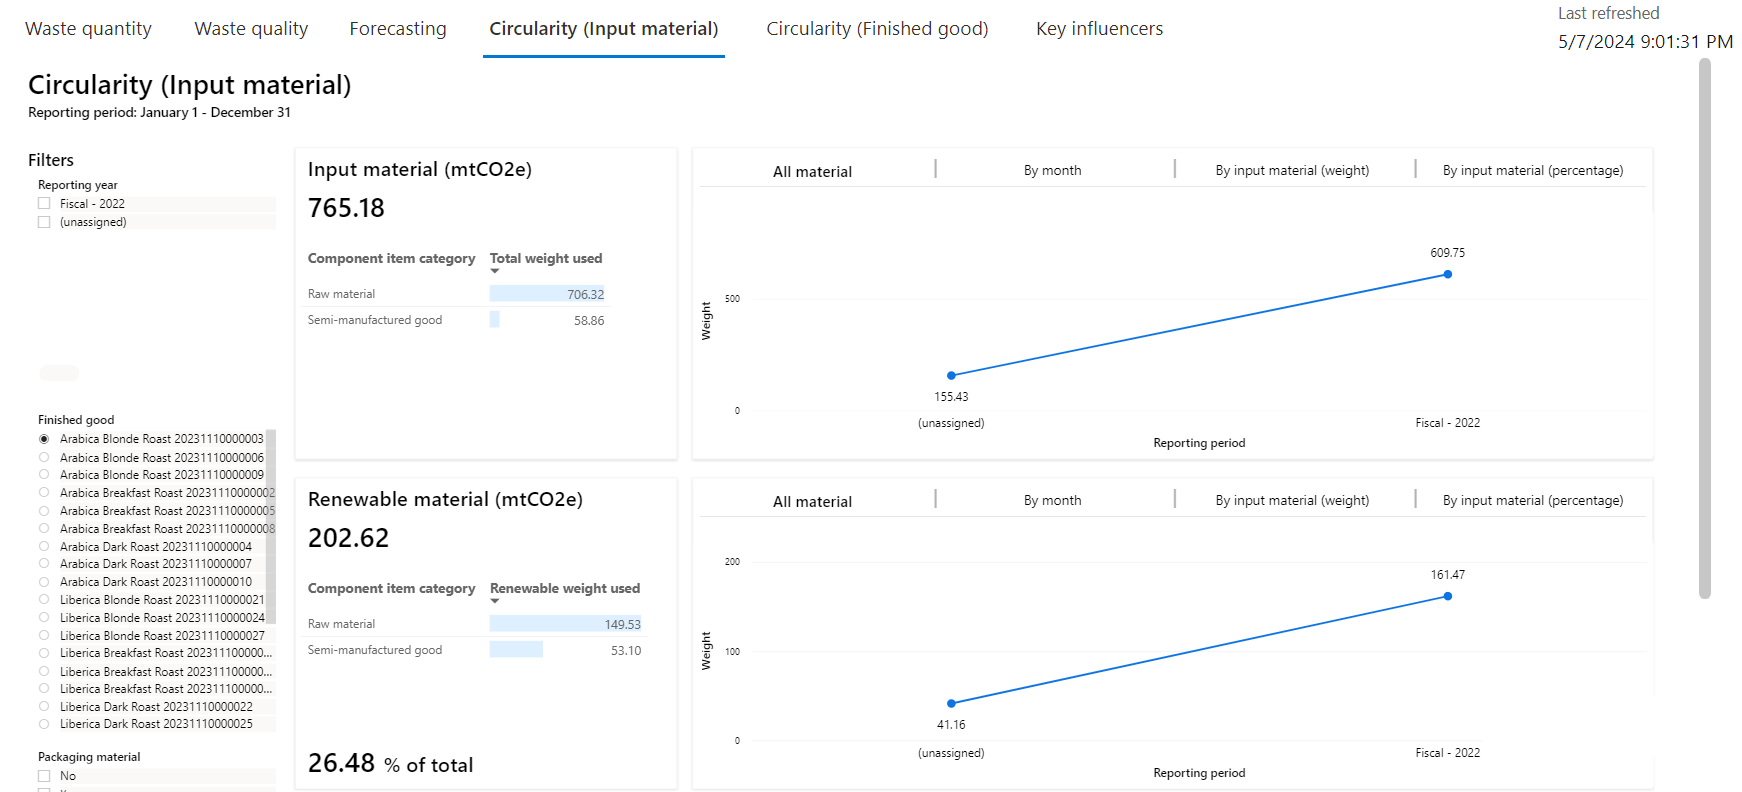
Review the Circularity (Input material) dashboard
You can view the circular practices implemented during the inflow of materials into your organization. Circularity is an important means of reducing waste and resource consumption by keeping materials, products, and services in use for as long as possible. The dashboard displays the quantity of component items used and the percentage of sustainable content such as renewability, reusability, and recyclability present in these items for each finished good. You can further filter by packaging material or reporting period.
To review the Circularity (Input material) dashboard, follow these steps:
Select the Circularity (Input material) tab.
The Circularity (Input method) dashboard includes the following four tiles:
Input material
Renewable material
Reused material
Recycled material
To view the corresponding charts for each of these tiles, select one of these tabs:
All material
By month
By input material (weight)
By input material (percentage)

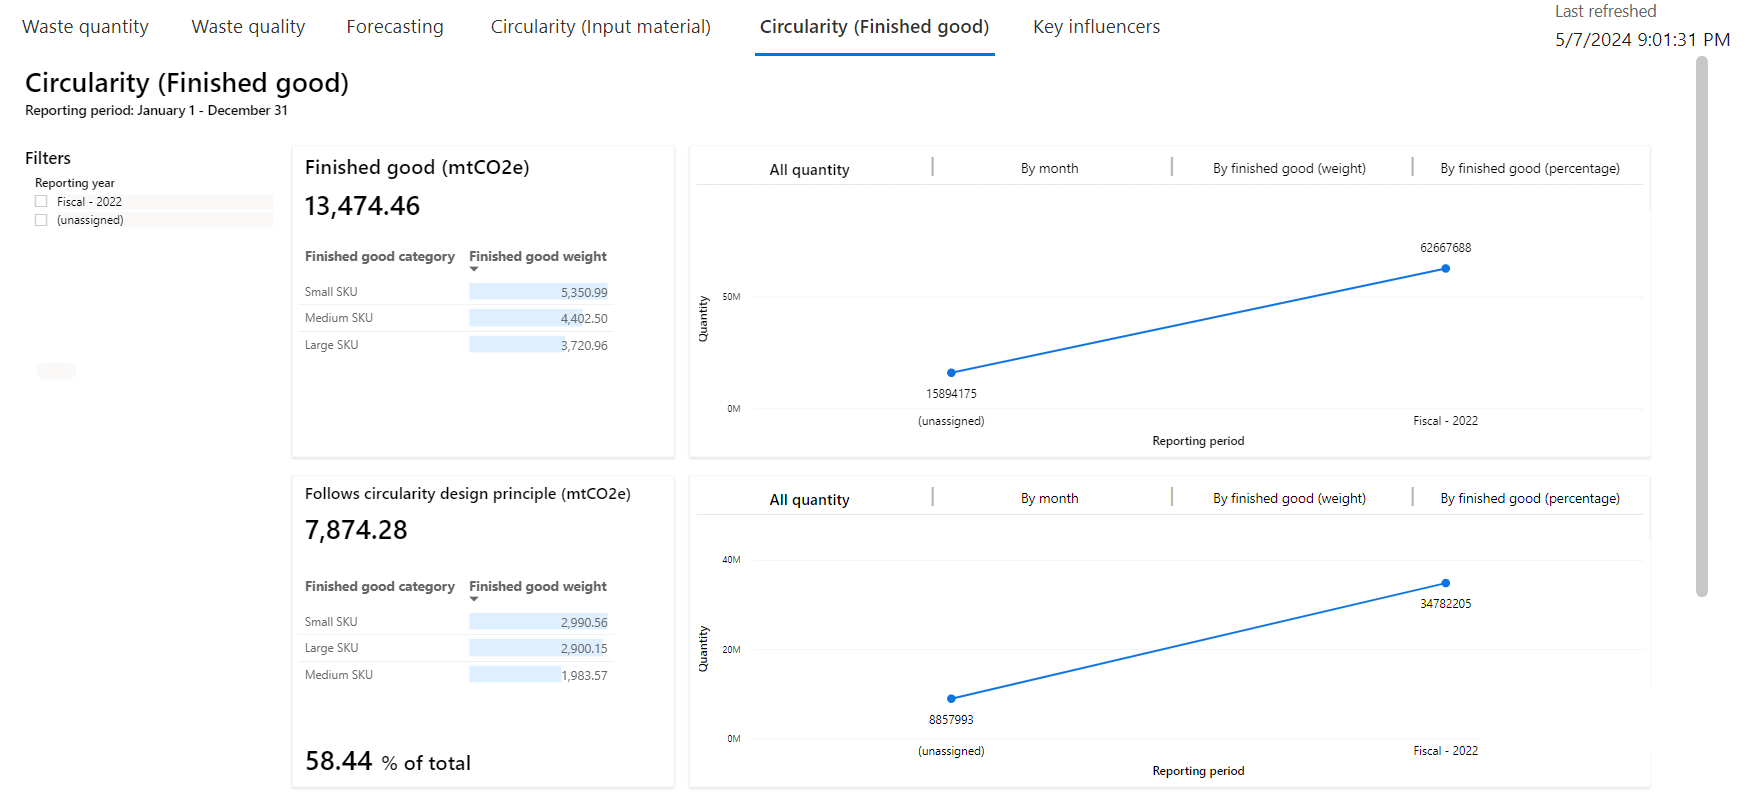
Review the Circularity (Finished good) dashboard
You can view the circular design principles implemented in final finished products. The dashboard shows the total quantity and the percentage of finished goods following the circularity design principles.
To review the Circularity (Finished good) dashboard, follow these steps:
Select the Circularity (Finished good) tab.
The Circularity (Finished good) dashboard includes the following two tiles:
Finished good
Follows circularity design principle
To view the corresponding charts for each of these tiles, select one of these tabs:
All quantity
By month
By finished good (weight)
By finished good (percentage)