查詢通話記錄
概觀和存取
在您可充分利用 Log Analytics 以取得通訊服務記錄之前,必須先遵循在診斷設定中啟用記錄中所述的步驟。 啟用記錄和 Log Analytics 工作區之後,您就能存取許多實用的預設查詢套件,藉以協助您快速視覺化並瞭解記錄中可用的資料,如下所述。 透過 Log Analytics,您也可透過 Azure 監視器 Workbooks 存取更多通訊服務深入解析、建立自己查詢和 Workbook 的能力,並可取得對任何查詢的 Log Analytics 概觀。
存取
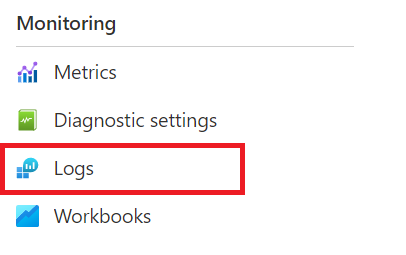
您可從 [通訊服務] 資源頁面開始存取查詢,然後按一下 [監視] 區段內左側導覽中的 [記錄]:
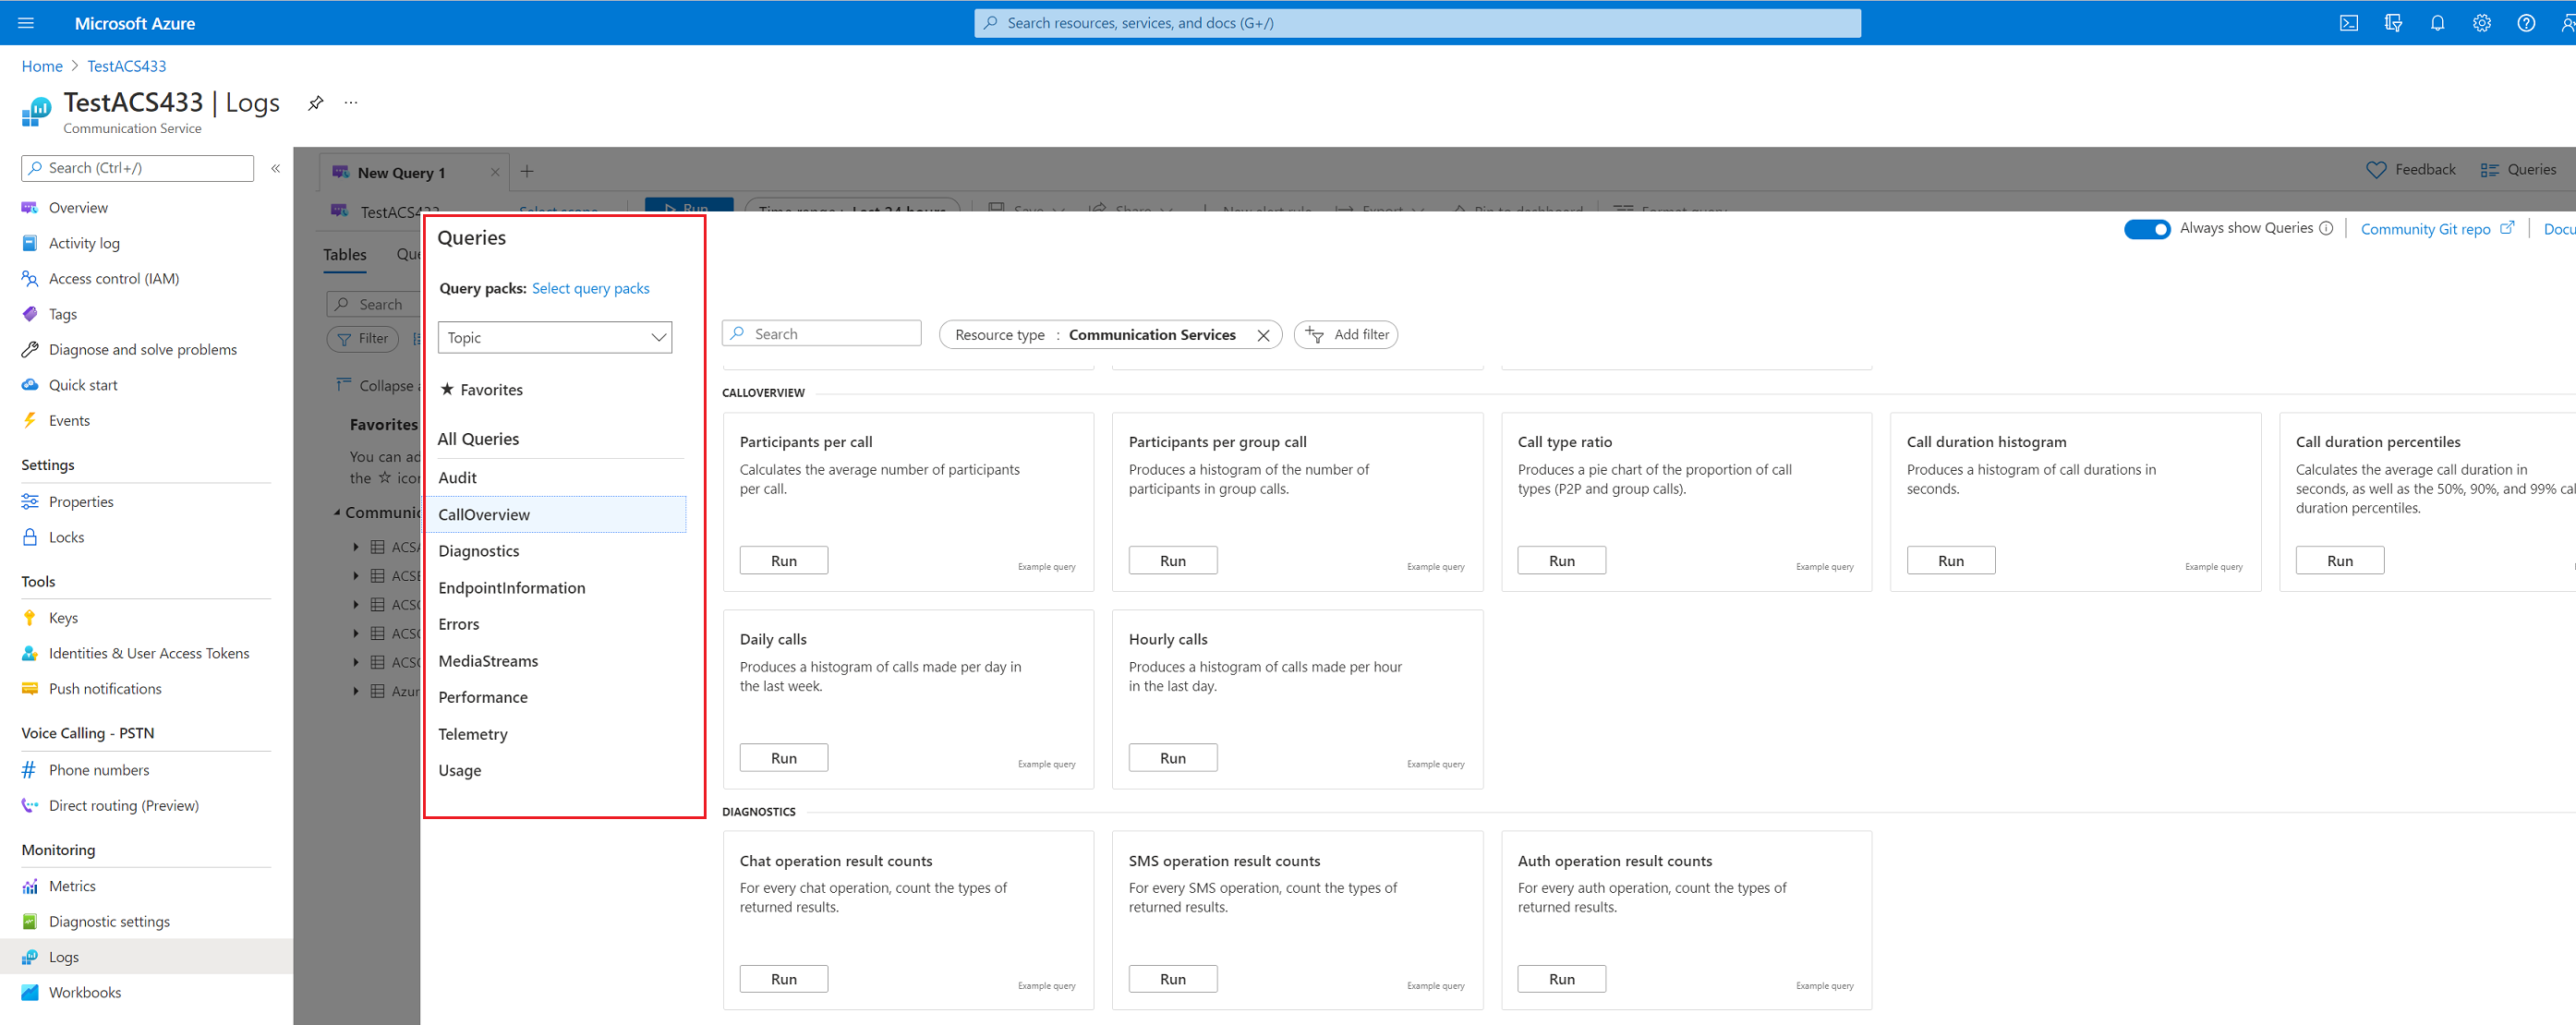
從這裡,您會看到強制回應畫面,其中包含通訊服務可用的所有預設查詢套件,以及瀏覽左側提供的查詢套件清單。
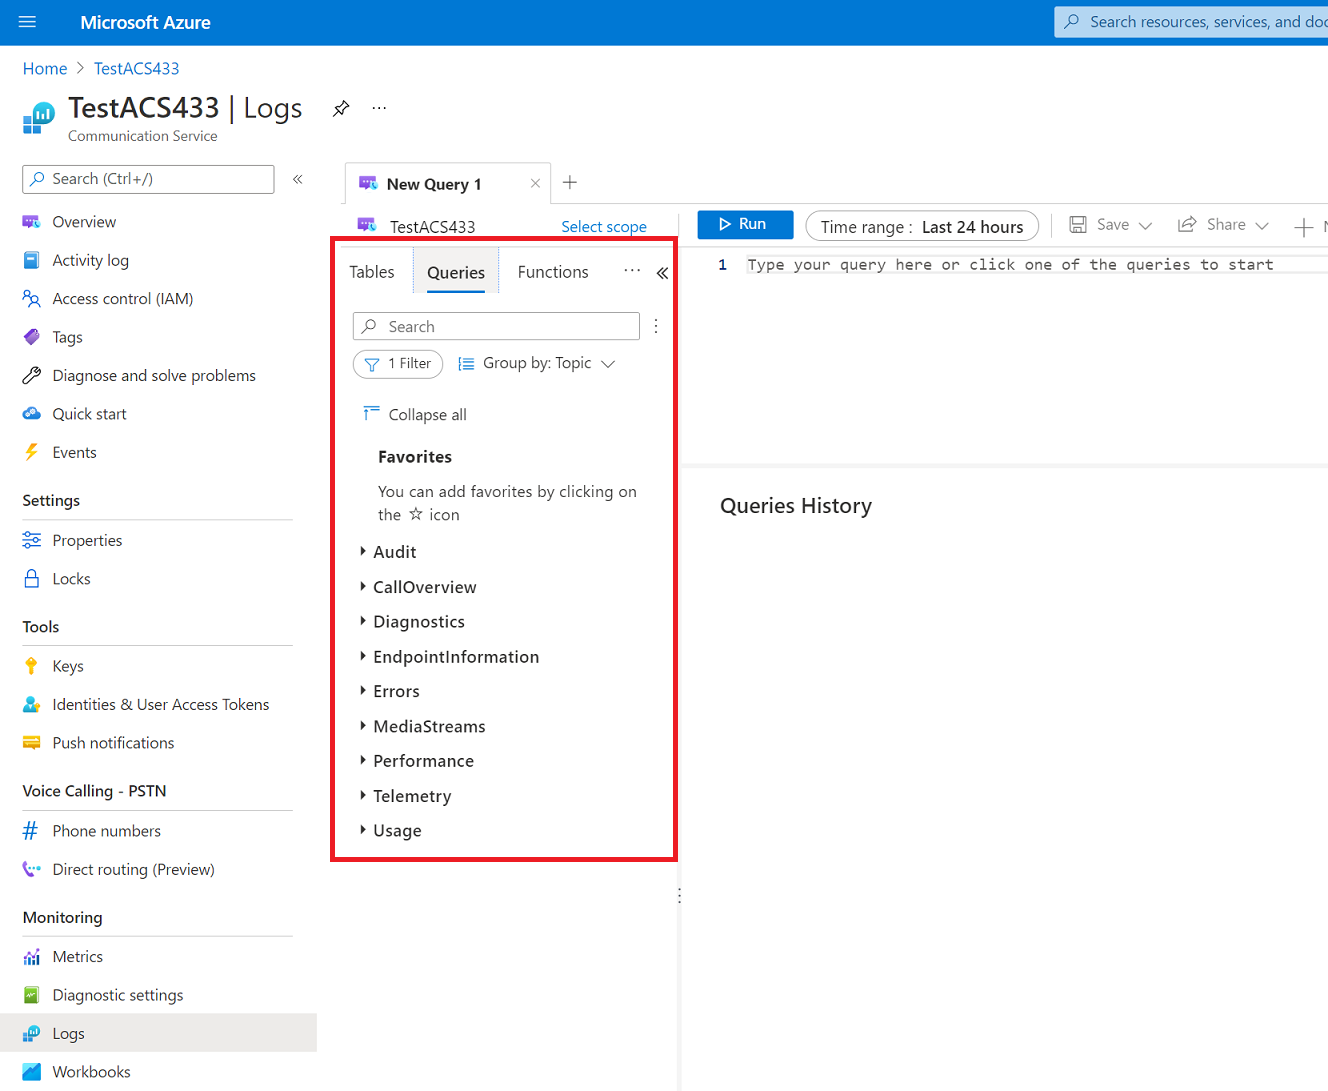
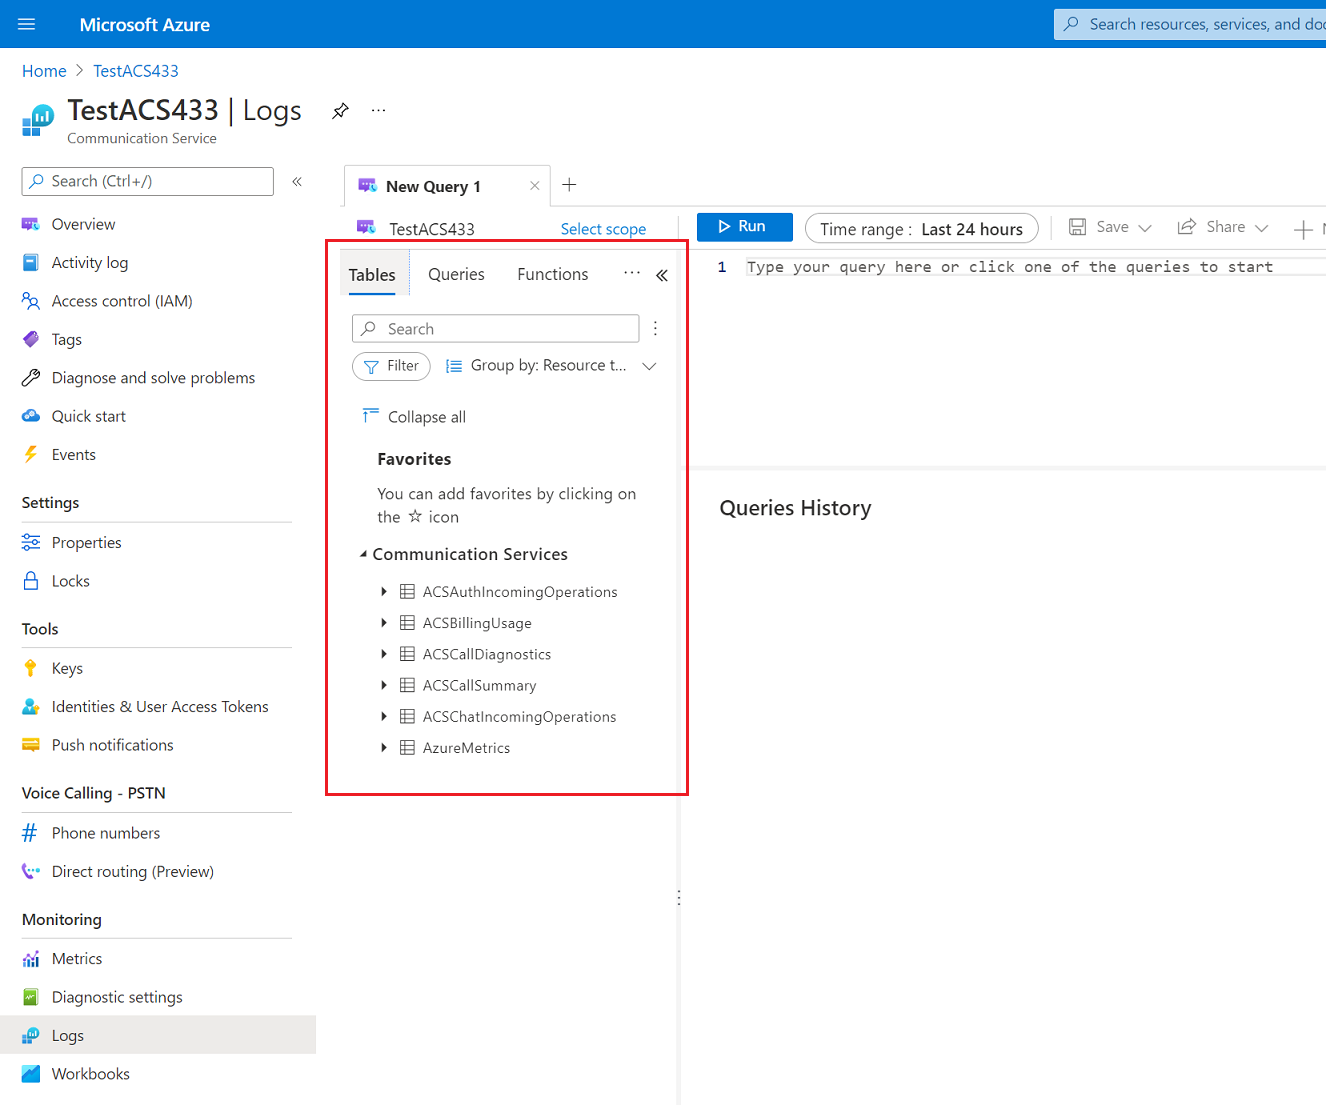
如果您關閉強制回應畫面,仍可瀏覽至各種查詢套件,並根據您在診斷設定中啟用的記錄和計量結構描述,直接存取資料表形式的資料。 在這裡,您可使用 KQL (Kusto) 根據資料建立自己的查詢。 若要深入瞭解如何使用、編輯和建立查詢,請參閱:Log Analytics 查詢
通話摘要和通話診斷記錄的預設查詢套件
下列是預設查詢套件中每個查詢的說明 (適用於通話摘要和通話診斷記錄),其中包含每個可用查詢的程式碼範例和範例輸出:
通話概觀查詢
每個通話的參與者數目
// Count number of calls and participants,
// and print average participants per call
ACSCallSummary
| distinct CorrelationId, ParticipantId, EndpointId
| summarize num_participants=count(), num_calls=dcount(CorrelationId)
| extend avg_participants = todecimal(num_participants) / todecimal(num_calls)
範例輸出:

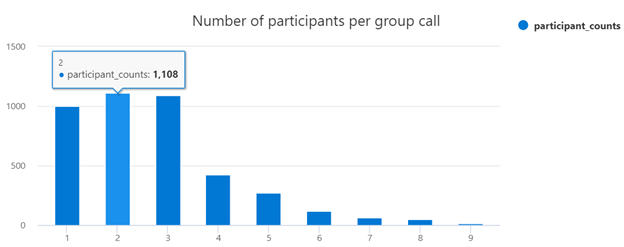
每個群組通話的參與者數目
// Count number of participants per group call
ACSCallSummary
| where CallType == 'Group'
| distinct CorrelationId, ParticipantId
| summarize num_participants=count() by CorrelationId
| summarize participant_counts=count() by num_participants
| order by num_participants asc
| render columnchart with  (xcolumn = num_participants, title="Number of participants per group call")
範例輸出:
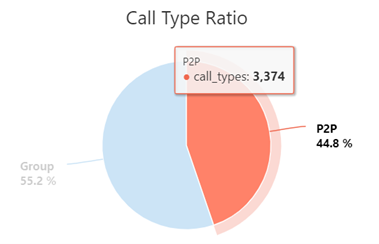
通話類型的比率
// Ratio of call types
ACSCallSummary
| summarize call_types=dcount(CorrelationId) by CallType
| render piechart title="Call Type Ratio"
範例輸出:
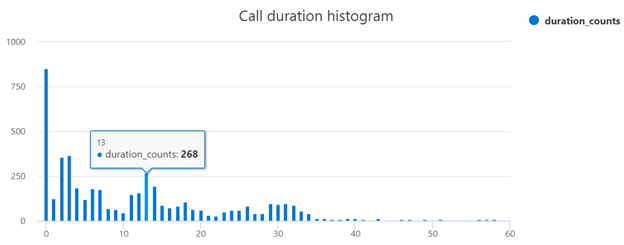
通話持續時間分佈
// Call duration histogram
ACSCallSummary
| distinct CorrelationId, CallDuration
|summarize duration_counts=count() by CallDuration
| order by CallDuration asc
| render columnchart with (xcolumn = CallDuration, title="Call duration histogram")
範例輸出:
通話持續時間百分位數
// Call duration percentiles
ACSCallSummary
| distinct CorrelationId, CallDuration
| summarize avg(CallDuration), percentiles(CallDuration, 50, 90, 99)
範例輸出:

端點資訊查詢
每個通話的端點數目
// Count number of calls and endpoints,
// and print average endpoints per call
ACSCallSummary
| distinct CorrelationId, EndpointId
| summarize num_endpoints=count(), num_calls=dcount(CorrelationId)
| extend avg_endpoints = todecimal(num_endpoints) / todecimal(num_calls)
範例輸出:

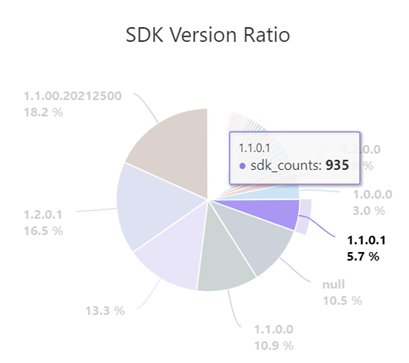
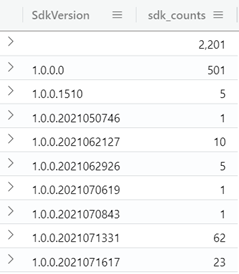
SDK 版本的比率
// Ratio of SDK Versions
ACSCallSummary
| distinct CorrelationId, ParticipantId, EndpointId, SdkVersion
| summarize sdk_counts=count() by SdkVersion
| order by SdkVersion asc
| render piechart title="SDK Version Ratio"
範例輸出:
OS 版本的比率 (簡化的 OS 名稱)
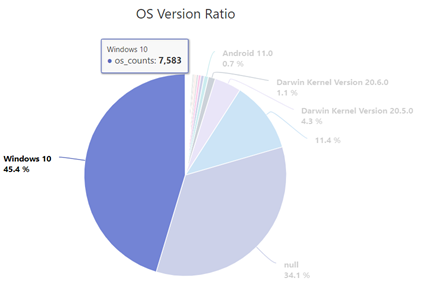
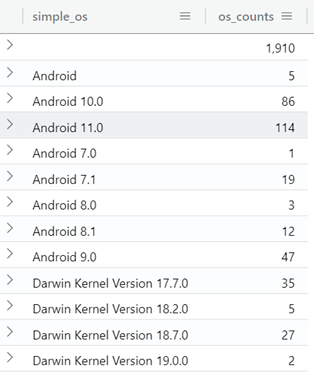
// Ratio of OS Versions (simplified OS name)
ACSCallSummary
| distinct CorrelationId, ParticipantId, EndpointId, OsVersion
| extend simple_os = case(  indexof(OsVersion, "Android") != -1, tostring(split(OsVersion, ";")[0]),
                            indexof(OsVersion, "Darwin") != -1, tostring(split(OsVersion, ":")[0]),
                            indexof(OsVersion, "Windows") != -1, tostring(split(OsVersion, ".")[0]),
                            OsVersion
                        )
| summarize os_counts=count() by simple_os
| order by simple_os asc
| render piechart title="OS Version Ratio"
範例輸出:
媒體串流查詢
每個通話的串流
// Count number of calls and streams,
// and print average streams per call
ACSCallDiagnostics
| summarize num_streams=count(), num_calls=dcount(CorrelationId)
| extend avg_streams = todecimal(num_streams) / todecimal(num_calls)
範例輸出:

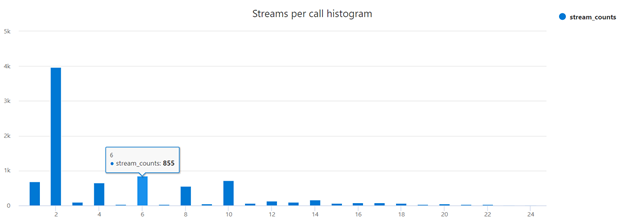
每個通話的串流長條圖
// Distribution of streams per call
ACSCallDiagnostics
| summarize streams_per_call=count() by CorrelationId
| summarize stream_counts=count() by streams_per_call
| order by streams_per_call asc
| render columnchart title="Streams per call histogram"
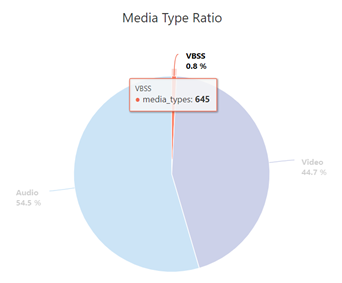
媒體類型的比率
// Ratio of media types by call
ACSCallDiagnostics
| summarize media_types=count() by MediaType
| render piechart title="Media Type Ratio"
品質計量查詢
平均遙測值
// Average telemetry values over all streams
ACSCallDiagnostics
| summarize Avg_JitterAvg=avg(JitterAvg),
            Avg_JitterMax=avg(JitterMax),
            Avg_RoundTripTimeAvg=avg(RoundTripTimeAvg),
            Avg_RoundTripTimeMax=avg(RoundTripTimeMax),
            Avg_PacketLossRateAvg=avg(PacketLossRateAvg),
            Avg_PacketLossRateMax=avg(PacketLossRateMax)

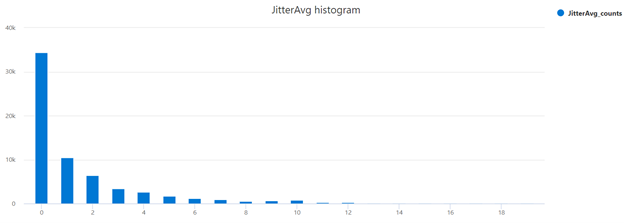
JitterAvg 長條圖
// Jitter Average Histogram
ACSCallDiagnostics
| where isnotnull(JitterAvg)
| summarize JitterAvg_counts=count() by JitterAvg
| order by JitterAvg asc
| render columnchart with (xcolumn = JitterAvg, title="JitterAvg histogram")
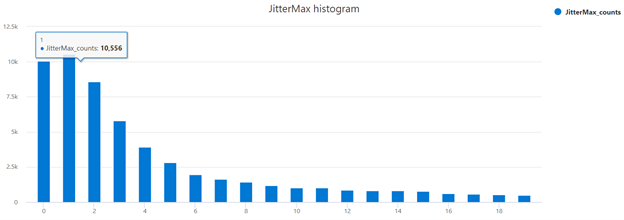
JitterMax 長條圖
// Jitter Max Histogram
ACSCallDiagnostics
| where isnotnull(JitterMax)
|summarize JitterMax_counts=count() by JitterMax
| order by JitterMax asc
| render columnchart with (xcolumn = JitterMax, title="JitterMax histogram")
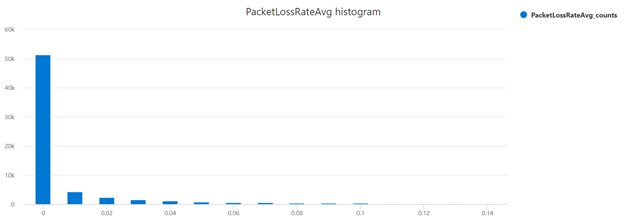
PacketLossRateAvg 長條圖
// PacketLossRate Average Histogram
ACSCallDiagnostics
| where isnotnull(PacketLossRateAvg)
|summarize PacketLossRateAvg_counts=count() by bin(PacketLossRateAvg, 0.01)
| order by PacketLossRateAvg asc
| render columnchart with (xcolumn = PacketLossRateAvg, title="PacketLossRateAvg histogram")
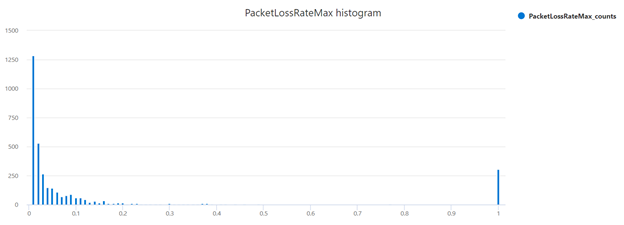
PacketLossRateMax 長條圖
// PacketLossRate Max Histogram
ACSCallDiagnostics
| where isnotnull(PacketLossRateMax)
|summarize PacketLossRateMax_counts=count() by bin(PacketLossRateMax, 0.01)
| order by PacketLossRateMax asc
| render columnchart with (xcolumn = PacketLossRateMax, title="PacketLossRateMax histogram")
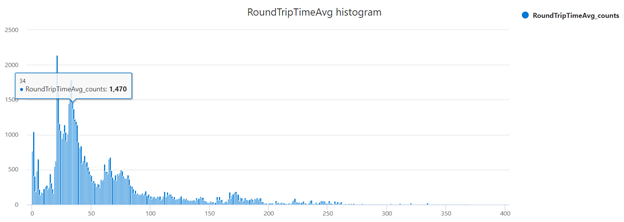
RoundTripTimeAvg 長條圖
// RoundTripTime Average Histogram
ACSCallDiagnostics
| where isnotnull(RoundTripTimeAvg)
|summarize RoundTripTimeAvg_counts=count() by RoundTripTimeAvg
| order by RoundTripTimeAvg asc
| render columnchart with (xcolumn = RoundTripTimeAvg, title="RoundTripTimeAvg histogram")
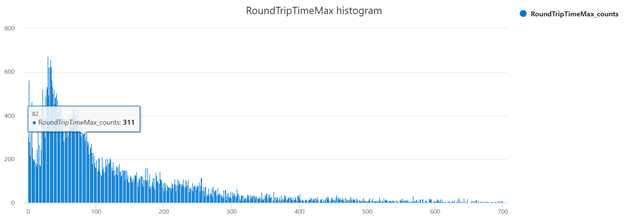
RoundTripTimeMax 長條圖
// RoundTripTime Max Histogram
ACSCallDiagnostics
| where isnotnull(RoundTripTimeMax)
|summarize RoundTripTimeMax_counts=count() by RoundTripTimeMax
| order by RoundTripTimeMax asc
| render columnchart with (xcolumn = RoundTripTimeMax, title="RoundTripTimeMax histogram")
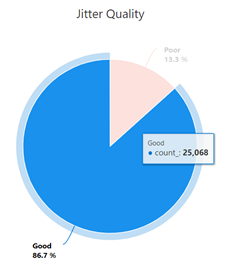
不良抖動品質
// Get proportion of calls with poor quality jitter
// (defined as jitter being higher than 30ms)
ACSCallDiagnostics
| extend JitterQuality = iff(JitterAvg > 30, "Poor", "Good")
| summarize count() by JitterQuality
| render piechart title="Jitter Quality"
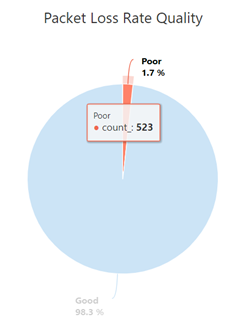
PacketLossRate 品質
// Get proportion of calls with poor quality packet loss
// rate (defined as packet loss being higher than 10%)
ACSCallDiagnostics
| extend PacketLossRateQuality = iff(PacketLossRateAvg > 0.1, "Poor", "Good")
| summarize count() by PacketLossRateQuality
| render piechart title="Packet Loss Rate Quality"
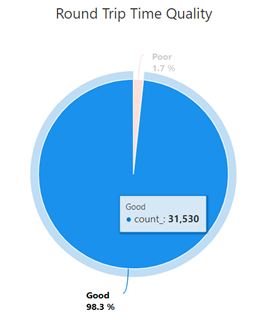
RoundTripTime 品質
// Get proportion of calls with poor quality packet loss
// rate (defined as packet loss being higher than 10%)
ACSCallDiagnostics
| extend PacketLossRateQuality = iff(PacketLossRateAvg > 0.1, "Poor", "Good")
| summarize count() by PacketLossRateQuality
| render piechart title="Packet Loss Rate Quality"
可參數化查詢
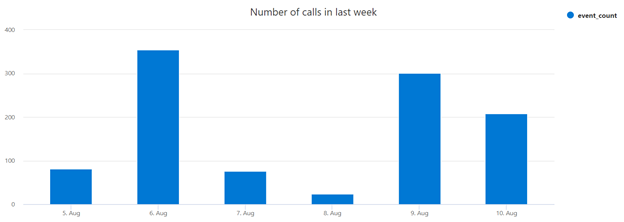
過去一週的每日通話數
// Histogram of daily calls over the last week
ACSCallSummary
| where CallStartTime > now() - 7d
| distinct CorrelationId, CallStartTime
| extend hour  = floor(CallStartTime, 1d)
| summarize event_count=count() by day
| sort by day asc
| render columnchart title="Number of calls in last week"
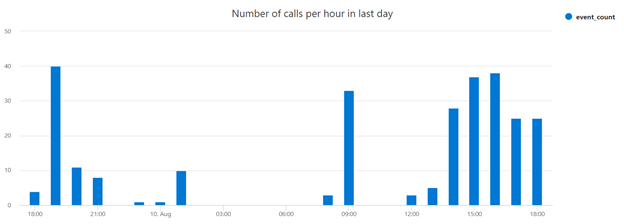
過去一天的每小時通話數
// Histogram of calls per hour in the last day
ACSCallSummary
| where CallStartTime > now() - 1d
| distinct CorrelationId, CallStartTime
| extend hour = floor(CallStartTime, 1h)
| summarize event_count=count() by hour
| sort by hour asc
| render columnchart title="Number of calls per hour in last day"
