使用繪圖工具模組
Azure 地圖服務 Web SDK 提供「繪圖工具模組」。 此模組可讓您使用滑鼠或觸控式螢幕等輸入裝置,輕鬆地在地圖上繪製和編輯圖形。 此模組的核心類別是繪圖管理員。 繪圖管理員提供在地圖上繪製和編輯圖形所需的所有功能。 繪圖管理員可以直接使用,並與自訂工具列 UI 整合。 您也可以使用內建 DrawingToolbar 類別。
在網頁中載入繪圖工具模組
- 建立新的 HTML 檔案,並如往常實作地圖。
- 載入 Azure 地圖服務繪圖工具模組。 您可以使用兩種方法之一進行載入:
使用全域裝載的 Azure 內容傳遞網路版 Azure 地圖服務模組。 在檔案的
<head>元素中新增 JavaScript 和 CSS 的參考:<link rel="stylesheet" href="https://atlas.microsoft.com/sdk/javascript/drawing/1/atlas-drawing.min.css" type="text/css" /> <script src="https://atlas.microsoft.com/sdk/javascript/drawing/1/atlas-drawing.min.js"></script>或者,您也可以使用 azure-maps-drawing-tools npm 套件,在本機載入 Azure 地圖服務 Web SDK 原始程式碼的繪圖工具模組,然後使用您的應用程式加以裝載。 此套件也包含 TypeScript 定義。 使用此命令:
npm install azure-maps-drawing-tools然後,在來源檔案中匯入 JavaScript:
import * as drawing from "azure-maps-drawing-tools";您也需要為各種控制項內嵌 CSS,使其能正確顯示。 如果您使用 JavaScript 搭配程式來組合相依性與封裝程式碼,請參閱搭配程式的文件,以了解其執行方式。 針對 Webpack,其完成方式通常是透過
style-loader和css-loader的組合,以及搭配 style-loader 中提供的文件。若要開始,請安裝 style-loader 和 css-loader:
npm install --save-dev style-loader css-loader在來源檔案內,匯入atlas-drawing.min.css:
import "azure-maps-drawing-tools/dist/atlas-drawing.min.css";然後將載入器新增至 Webpack 組態的模組規則部分:
module.exports = { module: { rules: [ { test: /\.css$/i, use: ["style-loader", "css-loader"] } ] } };若要深入了解,請參閱如何使用 Azure 地圖服務地圖控制項 npm 套件。
直接使用繪圖管理員
在應用程式中載入繪圖工具模組後,您可以使用繪圖管理員來啟用繪圖和編輯功能。 您可以在具現化繪圖管理員時為其指定選項,或使用 drawingManager.setOptions() 函式。
設定繪圖模式
下列程式碼會建立繪圖管理員的執行個體,並設定繪圖模式選項。
//Create an instance of the drawing manager and set drawing mode.
drawingManager = new atlas.drawing.DrawingManager(map,{
    mode: "draw-polygon"
});
下圖是 DrawingManager 繪製模式的範例。 選取地圖的任一處,以開始繪製多邊形。
設定互動類型
繪圖管理員支援三種不同的地圖互動方式,以繪製圖形。
click- 按一下滑鼠或觸控時會新增座標。freehand- 將滑鼠或觸控拖曳至地圖時會新增座標。hybrid- 按一下或拖曳滑鼠或觸控時會新增座標。
下列程式碼會啟用多邊形繪圖模式,並設定繪圖管理員應該遵守 freehand 的繪圖互動類型。
//Create an instance of the drawing manager and set drawing mode.
drawingManager = new atlas.drawing.DrawingManager(map,{
    mode: "draw-polygon",
    interactionType: "freehand"
});
自訂繪圖選項
先前範例已示範如何在具現化繪圖管理員時自訂繪圖選項。 您也可以使用 drawingManager.setOptions() 函式來設定繪圖管理員選項。
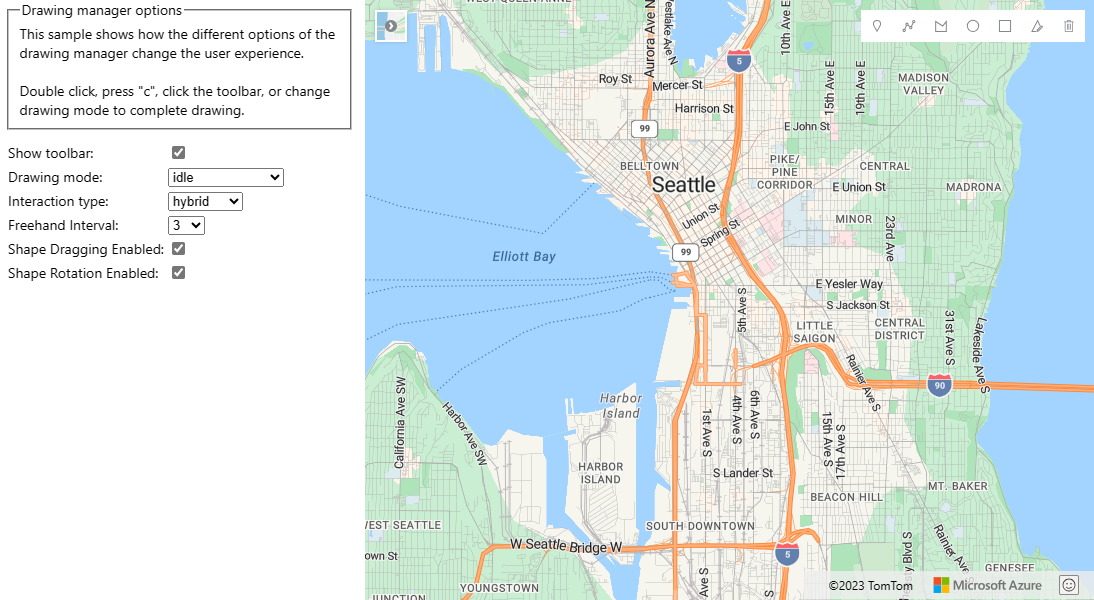
繪圖管理員選項可用來透過 setOptions 函式,測試繪圖管理員所有選項的自訂項目。 如需此範例的原始程式碼,請參閱繪圖管理員選項原始程式碼。
將圖形切換至編輯模式
透過將現有圖形傳遞至繪圖管理員 edit 函式,以程式設計方式將現有圖形切換至編輯模式。 如果圖形是 GeoJSON 功能,請在傳入前先將其與 atls.Shape 類別包裝。
若要以程式設計方式將圖形結束編輯模式,請將繪圖管理員模式設定為 idle。
//If you are starting with a GeoJSON feature, wrap it with the atlas.Shape class.
var feature = {
    "type": "Feature",
    "geometry": {
        "type": "Point",
        "coordinates": [0,0]
        },
    "properties":  {}
};

var shape = new atlas.Shape(feature);

//Pass the shape into the edit function of the drawing manager.
drawingManager.edit(shape);

//Later, to programmatically take shape out of edit mode, set mode to idle.
drawingManager.setOptions({ mode: 'idle' });
注意
當圖形傳遞至 edit 繪圖管理員的函式時,會新增至繪圖管理員所維護的資料來源。 如果圖形先前位於另一個資料來源中,則會從該資料來源中移除此圖形。
若要將圖形新增至繪圖管理員,讓終端使用者可以檢視和編輯,但不想以程式設計方式將其切換至編輯模式,請從繪圖管理員擷取資料來源,並將圖形新增至其中。
//The shape(s) you want to add to the drawing manager so
var shape = new atlas.Shape(feature);

//Retrieve the data source from the drawing manager.
var source = drawingManager.getSource();

//Add your shape.
source.add(shape);

//Alternatively, load in a GeoJSON feed using the sources importDataFromUrl function.
source.importDataFromUrl('yourFeatures.json');
下表列出不同類型的圖形特徵所支援的編輯類型。
| 圖形功能 | 編輯點 | 旋轉 | 刪除圖形 |
|---|---|---|---|
| Point | ✓ | ✓ | |
| LineString | ✓ | ✓ | ✓ |
| Polygon | ✓ | ✓ | ✓ |
| MultiPoint | ✓ | ✓ | |
| MultiLineString | ✓ | ✓ | |
| MultiPolygon | ✓ | ✓ | |
| 圓圈 | ✓ | ✓ | |
| 矩形 | ✓ | ✓ | ✓ |
下一步
了解如何使用繪圖工具模組的更多功能:
深入了解本文使用的類別和方法:
意見反應
即將登場:在 2024 年,我們將逐步淘汰 GitHub 問題作為內容的意見反應機制,並將它取代為新的意見反應系統。 如需詳細資訊,請參閱:https://aka.ms/ContentUserFeedback。
提交並檢視相關的意見反應