備註
檢閱 Application Insights SDK 支援指引 ,以取得我們的傳統 API SDK 支援原則。
謹慎
我們建議新的應用程式或客戶使用 Azure 監視器 OpenTelemetry 發行版本,以便支援 Azure 監視器 Application Insights。 Azure 監視器 OpenTelemetry 發行版本提供與 Application Insights SDK 類似的功能和體驗。 您可以使用適用於 .NET、Node.js 和 Python 的移轉指南,從 Application Insights SDK 移轉,但我們仍在努力新增更多功能以提供回溯相容性。
本文說明如何啟用和設定適用於 .NET 的 Application Insights (ASP.NET、ASP.NET Core 和背景工作服務) 和 Node.js 應用程式。 Application Insights 可以從您的應用程式收集下列遙測:
- 請求事項
- 依賴
- Exceptions
- 效能計數器
- 追蹤 (記錄)
- 心跳
- 自定義事件和計量 (需要手動檢測)
- 頁面檢視 (網頁需要 JavaScript SDK)
- 可用性測試 (需要手動設定可用性測試)
支援的案例
| 支援 | ASP.NET | ASP.NET Core | 背景工作服務 |
|---|---|---|---|
| 作業系統 | 窗戶 | Windows、Linux 或 macOS | Windows、Linux 或 macOS |
| 主機託管方式 | 內含式 (IIS 或 IIS Express) | 內部處理序或跨處理序 | 主控台或背景服務 (以進程形式執行,通常透過 dotnet CLI 或作為 Windows 服務/Linux 精靈) |
| 部署方法 | Web Deploy、MSI 或手動檔案複製 | 框架依賴型或自包含型 | 框架依賴型或自包含型 |
| 網頁伺服器 | Internet Information Services (IIS) | Internet Information Server (IIS) 或 Kestrel | 不適用 (無 Web 伺服器;專為非 HTTP 工作負載 (例如傳訊、背景工作和主控台應用程式) 所設計) |
| 主機平台 | Azure App Service (Windows)、Azure 虛擬機或內部部署伺服器 | Azure App Service 的 Web Apps 功能、Azure 虛擬機、Docker 和 Azure Kubernetes Service (AKS) | Azure 虛擬機器、Azure Kubernetes Service (AKS)、容器或任何支援 .NET Core 的環境 |
| .NET 版本 | .NET Framework 4.6.1 和更新版本 | 所有未處於預覽狀態的正式支援的 .NET 版本 | 所有未處於預覽狀態的正式支援的 .NET 版本 |
| IDE | Visual Studio | Visual Studio、Visual Studio Code 或命令行 | Visual Studio、Visual Studio Code 或命令行 |
工作者服務 SDK 本身不會進行任何遙測收集。 相反地,它會引進其他知名的 Application Insights 自動收集器,例如 DependencyCollector、 PerfCounterCollector 和 ApplicationInsightsLoggingProvider。 此 SDK 會公開 IServiceCollection 的擴充方法,以啟用和設定遙測收集。
備註
背景工作者服務是長時間執行的背景應用程式,可在 HTTP 要求/回應管線之外執行工作。 適用於背景工作角色服務的 Application Insights SDK 可用於新引進的 .NET Core 背景工作服務、ASP.NET Core 中的背景工作,以及 .NET Core 和 .NET Framework 等主控台應用程式。
新增 Application Insights
先決條件
- Azure 訂用帳戶。 如果您還沒有帳戶,請建立 免費的 Azure 帳戶。
- 以工作區為基礎的 Application Insights 資源。
- 一個正常運行的應用程序。 如果您還沒有,請參閱 建立基本 Web 應用程式。
- 最新版本的Visual Studio具有下列工作負載:
- ASP.NET 和網頁程式開發
- Azure 開發
建立基本 Web 應用程式
如果您還沒有正常運作的 Web 應用程式,可以使用下列指導來建立一個。
ASP.NET
- 開啟 Visual Studio。
- 選取 [建立新專案]。
- 選擇 ASP.NET Web 應用程式 (.NET Framework) 搭配 C# ,然後選取 [ 下一步]。
- 輸入 專案名稱,然後選取 [建立]。
- 選擇 MVC,然後選取 建立。
ASP.NET Core
- 開啟 Visual Studio。
- 選取 [建立新專案]。
- 選擇 ASP.NET Core Web 應用程式 (Razor Pages) 搭配 C# ,然後選取 [ 下一步]。
- 輸入 專案名稱,然後選取 [建立]。
- 選擇 架構 (LTS 或 STS),然後選取 [建立]。
自動新增 Application Insights(Visual Studio)
本節將引導您自動將 Application Insights 新增至以範本為基礎的 Web 應用程式。
ASP.NET
備註
Visual Studio 2019 發生已知問題:針對 .NET Framework 型應用程式,將檢測密鑰或連接字串儲存至用戶機密的功能無法正常運作。 金鑰最終必須硬式編碼到 Applicationinsights.config 檔案中,才能解決此錯誤。
從 Visual Studio 的 ASP.NET Web 應用程式專案內:
選取 [專案] > [新增 Application Insights 遙測] > [Application Insights Sdk (本機)] > [下一步] > [完成] > [關閉]。
開啟 ApplicationInsights.config 檔案。
在結尾
</ApplicationInsights>標記之前,請新增一行,其中包含您Application Insights 資源的連接字串。 在新建立的 Application Insights 資源概觀窗格上尋找連接字串。<ConnectionString>Copy connection string from Application Insights Resource Overview</ConnectionString>選取 [專案] > [管理 NuGet 套件] > [更新]。 然後將每個
Microsoft.ApplicationInsightsNuGet 套件更新為最新穩定版本。透過選取 [IIS Express] 來執行應用程式。 隨即開啟基本 ASP.NET 應用程式。 當您瀏覽網站上的頁面時,遙測會傳送至 Application Insights。
ASP.NET Core
備註
如果您想要針對 ASP.NET 應用程式使用獨立 ILogger 提供者,請使用 Microsoft.Extensions.Logging.ApplicationInsight。
這很重要
針對 Visual Studio for macOS,請使用手動指引。 只有 Windows 版本的 Visual Studio 支援此程序。
從 Visual Studio 的 ASP.NET Web 應用程式專案內:
移至 [專案]>[新增 Application Insights 遙測]。
選取 [Azure Application Insights]>[下一步]。
選擇您的訂閱和 Application Insights 實例。 或者,您可以使用 [建立新的] 來建立新的執行個體。 選取 下一步。
新增或確認 Application Insights 連接字串。 這應該會根據上一個步驟中的選取項目預先填入。 選取 完成。
將 Application Insights 新增至專案之後,請檢查以確認您正在使用最新穩定版本的 SDK。 移至 [專案] > [管理 NuGet 套件] > [Microsoft.ApplicationInsights.AspNetCore]。 如果您有需要,請選取 [更新]。

手動新增應用程式洞察 (不使用 Visual Studio)
本節會引導您手動將 Application Insights 新增至以範本為基礎的 Web 應用程式。
ASP.NET
將下列 NuGet 套件與其相依性新增至您的專案:
在某些情況下,系統會自動為您建立 ApplicationInsights.config 檔案。 如果檔案已存在,請跳至步驟 4。
如果遺失,請自行建立。 在 ASP.NET 應用程式的根目錄中,建立名為 ApplicationInsights.config 的新檔案。
將下列 XML 組態複製到新建立的檔案中:
展開以檢視設定
<?xml version="1.0" encoding="utf-8"?>
<ApplicationInsights xmlns="http://schemas.microsoft.com/ApplicationInsights/2013/Settings">
  <TelemetryInitializers>
    <Add Type="Microsoft.ApplicationInsights.DependencyCollector.HttpDependenciesParsingTelemetryInitializer, Microsoft.AI.DependencyCollector" />
    <Add Type="Microsoft.ApplicationInsights.WindowsServer.AzureRoleEnvironmentTelemetryInitializer, Microsoft.AI.WindowsServer" />
    <Add Type="Microsoft.ApplicationInsights.WindowsServer.BuildInfoConfigComponentVersionTelemetryInitializer, Microsoft.AI.WindowsServer" />
    <Add Type="Microsoft.ApplicationInsights.Web.WebTestTelemetryInitializer, Microsoft.AI.Web" />
    <Add Type="Microsoft.ApplicationInsights.Web.SyntheticUserAgentTelemetryInitializer, Microsoft.AI.Web">
      <!-- Extended list of bots:
            search|spider|crawl|Bot|Monitor|BrowserMob|BingPreview|PagePeeker|WebThumb|URL2PNG|ZooShot|GomezA|Google SketchUp|Read Later|KTXN|KHTE|Keynote|Pingdom|AlwaysOn|zao|borg|oegp|silk|Xenu|zeal|NING|htdig|lycos|slurp|teoma|voila|yahoo|Sogou|CiBra|Nutch|Java|JNLP|Daumoa|Genieo|ichiro|larbin|pompos|Scrapy|snappy|speedy|vortex|favicon|indexer|Riddler|scooter|scraper|scrubby|WhatWeb|WinHTTP|voyager|archiver|Icarus6j|mogimogi|Netvibes|altavista|charlotte|findlinks|Retreiver|TLSProber|WordPress|wsr-agent|http client|Python-urllib|AppEngine-Google|semanticdiscovery|facebookexternalhit|web/snippet|Google-HTTP-Java-Client-->
      <Filters>search|spider|crawl|Bot|Monitor|AlwaysOn</Filters>
    </Add>
    <Add Type="Microsoft.ApplicationInsights.Web.ClientIpHeaderTelemetryInitializer, Microsoft.AI.Web" />
    <Add Type="Microsoft.ApplicationInsights.Web.AzureAppServiceRoleNameFromHostNameHeaderInitializer, Microsoft.AI.Web" />
    <Add Type="Microsoft.ApplicationInsights.Web.OperationNameTelemetryInitializer, Microsoft.AI.Web" />
    <Add Type="Microsoft.ApplicationInsights.Web.OperationCorrelationTelemetryInitializer, Microsoft.AI.Web" />
    <Add Type="Microsoft.ApplicationInsights.Web.UserTelemetryInitializer, Microsoft.AI.Web" />
    <Add Type="Microsoft.ApplicationInsights.Web.AuthenticatedUserIdTelemetryInitializer, Microsoft.AI.Web" />
    <Add Type="Microsoft.ApplicationInsights.Web.AccountIdTelemetryInitializer, Microsoft.AI.Web" />
    <Add Type="Microsoft.ApplicationInsights.Web.SessionTelemetryInitializer, Microsoft.AI.Web" />
  </TelemetryInitializers>
  <TelemetryModules>
    <Add Type="Microsoft.ApplicationInsights.DependencyCollector.DependencyTrackingTelemetryModule, Microsoft.AI.DependencyCollector">
      <ExcludeComponentCorrelationHttpHeadersOnDomains>
        <!--
        Requests to the following hostnames will not be modified by adding correlation headers.
        Add entries here to exclude additional hostnames.
        NOTE: this configuration will be lost upon NuGet upgrade.
        -->
        <Add>core.windows.net</Add>
        <Add>core.chinacloudapi.cn</Add>
        <Add>core.cloudapi.de</Add>
        <Add>core.usgovcloudapi.net</Add>
      </ExcludeComponentCorrelationHttpHeadersOnDomains>
      <IncludeDiagnosticSourceActivities>
        <Add>Microsoft.Azure.EventHubs</Add>
        <Add>Azure.Messaging.ServiceBus</Add>
      </IncludeDiagnosticSourceActivities>
    </Add>
    <Add Type="Microsoft.ApplicationInsights.Extensibility.PerfCounterCollector.PerformanceCollectorModule, Microsoft.AI.PerfCounterCollector">
      <!--
      Use the following syntax here to collect additional performance counters:

      <Counters>
        <Add PerformanceCounter="\Process(??APP_WIN32_PROC??)\Handle Count" ReportAs="Process handle count" />
        ...
      </Counters>

      PerformanceCounter must be either \CategoryName(InstanceName)\CounterName or \CategoryName\CounterName

      NOTE: performance counters configuration will be lost upon NuGet upgrade.

      The following placeholders are supported as InstanceName:
        ??APP_WIN32_PROC?? - instance name of the application process for Win32 counters.
        ??APP_W3SVC_PROC?? - instance name of the application IIS worker process for IIS/ASP.NET counters.
        ??APP_CLR_PROC?? - instance name of the application CLR process for .NET counters.
      -->
    </Add>
    <Add Type="Microsoft.ApplicationInsights.Extensibility.PerfCounterCollector.QuickPulse.QuickPulseTelemetryModule, Microsoft.AI.PerfCounterCollector" />
    <Add Type="Microsoft.ApplicationInsights.WindowsServer.AppServicesHeartbeatTelemetryModule, Microsoft.AI.WindowsServer" />
    <Add Type="Microsoft.ApplicationInsights.WindowsServer.AzureInstanceMetadataTelemetryModule, Microsoft.AI.WindowsServer">
      <!--
      Remove individual fields collected here by adding them to the ApplicationInsighs.HeartbeatProvider
      with the following syntax:

      <Add Type="Microsoft.ApplicationInsights.Extensibility.Implementation.Tracing.DiagnosticsTelemetryModule, Microsoft.ApplicationInsights">
        <ExcludedHeartbeatProperties>
          <Add>osType</Add>
          <Add>location</Add>
          <Add>name</Add>
          <Add>offer</Add>
          <Add>platformFaultDomain</Add>
          <Add>platformUpdateDomain</Add>
          <Add>publisher</Add>
          <Add>sku</Add>
          <Add>version</Add>
          <Add>vmId</Add>
          <Add>vmSize</Add>
          <Add>subscriptionId</Add>
          <Add>resourceGroupName</Add>
          <Add>placementGroupId</Add>
          <Add>tags</Add>
          <Add>vmScaleSetName</Add>
        </ExcludedHeartbeatProperties>
      </Add>

      NOTE: exclusions will be lost upon upgrade.
      -->
    </Add>
    <Add Type="Microsoft.ApplicationInsights.WindowsServer.DeveloperModeWithDebuggerAttachedTelemetryModule, Microsoft.AI.WindowsServer" />
    <Add Type="Microsoft.ApplicationInsights.WindowsServer.UnhandledExceptionTelemetryModule, Microsoft.AI.WindowsServer" />
    <Add Type="Microsoft.ApplicationInsights.WindowsServer.UnobservedExceptionTelemetryModule, Microsoft.AI.WindowsServer">
      <!--</Add>
    <Add Type="Microsoft.ApplicationInsights.WindowsServer.FirstChanceExceptionStatisticsTelemetryModule, Microsoft.AI.WindowsServer">-->
    </Add>
    <Add Type="Microsoft.ApplicationInsights.Web.RequestTrackingTelemetryModule, Microsoft.AI.Web">
      <Handlers>
        <!--
        Add entries here to filter out additional handlers:

        NOTE: handler configuration will be lost upon NuGet upgrade.
        -->
        <Add>Microsoft.VisualStudio.Web.PageInspector.Runtime.Tracing.RequestDataHttpHandler</Add>
        <Add>System.Web.StaticFileHandler</Add>
        <Add>System.Web.Handlers.AssemblyResourceLoader</Add>
        <Add>System.Web.Optimization.BundleHandler</Add>
        <Add>System.Web.Script.Services.ScriptHandlerFactory</Add>
        <Add>System.Web.Handlers.TraceHandler</Add>
        <Add>System.Web.Services.Discovery.DiscoveryRequestHandler</Add>
        <Add>System.Web.HttpDebugHandler</Add>
      </Handlers>
    </Add>
    <Add Type="Microsoft.ApplicationInsights.Web.ExceptionTrackingTelemetryModule, Microsoft.AI.Web" />
    <Add Type="Microsoft.ApplicationInsights.Web.AspNetDiagnosticTelemetryModule, Microsoft.AI.Web" />
  </TelemetryModules>
  <ApplicationIdProvider Type="Microsoft.ApplicationInsights.Extensibility.Implementation.ApplicationId.ApplicationInsightsApplicationIdProvider, Microsoft.ApplicationInsights" />
  <TelemetrySinks>
    <Add Name="default">
      <TelemetryProcessors>
        <Add Type="Microsoft.ApplicationInsights.Extensibility.PerfCounterCollector.QuickPulse.QuickPulseTelemetryProcessor, Microsoft.AI.PerfCounterCollector" />
        <Add Type="Microsoft.ApplicationInsights.Extensibility.AutocollectedMetricsExtractor, Microsoft.ApplicationInsights" />
        <Add Type="Microsoft.ApplicationInsights.WindowsServer.TelemetryChannel.AdaptiveSamplingTelemetryProcessor, Microsoft.AI.ServerTelemetryChannel">
          <MaxTelemetryItemsPerSecond>5</MaxTelemetryItemsPerSecond>
          <ExcludedTypes>Event</ExcludedTypes>
        </Add>
        <Add Type="Microsoft.ApplicationInsights.WindowsServer.TelemetryChannel.AdaptiveSamplingTelemetryProcessor, Microsoft.AI.ServerTelemetryChannel">
          <MaxTelemetryItemsPerSecond>5</MaxTelemetryItemsPerSecond>
          <IncludedTypes>Event</IncludedTypes>
        </Add>
        <!--
          Adjust the include and exclude examples to specify the desired semicolon-delimited types. (Dependency, Event, Exception, PageView, Request, Trace)
        -->
      </TelemetryProcessors>
      <TelemetryChannel Type="Microsoft.ApplicationInsights.WindowsServer.TelemetryChannel.ServerTelemetryChannel, Microsoft.AI.ServerTelemetryChannel" />
    </Add>
  </TelemetrySinks>
  <!--
    Learn more about Application Insights configuration with ApplicationInsights.config here:
    http://go.microsoft.com/fwlink/?LinkID=513840
  -->
  <ConnectionString>Copy the connection string from your Application Insights resource</ConnectionString>
</ApplicationInsights>
新增 連接字串,其可透過兩種方式來完成:
(建議)在組態中設定 連接字串。
在
</ApplicationInsights>的結尾 標記之前,新增您的 Application Insights 資源的連線字串。 您可以在新建立 Application Insights 資源的概觀窗格上找到連接字串。<ConnectionString>Copy the connection string from your Application Insights resource</ConnectionString>在程式代碼中設定 連接字串。
在您的program.cs類別中提供連接字串。
var configuration = new TelemetryConfiguration
{
    ConnectionString = "Copy the connection string from your Application Insights resource"
};
在與 "ApplicationInsights.config" 檔案相同層級的專案中,使用名為 "AiHandleErrorAttribute.cs" 的新 C# 檔案建立名為 "ErrorHandler" 的資料夾。 檔案內容看起來像這樣:
using System;
using System.Web.Mvc;
using Microsoft.ApplicationInsights;

namespace WebApplication10.ErrorHandler //namespace will vary based on your project name
{
    [AttributeUsage(AttributeTargets.Class | AttributeTargets.Method, Inherited = true, AllowMultiple = true)]
    public class AiHandleErrorAttribute : HandleErrorAttribute
    {
        public override void OnException(ExceptionContext filterContext)
        {
            if (filterContext != null && filterContext.HttpContext != null && filterContext.Exception != null)
            {
                //If customError is Off, then AI HTTPModule will report the exception
                if (filterContext.HttpContext.IsCustomErrorEnabled)
                {
                    var ai = new TelemetryClient();
                    ai.TrackException(filterContext.Exception);
                }
            }
            base.OnException(filterContext);
        }
    }
}
在 [App_Start] 資料夾中,開啟 [FilterConfig.cs] 檔案並加以變更以符合範例:
using System.Web;
using System.Web.Mvc;

namespace WebApplication10 //Namespace will vary based on project name
{
    public class FilterConfig
    {
        public static void RegisterGlobalFilters(GlobalFilterCollection filters)
        {
            filters.Add(new ErrorHandler.AiHandleErrorAttribute());
        }
    }
}
如果 "Web.config" 已更新,請略過此步驟。 否則,請將檔案更新為下列內容:
展開以檢視設定
<?xml version="1.0" encoding="utf-8"?> <!-- For more information on how to configure your ASP.NET application, please visit https://go.microsoft.com/fwlink/?LinkId=301880 --> <configuration> <appSettings> <add key="webpages:Version" value="3.0.0.0" /> <add key="webpages:Enabled" value="false" /> <add key="ClientValidationEnabled" value="true" /> <add key="UnobtrusiveJavaScriptEnabled" value="true" /> </appSettings> <system.web> <compilation debug="true" targetFramework="4.7.2" /> <httpRuntime targetFramework="4.7.2" /> <!-- Code added for Application Insights start --> <httpModules> <add name="TelemetryCorrelationHttpModule" type="Microsoft.AspNet.TelemetryCorrelation.TelemetryCorrelationHttpModule, Microsoft.AspNet.TelemetryCorrelation" /> <add name="ApplicationInsightsWebTracking" type="Microsoft.ApplicationInsights.Web.ApplicationInsightsHttpModule, Microsoft.AI.Web" /> </httpModules> <!-- Code added for Application Insights end --> </system.web> <runtime> <assemblyBinding xmlns="urn:schemas-microsoft-com:asm.v1"> <dependentAssembly> <assemblyIdentity name="Antlr3.Runtime" publicKeyToken="eb42632606e9261f" /> <bindingRedirect oldVersion="0.0.0.0-3.5.0.2" newVersion="3.5.0.2" /> </dependentAssembly> <dependentAssembly> <assemblyIdentity name="Newtonsoft.Json" publicKeyToken="30ad4fe6b2a6aeed" /> <bindingRedirect oldVersion="0.0.0.0-12.0.0.0" newVersion="12.0.0.0" /> </dependentAssembly> <dependentAssembly> <assemblyIdentity name="System.Web.Optimization" publicKeyToken="31bf3856ad364e35" /> <bindingRedirect oldVersion="1.0.0.0-1.1.0.0" newVersion="1.1.0.0" /> </dependentAssembly> <dependentAssembly> <assemblyIdentity name="WebGrease" publicKeyToken="31bf3856ad364e35" /> <bindingRedirect oldVersion="0.0.0.0-1.6.5135.21930" newVersion="1.6.5135.21930" /> </dependentAssembly> <dependentAssembly> <assemblyIdentity name="System.Web.Helpers" publicKeyToken="31bf3856ad364e35" /> <bindingRedirect oldVersion="1.0.0.0-3.0.0.0" newVersion="3.0.0.0" /> </dependentAssembly> <dependentAssembly> <assemblyIdentity name="System.Web.WebPages" publicKeyToken="31bf3856ad364e35" /> <bindingRedirect oldVersion="1.0.0.0-3.0.0.0" newVersion="3.0.0.0" /> </dependentAssembly> <dependentAssembly> <assemblyIdentity name="System.Web.Mvc" publicKeyToken="31bf3856ad364e35" /> <bindingRedirect oldVersion="1.0.0.0-5.2.7.0" newVersion="5.2.7.0" /> </dependentAssembly> <!-- Code added for Application Insights start --> <dependentAssembly> <assemblyIdentity name="System.Memory" publicKeyToken="cc7b13ffcd2ddd51" culture="neutral" /> <bindingRedirect oldVersion="0.0.0.0-4.0.1.1" newVersion="4.0.1.1" /> </dependentAssembly> <!-- Code added for Application Insights end --> </assemblyBinding> </runtime> <system.codedom> <compilers> <compiler language="c#;cs;csharp" extension=".cs" type="Microsoft.CodeDom.Providers.DotNetCompilerPlatform.CSharpCodeProvider, Microsoft.CodeDom.Providers.DotNetCompilerPlatform, Version=2.0.1.0, Culture=neutral, PublicKeyToken=31bf3856ad364e35" warningLevel="4" compilerOptions="/langversion:default /nowarn:1659;1699;1701" /> <compiler language="vb;vbs;visualbasic;vbscript" extension=".vb" type="Microsoft.CodeDom.Providers.DotNetCompilerPlatform.VBCodeProvider, Microsoft.CodeDom.Providers.DotNetCompilerPlatform, Version=2.0.1.0, Culture=neutral, PublicKeyToken=31bf3856ad364e35" warningLevel="4" compilerOptions="/langversion:default /nowarn:41008 /define:_MYTYPE=\"Web\" /optionInfer+" /> </compilers> </system.codedom> <system.webServer> <validation validateIntegratedModeConfiguration="false" /> <!-- Code added for Application Insights start --> <modules> <remove name="TelemetryCorrelationHttpModule" /> <add name="TelemetryCorrelationHttpModule" type="Microsoft.AspNet.TelemetryCorrelation.TelemetryCorrelationHttpModule, Microsoft.AspNet.TelemetryCorrelation" preCondition="managedHandler" /> <remove name="ApplicationInsightsWebTracking" /> <add name="ApplicationInsightsWebTracking" type="Microsoft.ApplicationInsights.Web.ApplicationInsightsHttpModule, Microsoft.AI.Web" preCondition="managedHandler" /> </modules> <!-- Code added for Application Insights end --> </system.webServer> </configuration>
此時,您已成功設定伺服器端應用程式監視。 如果您執行 Web 應用程式,將看到遙測開始出現在 Application Insights 中。
ASP.NET Core
安裝適用於 ASP.NET Core 的 Application Insights SDK NuGet 套件。
建議您一律使用最新穩定版本。 在開放原始碼 GitHub 存放庫上尋找 SDK 的完整版本資訊。
下列程式碼範例顯示要新增至專案 .csproj 檔案的變更:
<ItemGroup>
    <PackageReference Include="Microsoft.ApplicationInsights.AspNetCore" Version="2.21.0" />
</ItemGroup>
將 新增
AddApplicationInsightsTelemetry()至您的 program.cs 類別。在
builder.Services.AddApplicationInsightsTelemetry();方法後面新增WebApplication.CreateBuilder(),如下列範例所示:// This method gets called by the runtime. Use this method to add services to the container. var builder = WebApplication.CreateBuilder(args); // The following line enables Application Insights telemetry collection. builder.Services.AddApplicationInsightsTelemetry(); // This code adds other services for your application. builder.Services.AddMvc(); var app = builder.Build();新增 連接字串,其可透過三種方式來完成:
(建議)在組態中設定 連接字串。
在 appsettings.json 中設定 連接字串,並確定組態檔會在發佈期間複製到應用程式根資料夾。
{
    "Logging": {
        "LogLevel": {
            "Default": "Information",
            "Microsoft.AspNetCore": "Warning"
        }
    },
    "AllowedHosts": "*",
    "ApplicationInsights": {
        "ConnectionString": "<YOUR-CONNECTION-STRING>"
    }
}
將連接字串設定在環境變數
APPLICATIONINSIGHTS_CONNECTION_STRING或 JSON 組態檔ApplicationInsights:ConnectionString中。例如:
SET ApplicationInsights:ConnectionString = <Copy connection string from Application Insights Resource Overview>SET APPLICATIONINSIGHTS_CONNECTION_STRING = <Copy connection string from Application Insights Resource Overview>- 一般而言,
APPLICATIONINSIGHTS_CONNECTION_STRING會用於 Web Apps。 也可用於支援此 SDK 的所有地方。
備註
在程式碼中指定的連接字串會優先於環境變數
APPLICATIONINSIGHTS_CONNECTION_STRING,而該變數優先於其他選項。在程式代碼中設定 連接字串。
在
ApplicationInsightsServiceOptions類別中,將連接字串做為AddApplicationInsightsTelemetry引數的一部分提供給 。
使用者密碼和其他設定來源
如果您想將連接字串儲存在 ASP.NET Core 的使用者秘密中,或從其他設定提供者擷取它,可以使用帶有 Microsoft.Extensions.Configuration.IConfiguration 參數的多載方法。 範例參數為 services.AddApplicationInsightsTelemetry(Configuration);。
在 Microsoft.ApplicationInsights.AspNetCore2.15.0 版和更新版本中,呼叫 services.AddApplicationInsightsTelemetry() 會自動從應用程式的 Microsoft.Extensions.Configuration.IConfiguration 中讀取連接字串。 不需要明確提供 IConfiguration。
如果 IConfiguration 從多個提供者載入設定,則 services.AddApplicationInsightsTelemetry 會優先採用 appsettings.json 的設定,而不論提供者新增的順序為何。 使用services.AddApplicationInsightsTelemetry(IConfiguration)方法來讀取IConfiguration的設定,而不會給予appsettings.json特殊優待。
背景工作服務
本節內容
- 使用適用於背景工作服務的 Application Insights SDK
- .NET Core 工作類型服務應用
- ASP.NET Core 背景工作與託管服務
- .NET Core/.NET Framework 主控台應用程式
使用適用於背景工作服務的 Application Insights SDK
將 Microsoft.ApplicationInsights.WorkerService 套件安裝至應用程式。
下列程式碼片段顯示必須新增至專案檔案
.csproj的變更:<ItemGroup> <PackageReference Include="Microsoft.ApplicationInsights.WorkerService" Version="2.22.0" /> </ItemGroup>在環境變數或
APPLICATIONINSIGHTS_CONNECTION_STRING組態 (appsettings.json) 中設定連接字串。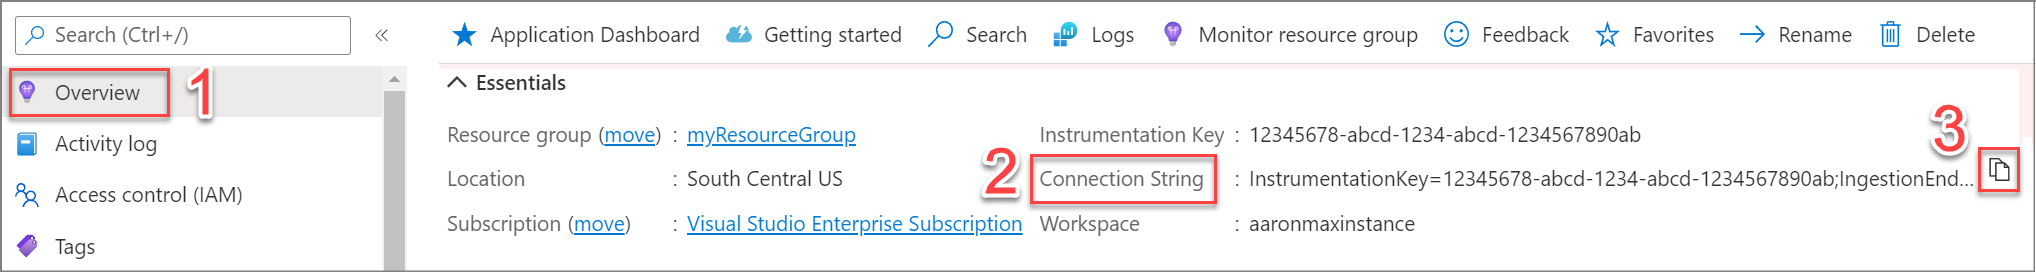
從相依性注入(DI)容器中,透過呼叫
ILogger或使用建構函式注入,擷取TelemetryClient實例或serviceProvider.GetRequiredService<TelemetryClient>();實例。 此步驟會觸發TelemetryConfiguration的設定及自動收集模組的配置。

下列各節說明每種應用程式類型的特定指示。
.NET Core 工作者服務應用程式
完整的範例已在 NuGet 網站上提供。
使用 Visual Studio 新專案範本或命令列
dotnet new worker來建立新的 Worker Service 專案。將 Microsoft.ApplicationInsights.WorkerService 套件新增至應用程式。
將
services.AddApplicationInsightsTelemetryWorkerService();新增至CreateHostBuilder()類別中的Program.cs方法,如下列範例所示:public static IHostBuilder CreateHostBuilder(string[] args) => Host.CreateDefaultBuilder(args) .ConfigureServices((hostContext, services) => { services.AddHostedService<Worker>(); services.AddApplicationInsightsTelemetryWorkerService(); });根據下列範例修改您的
Worker.cs。using Microsoft.ApplicationInsights; using Microsoft.ApplicationInsights.DataContracts; public class Worker : BackgroundService { private readonly ILogger<Worker> _logger; private TelemetryClient _telemetryClient; private static HttpClient _httpClient = new HttpClient(); public Worker(ILogger<Worker> logger, TelemetryClient tc) { _logger = logger; _telemetryClient = tc; } protected override async Task ExecuteAsync(CancellationToken stoppingToken) { while (!stoppingToken.IsCancellationRequested) { _logger.LogInformation("Worker running at: {time}", DateTimeOffset.Now); using (_telemetryClient.StartOperation<RequestTelemetry>("operation")) { _logger.LogWarning("A sample warning message. By default, logs with severity Warning or higher is captured by Application Insights"); _logger.LogInformation("Calling bing.com"); var res = await _httpClient.GetAsync("https://bing.com"); _logger.LogInformation("Calling bing completed with status:" + res.StatusCode); _telemetryClient.TrackEvent("Bing call event completed"); } await Task.Delay(1000, stoppingToken); } } }設定連接字串。
備註
建議您在組態中指定連接字串。 下列程式碼範例示範如何在 中
appsettings.json指定連接字串。 請確定appsettings.json在發佈期間複製到應用程式根資料夾。{ "ApplicationInsights": { "ConnectionString" : "<YOUR-CONNECTION-STRING>" }, "Logging": { "LogLevel": { "Default": "Warning" } } }
或者,在環境變數中 APPLICATIONINSIGHTS_CONNECTION_STRING 指定連接字串。
一般而言,APPLICATIONINSIGHTS_CONNECTION_STRING 會針對部署至 Web 應用程式作為 Web 工作的應用程式指定連接字串。
備註
程式碼中指定的連接字串優先於環境變數 ,環境變數 APPLICATIONINSIGHTS_CONNECTION_STRING優先於其他選項。
ASP.NET Core 背景工作與託管服務
本文檔 說明如何在 ASP.NET Core應用程式中建立背景任務。
完整的範例在此 GitHub 頁面上分享。
將 Microsoft.ApplicationInsights.WorkerService 套件安裝至應用程式。
將
services.AddApplicationInsightsTelemetryWorkerService();新增至ConfigureServices()方法,如下列範例所示:public static async Task Main(string[] args) { var host = new HostBuilder() .ConfigureAppConfiguration((hostContext, config) => { config.AddJsonFile("appsettings.json", optional: true); }) .ConfigureServices((hostContext, services) => { services.AddLogging(); services.AddHostedService<TimedHostedService>(); // connection string is read automatically from appsettings.json services.AddApplicationInsightsTelemetryWorkerService(); }) .UseConsoleLifetime() .Build(); using (host) { // Start the host await host.StartAsync(); // Wait for the host to shutdown await host.WaitForShutdownAsync(); } }以下是背景工作邏輯所在
TimedHostedService的程式碼:using Microsoft.ApplicationInsights; using Microsoft.ApplicationInsights.DataContracts; public class TimedHostedService : IHostedService, IDisposable { private readonly ILogger _logger; private Timer _timer; private TelemetryClient _telemetryClient; private static HttpClient httpClient = new HttpClient(); public TimedHostedService(ILogger<TimedHostedService> logger, TelemetryClient tc) { _logger = logger; this._telemetryClient = tc; } public Task StartAsync(CancellationToken cancellationToken) { _logger.LogInformation("Timed Background Service is starting."); _timer = new Timer(DoWork, null, TimeSpan.Zero, TimeSpan.FromSeconds(1)); return Task.CompletedTask; } private void DoWork(object state) { _logger.LogInformation("Worker running at: {time}", DateTimeOffset.Now); using (_telemetryClient.StartOperation<RequestTelemetry>("operation")) { _logger.LogWarning("A sample warning message. By default, logs with severity Warning or higher is captured by Application Insights"); _logger.LogInformation("Calling bing.com"); var res = httpClient.GetAsync("https://bing.com").GetAwaiter().GetResult(); _logger.LogInformation("Calling bing completed with status:" + res.StatusCode); _telemetryClient.TrackEvent("Bing call event completed"); } } }
.NET Core/.NET Framework 主控台應用程式
如本文開頭所述,新的套件可用於從一般主控台應用程式啟用 Application Insights 遙測。 此套件以netstandard2.0為目標,因此可用於.NET Core或更新版本,以及.NET Framework或更新版本中的主控台應用程式。
完整的範例在此 GitHub 頁面上分享。
將 Microsoft.ApplicationInsights.WorkerService 套件安裝至應用程式。
修改 Program.cs ,如下列範例所示:
    using Microsoft.ApplicationInsights;
    using Microsoft.ApplicationInsights.DataContracts;
    using Microsoft.ApplicationInsights.WorkerService;
    using Microsoft.Extensions.DependencyInjection;
    using Microsoft.Extensions.Logging;
    using System;
    using System.Net.Http;
    using System.Threading.Tasks;

    namespace WorkerSDKOnConsole
    {
        class Program
        {
            static async Task Main(string[] args)
            {
                // Create the DI container.
                IServiceCollection services = new ServiceCollection();

                // Being a regular console app, there is no appsettings.json or configuration providers enabled by default.
                // Hence connection string and any changes to default logging level must be specified here.
                services.AddLogging(loggingBuilder => loggingBuilder.AddFilter<Microsoft.Extensions.Logging.ApplicationInsights.ApplicationInsightsLoggerProvider>("Category", LogLevel.Information));
                services.AddApplicationInsightsTelemetryWorkerService((ApplicationInsightsServiceOptions options) => options.ConnectionString = "<YOUR-CONNECTION-STRING>");

                // To pass a connection string
                // - aiserviceoptions must be created
                // - set connectionstring on it
                // - pass it to AddApplicationInsightsTelemetryWorkerService()

                // Build ServiceProvider.
                IServiceProvider serviceProvider = services.BuildServiceProvider();

                // Obtain logger instance from DI.
                ILogger<Program> logger = serviceProvider.GetRequiredService<ILogger<Program>>();

                // Obtain TelemetryClient instance from DI, for additional manual tracking or to flush.
                var telemetryClient = serviceProvider.GetRequiredService<TelemetryClient>();

                var httpClient = new HttpClient();

                while (true) // This app runs indefinitely. Replace with actual application termination logic.
                {
                    logger.LogInformation("Worker running at: {time}", DateTimeOffset.Now);

                    // Replace with a name which makes sense for this operation.
                    using (telemetryClient.StartOperation<RequestTelemetry>("operation"))
                    {
                        logger.LogWarning("A sample warning message. By default, logs with severity Warning or higher is captured by Application Insights");
                        logger.LogInformation("Calling bing.com");
                        var res = await httpClient.GetAsync("https://bing.com");
                        logger.LogInformation("Calling bing completed with status:" + res.StatusCode);
                        telemetryClient.TrackEvent("Bing call event completed");
                    }

                    await Task.Delay(1000);
                }

                // Explicitly call Flush() followed by sleep is required in console apps.
                // This is to ensure that even if application terminates, telemetry is sent to the back-end.
                telemetryClient.Flush();
                Task.Delay(5000).Wait();
            }
        }
    }
此主控台應用程式也使用相同的預設值 TelemetryConfiguration。 您可以以與先前各節中的範例相同的方式自訂它。
確認 Application Insights 會接收遙測
ASP.NET 和 ASP.NET 核心
執行應用程式並對其提出要求。 遙測現在應該會流向 Application Insights。 Application Insights SDK 會自動收集應用程式的傳入網頁請求,以及以下的遙測資料。
背景工作服務
執行您的應用程式。 上述所有範例中的工作角色每秒都會對 bing.com 進行一次 HTTP 呼叫,而且也會使用 ILogger發出少量記錄。 這幾行會包裝在 StartOperation 的 TelemetryClient 呼叫內部,其用於建立作業。 在此範例中, RequestTelemetry 名為「操作」。
Application Insights 會收集這些 ILogger 日誌,預設情況下,嚴重性為警告或更高,並且包括依賴性。 這些紀錄與父子系關聯性相互關聯的 RequestTelemetry。 關聯性也跨流程/網路邊界運作。 例如,如果呼叫是對另一個受監視元件進行,則它也會與此父元件相互關聯。
此 RequestTelemetry 自訂作業可以視為相當於典型 Web 應用程式中的傳入 Web 請求。 不必使用操作,但它最適合 Application Insights 關聯資料模型。
RequestTelemetry 會充當父代作業,在背景工作角色反覆項目中生成的每個遙測資料在邏輯上都被視為屬於同一作業。
這種方法也可確保產生的遙測(自動和手動)具有相同的 operation_id。 因為取樣是以operation_id為基礎,因此取樣演算法會保留或捨棄單次迭代中的所有遙測。
收集遙測資料
本節內容
即時計量
即時指標可以用來快速驗證使用 Application Insights 的應用程式監視是否正確配置。 遙測可能需要幾分鐘的時間才會出現在 Azure 入口網站中,但 [即時計量] 窗格會近乎即時地顯示執行中處理序的 CPU 使用率。 它也可以顯示其他遙測資訊,例如請求、相依性、追蹤等。
備註
使用 .NET 應用程式的建議指示上線時,預設會啟用即時計量。
使用程式碼為任何 .NET 應用程式啟用即時計量
ASP.NET
若要手動設定即時計量:
安裝 NuGet 套件 Microsoft.ApplicationInsights.PerfCounterCollector。
下列範例主控台應用程式程式碼顯示設定即時計量:
using Microsoft.ApplicationInsights;
using Microsoft.ApplicationInsights.Extensibility;
using Microsoft.ApplicationInsights.Extensibility.PerfCounterCollector.QuickPulse;
using System;
using System.Threading.Tasks;

namespace LiveMetricsDemo
{
    class Program
    {
        static void Main(string[] args)
        {
            // Create a TelemetryConfiguration instance.
            TelemetryConfiguration config = TelemetryConfiguration.CreateDefault();
            config.ConnectionString = "<YOUR-CONNECTION-STRING>";
            QuickPulseTelemetryProcessor quickPulseProcessor = null;
            config.DefaultTelemetrySink.TelemetryProcessorChainBuilder
                .Use((next) =>
                {
                    quickPulseProcessor = new QuickPulseTelemetryProcessor(next);
                    return quickPulseProcessor;
                })
                .Build();

            var quickPulseModule = new QuickPulseTelemetryModule();

            // Secure the control channel.
            // This is optional, but recommended.
            quickPulseModule.AuthenticationApiKey = "<YOUR-API-KEY>";
            quickPulseModule.Initialize(config);
            quickPulseModule.RegisterTelemetryProcessor(quickPulseProcessor);

            // Create a TelemetryClient instance. It is important
            // to use the same TelemetryConfiguration here as the one
            // used to set up live metrics.
            TelemetryClient client = new TelemetryClient(config);

            // This sample runs indefinitely. Replace with actual application logic.
            while (true)
            {
                // Send dependency and request telemetry.
                // These will be shown in live metrics.
                // CPU/Memory Performance counter is also shown
                // automatically without any additional steps.
                client.TrackDependency("My dependency", "target", "http://sample",
                    DateTimeOffset.Now, TimeSpan.FromMilliseconds(300), true);
                client.TrackRequest("My Request", DateTimeOffset.Now,
                    TimeSpan.FromMilliseconds(230), "200", true);
                Task.Delay(1000).Wait();
            }
        }
    }
}
ASP.NET Core
若要手動設定即時計量:
安裝 NuGet 套件 Microsoft.ApplicationInsights.PerfCounterCollector。
下列範例主控台應用程式程式碼顯示設定即時計量:
using Microsoft.ApplicationInsights;
using Microsoft.ApplicationInsights.Extensibility;
using Microsoft.ApplicationInsights.Extensibility.PerfCounterCollector.QuickPulse;

// Create a TelemetryConfiguration instance.
TelemetryConfiguration config = TelemetryConfiguration.CreateDefault();
config.ConnectionString = "<YOUR-CONNECTION-STRING>";
QuickPulseTelemetryProcessor quickPulseProcessor = null;
config.DefaultTelemetrySink.TelemetryProcessorChainBuilder
    .Use((next) =>
    {
        quickPulseProcessor = new QuickPulseTelemetryProcessor(next);
        return quickPulseProcessor;
    })
    .Build();

var quickPulseModule = new QuickPulseTelemetryModule();

// Secure the control channel.
// This is optional, but recommended.
quickPulseModule.AuthenticationApiKey = "<YOUR-API-KEY>";
quickPulseModule.Initialize(config);
quickPulseModule.RegisterTelemetryProcessor(quickPulseProcessor);

// Create a TelemetryClient instance. It is important
// to use the same TelemetryConfiguration here as the one
// used to set up live metrics.
TelemetryClient client = new TelemetryClient(config);

// This sample runs indefinitely. Replace with actual application logic.
while (true)
{
    // Send dependency and request telemetry.
    // These will be shown in live metrics.
    // CPU/Memory Performance counter is also shown
    // automatically without any additional steps.
    client.TrackDependency("My dependency", "target", "http://sample",
        DateTimeOffset.Now, TimeSpan.FromMilliseconds(300), true);
    client.TrackRequest("My Request", DateTimeOffset.Now,
        TimeSpan.FromMilliseconds(230), "200", true);
    Task.Delay(1000).Wait();
}
上述範例適用於主控台應用程式,但相同的程式碼可用於任何 .NET 應用程式。
這很重要
如果已啟用任何其他遙測模組來自動收集遙測,請確定用於初始化這些模組的相同組態會用於即時計量模組。
備註
預設設定會收集 ILoggerWarning 記錄和更嚴重的記錄。 如需詳細資訊,請檢閱如何自訂 ILogger 記錄收集?。
背景工作服務
系統會自動擷取透過 ILogger 發出的嚴重性為「警告」或更高等級的日誌。 若要變更此行為,請明確覆蓋提供者 ApplicationInsights 的日誌配置,如下列程式碼所示。 下列設定可讓 Application Insights 擷取所有 Information 記錄和更嚴重的記錄。
{
  "Logging": {
    "LogLevel": {
      "Default": "Warning"
    },
    "ApplicationInsights": {
      "LogLevel": {
        "Default": "Information"
      }
    }
  }
}
請務必注意,下列範例不會導致 Application Insights 提供者擷取 Information 記錄。 它不會擷取紀錄,因為 SDK 會新增預設記錄篩選器,指示 ApplicationInsights 僅擷取 Warning 記錄和更嚴重的記錄。 Application Insights 需要明確覆寫。
{
  "Logging": {
    "LogLevel": {
      "Default": "Information"
    }
  }
}
備註
Application Insights 會遵循程式碼中透過 ConfigureLogging(...) 設定的記錄層級。 如果只使用 appsettings.json,且未明確覆寫 ConfigureLogging,則預設記錄層級為 Warning。
如需詳細資訊,請遵循 ILogger 檔 ,以自訂 Application Insights 所擷取的記錄層級。
追蹤 (記錄)
本節說明如何將診斷追蹤記錄從 ASP.NET 或 ASP.NET Core 應用程式傳送至 Application Insights,然後在入口網站中探索/搜尋這些記錄。
您可以使用追蹤日誌來識別與每個使用者要求相關聯的追蹤,並將其與其他事件和異常狀況報告相關聯。
Application Insights 會透過 ILogger 擷取來自 ASP.NET Core 和其他 .NET 應用程式的記錄,並透過傳統 SDK 和配接器擷取來自傳統 ASP.NET (.NET Framework) 的記錄。
備註
根據預設,Application Insights 提供者只會傳送嚴重性為
Warning或更高的記錄。 若要包含Information或更低層級的記錄,請在appsettings.json中更新記錄層級設定。用來背景服務啟用 Application Insights 的
Microsoft.ApplicationInsights.WorkerServiceNuGet 套件在範圍以外。若要檢閱常見問題 (FAQ),請參閱 使用 .NET 進行記錄的常見問題。
在您的應用程式中安裝記錄
ASP.NET
選擇記錄方法,以發出 Application Insights 可以收集的診斷記錄。
針對使用 System.Diagnostics 追蹤的傳統 ASP.NET 應用程式,請在設定中設定 Application Insights TraceListener 。
新增接聽器至 web.config 或 app.config。
<configuration>
  <system.diagnostics>
    <trace>
      <listeners>
        <add name="myAppInsightsListener"
             type="Microsoft.ApplicationInsights.TraceListener.ApplicationInsightsTraceListener, Microsoft.ApplicationInsights.TraceListener" />
      </listeners>
    </trace>
  </system.diagnostics>
</configuration>
備註
日誌捕獲模塊是第三方記錄器的有用適配器。 不過,如果您尚未使用 NLog、log4Net 或 System.Diagnostics.Trace,請考慮直接呼叫 Application Insights TrackTrace()。
設定 Application Insights 以收集記錄
選項 1: 如果您尚未將 Application Insights 新增至您的專案。 在 Visual Studio 中新增 Application Insights 時,有一個選項可以包含記錄收集器。
選項 2: 以滑鼠右鍵按一下 [方案總管] 中的專案,以 設定 Application Insights。 選取 [設定追蹤收集] 選項。
備註
如果您遺漏 Application Insights 功能表或記錄收集器選項,請參閱專用 的疑難排解文章。
ASP.NET Core
適用於 ASP.NET Core 的 Application Insights SDK 依預設已會收集 ILogger 記錄。 如果您使用 SDK,通常不需要也呼叫 builder.Logging.AddApplicationInsights() ,而且可以忽略下列 ILogger 安裝指示。
如果您只需要記錄轉送而非完整的遙測堆疊,可以使用 Microsoft.Extensions.Logging.ApplicationInsights 提供者套件來擷取記錄。
手動安裝
如果 Application Insights 安裝程式不支援您的專案類型 (例如,某些桌面/主控台案例) ,或您偏好明確的套件層級控制,請使用此方法。
在 [方案總管] 中,以滑鼠右鍵按一下您的專案,然後選取 [管理 NuGet 套件]。
搜尋 Application Insights。
選取下列其中一個套件:
-
ILogger: Microsoft.Extensions.Logging.ApplicationInsights

-
System.Diagnostics: Microsoft.ApplicationInsights.TraceListener

-
log4net: Microsoft.ApplicationInsights.Log4NetAppender

-
NLog:Microsoft.ApplicationInsights.NLogTarget

-
Microsoft.ApplicationInsights.EventSourceListener

-
Microsoft.ApplicationInsights.DiagnosticSourceListener

-
Microsoft.ApplicationInsights.EtwCollector

-
ILogger: Microsoft.Extensions.Logging.ApplicationInsights
NuGet 套件會安裝必要的元件,並修改 web.config 或 app.config(如果適用)。
安裝說明:
備註
展開以下任何區段,以取得套件特定的安裝指示。
ILogger
新增
ApplicationInsightsLoggerProvider:
using Microsoft.Extensions.Logging.ApplicationInsights;

var builder = WebApplication.CreateBuilder(args);

// Add services to the container.

builder.Services.AddControllers();
// Learn more about configuring Swagger/OpenAPI at https://aka.ms/aspnetcore/swashbuckle
builder.Services.AddEndpointsApiExplorer();
builder.Services.AddSwaggerGen();

builder.Logging.AddApplicationInsights(
        configureTelemetryConfiguration: (config) =>
            config.ConnectionString = builder.Configuration.GetConnectionString("APPLICATIONINSIGHTS_CONNECTION_STRING"),
            configureApplicationInsightsLoggerOptions: (options) => { }
    );

builder.Logging.AddFilter<ApplicationInsightsLoggerProvider>("your-category", LogLevel.Trace);

var app = builder.Build();

// Configure the HTTP request pipeline.
if (app.Environment.IsDevelopment())
{
    app.UseSwagger();
    app.UseSwaggerUI();
}

app.UseHttpsRedirection();

app.UseAuthorization();

app.MapControllers();

app.Run();
安裝 NuGet 套件,並使用相依性插入來註冊提供者之後,應用程式即可開始進行記錄。 若插入建構函式,則需使用 ILogger 或泛型替代項 ILogger<TCategoryName>。 這些實作經過解析後,ApplicationInsightsLoggerProvider 會提供這些實作。 記錄的訊息或例外狀況會傳送至 Application Insights。
請考慮下列範例控制器:
public class ValuesController : ControllerBase
{
    private readonly ILogger _logger;

    public ValuesController(ILogger<ValuesController> logger)
    {
        _logger = logger;
    }

    [HttpGet]
    public ActionResult<IEnumerable<string>> Get()
    {
        _logger.LogWarning("An example of a Warning trace..");
        _logger.LogError("An example of an Error level message");

        return new string[] { "value1", "value2" };
    }
}
如需詳細資訊,請參閱在 ASP.NET Core 中記錄,以及ILogger 記錄會產生哪些 Application Insights 遙測類型?在哪裡可以看到 Application Insights 中的 ILogger 記錄?。
插入診斷日誌呼叫 (System.Diagnostics.Trace / log4net / NLog)
如果您使用 System.Diagnostics.Trace,則典型的呼叫將是:
System.Diagnostics.Trace.TraceWarning("Slow response - database01");
如果您喜歡 log4net 或 NLog,請使用:
logger.Warn("Slow response - database01");
使用 EventSource 事件
您可以將 System.Diagnostics.Tracing.EventSource 事件設定為傳送至 Application Insights 做為追蹤。
安裝
Microsoft.ApplicationInsights.EventSourceListenerNuGet 套件。編輯
TelemetryModulesApplicationInsights.config 檔案的區段:<Add Type="Microsoft.ApplicationInsights.EventSourceListener.EventSourceTelemetryModule, Microsoft.ApplicationInsights.EventSourceListener"> <Sources> <Add Name="MyCompany" Level="Verbose" /> </Sources> </Add>
對於每個來源,您可以設定下列參數:
- 名稱 指定要收集的 EventSource 名稱。
- 層級會指定要收集的記錄層級:重大、錯誤、資訊、LogAlways、詳細資訊或警告。
- 關鍵字 (選用) 指定要使用的關鍵字組合的整數值。
使用 DiagnosticSource 事件
您可以設定 System.Diagnostics.DiagnosticSource 事件,以傳送至 Application Insights 做為追蹤。
安裝
Microsoft.ApplicationInsights.DiagnosticSourceListenerNuGet 套件。編輯
TelemetryModulesApplicationInsights.config 檔案的區段:<Add Type="Microsoft.ApplicationInsights.DiagnosticSourceListener.DiagnosticSourceTelemetryModule, Microsoft.ApplicationInsights.DiagnosticSourceListener"> <Sources> <Add Name="MyDiagnosticSourceName" /> </Sources> </Add>
針對您要追蹤的每一個診斷來源,新增一個項目,並將 Name 屬性設定為診斷來源的名稱。
使用 ETW 事件
您可以設定 Windows 事件追蹤 (ETW) 事件,以作為追蹤傳送至 Application Insights。
安裝
Microsoft.ApplicationInsights.EtwCollectorNuGet 套件。編輯 ApplicationInsights.config 檔案的「TelemetryModules」區段:
備註
只有在裝載 SDK 的進程在效能記錄檔使用者或系統管理員成員的身分識別下執行時,才能收集 ETW 事件。
    <Add Type="Microsoft.ApplicationInsights.EtwCollector.EtwCollectorTelemetryModule, Microsoft.ApplicationInsights.EtwCollector">
      <Sources>
        <Add ProviderName="MyCompanyEventSourceName" Level="Verbose" />
      </Sources>
    </Add>
對於每個來源,您可以設定下列參數:
- ProviderName 是要收集的 ETW 提供者名稱。
-
ProviderGuid 會指定要收集的 ETW 提供者的 GUID。 它可以取代
ProviderName。 - 層級 設定要收集的記錄層級。 它可以是 Critical、 Error、 Informational、 LogAlways、 Verbose 或 Warning。
- 關鍵字 (選用) 設定要使用的關鍵字組合的整數值。
直接使用追蹤 API
您可以直接呼叫 Application Insights 追蹤 API。 日誌配接器使用此 API。 例如:
TelemetryConfiguration configuration = TelemetryConfiguration.CreateDefault();
var telemetryClient = new TelemetryClient(configuration);
telemetryClient.TrackTrace("Slow response - database01");
的 TrackTrace 優點是您可以在訊息中放置相對較長的資料。 例如,您可以在那裡對 POST 資料進行編碼。
您也可以在訊息中新增嚴重性層級。 而且,就像其他遙測一樣,您可以新增屬性值,以協助篩選或搜尋不同的追蹤集。 例如:
TelemetryConfiguration configuration = TelemetryConfiguration.CreateDefault();
var telemetryClient = new TelemetryClient(configuration);
telemetryClient.TrackTrace("Slow database response",
                            SeverityLevel.Warning,
                            new Dictionary<string, string> { { "database", "db.ID" } });
現在,您可以在 「交易搜尋」 中輕鬆篩選出與特定資料庫相關的特定嚴重性層級的所有訊息。
主控台應用程式
若要將 Application Insights 記錄新增至主控台應用程式,請先安裝下列 NuGet 套件:
下列範例使用 Microsoft.Extensions.Logging.ApplicationInsights 套件,並示範主控台應用程式的預設行為。
Microsoft.Extensions.Logging.ApplicationInsights 套件應該用於主控台應用程式中,或每當您想要只進行 Application Insights 的最小化實作,不包含完整功能集 (例如計量、分散式追蹤、取樣和遙測初始設定式) 時。
using Microsoft.ApplicationInsights.Channel;
using Microsoft.ApplicationInsights.Extensibility;
using Microsoft.Extensions.DependencyInjection;
using Microsoft.Extensions.Logging;

using var channel = new InMemoryChannel();

try
{
    IServiceCollection services = new ServiceCollection();
    services.Configure<TelemetryConfiguration>(config => config.TelemetryChannel = channel);
    services.AddLogging(builder =>
    {
        // Only Application Insights is registered as a logger provider
        builder.AddApplicationInsights(
            configureTelemetryConfiguration: (config) => config.ConnectionString = "<YourConnectionString>",
            configureApplicationInsightsLoggerOptions: (options) => { }
        );
    });

    IServiceProvider serviceProvider = services.BuildServiceProvider();
    ILogger<Program> logger = serviceProvider.GetRequiredService<ILogger<Program>>();

    logger.LogInformation("Logger is working...");
}
finally
{
    // Explicitly call Flush() followed by Delay, as required in console apps.
    // This ensures that even if the application terminates, telemetry is sent to the back end.
    channel.Flush();

    await Task.Delay(TimeSpan.FromMilliseconds(1000));
}
如需詳細資訊,請參閱系統會從 ILogger 記錄產生哪些 Application Insights 遙測資料類型?在哪裡可以看到 Application Insights 中的 ILogger 記錄?。
錄範圍
備註
下列指導適用於 ILogger 案例 (僅限 ASP.NET Core 和主控台)。 它不適用於經典 ASP.NET。
ApplicationInsightsLoggingProvider 支援 記錄範圍,且根據預設為啟用。
如果範圍的類型 IReadOnlyCollection<KeyValuePair<string,object>> 為,則集合中的每個索引鍵/值組都會新增至 Application Insights 遙測資料作為自訂屬性。 在下列範例中,系統會將記錄擷取為 TraceTelemetry,且屬性中有 ("MyKey", "MyValue")。
using (_logger.BeginScope(new Dictionary<string, object> { ["MyKey"] = "MyValue" }))
{
    _logger.LogError("An example of an Error level message");
}
如果使用任何其他類型做為範圍,則會儲存在 Application Insights 遙測資料中的 Scope 屬性底下。 在下列範例中,TraceTelemetry 會有名為 Scope 的屬性,其中包含範圍。
using (_logger.BeginScope("hello scope"))
{
    _logger.LogError("An example of an Error level message");
}
尋找您的記錄
以偵錯模式執行您的應用程式或即時部署應用程式。
在交易搜索中探索
在 Application Insights 入口網站的應用程式概觀窗格中,選取交易搜尋,即可:
- 篩選日誌記錄或具有特定屬性的項目。
- 詳細檢查特定項目。
- 尋找與相同使用者要求相關的其他系統日誌資料 (具有相同的作業 ID)。
- 將頁面的設定儲存為我的最愛。
備註
如果您的應用程式傳送大量資料,而且您使用 Application Insights SDK for ASP.NET 2.0.0-beta3 版或更新版本,調適性取樣功能可能會運作並只傳送部分遙測資料。 深入了解取樣。
在 Azure 監控記錄中探索
ILogger 記錄會顯示為追蹤遙測 (在 Application Insights 中為資料表 traces,在 Log Analytics 中為 AppTraces)。
範例
在 Azure 入口網站中,移至 Application Insights 並執行:
traces
| where severityLevel >= 2 // 2=Warning, 1=Information, 0=Verbose
| take 50
分散式追蹤
現代雲端和 微服務 架構支援簡單、可獨立部署的服務,可降低成本,同時提高可用性和輸送量。 然而,它使整個系統更難推理和調試。 分散式追蹤透過提供效能分析器來解決這個問題,該分析器的工作方式類似於雲端和微服務架構的呼叫堆疊。
Azure 監視器提供兩種使用分散式追蹤資料的體驗:單一交易/要求的交易 診斷 檢視,以及顯示系統互動方式的 應用程式對應 檢視。
Application Insights 可以個別監視每個元件,並使用分散式遙測相互關聯來偵測哪個元件負責失敗或效能降低。 本文說明 Application Insights 所使用的不同語言和平臺上的資料模型、內容傳播技術、通訊協定,以及相互關聯策略的實作。
透過 Application Insights 使用自動檢測或 SDK 啟用分散式追蹤
適用於 .NET、.NET Core、Java、Node.js和 JavaScript 的 Application Insights 代理程式和 SDK 都原生支援分散式追蹤。
安裝並設定適當的 Application Insights SDK 後,SDK 相依性自動收集器會自動收集熱門架構、程式庫和技術的追蹤資訊。 支援技術的完整清單可在相依性自動化收集文檔中找到。
任何技術也可以透過呼叫 TelemetryClient 上的 TrackDependency 來手動追蹤。
遙測相互關聯的資料模型
Application Insights 會定義分散式遙測相互關聯的資料 模型 。 若要將遙測與邏輯作業產生關聯,每個遙測項目都有一個名為 operation_Id的內容欄位。 分散式追蹤中的每個遙測專案都會共用此識別碼。 因此,即使您遺失某一層的遙測資料,您仍然可以將其他組件報告的遙測資料進行配對。
分散式邏輯作業通常由一組較小的作業組成,這些作業是由其中一個元件所處理的要求。
請求遙測 定義這些作業。 每個要求遙測項目都有自己的 id,可唯一且全域地識別它。 與要求相關聯的所有遙測專案(例如追蹤和例外狀況)都應該將 operation_parentId 設定為要求 id 的值。
相依性遙測 代表每個外部操作,例如對另一個元件的 HTTP 呼叫。 它還定義了全球獨一無二的 id。 由這個相依性呼叫起始的要求遙測會使用 這個 id 作為其 operation_parentId。
您可以使用 operation_Id、operation_parentId 與 request.id 來建立分散式邏輯操作的 dependency.id 視圖。 這些欄位也會定義遙測呼叫的因果關係順序。
在微服務環境中,元件的追蹤資料可以儲存於不同的儲存項目。 每個元件都可以在 Application Insights 中擁有自己的連接字串。 若要取得邏輯作業的遙測,Application Insights 會從每個儲存項目查詢資料。
當儲存項目數量較多時,您需要提示下一步要去哪裡尋找。 Application Insights 資料模型會定義兩個欄位來解決此問題: request.source 和 dependency.target。 第一個欄位會識別起始相依性要求的元件。 第二個欄位會識別哪個元件傳回相依性呼叫的回應。
如需從多個不同執行個體查詢的相關資訊,請參閱 在 Azure 監視器中跨 Log Analytics 工作區、應用程式和資源查詢資料。
Example
讓我們看看下列範例。 名為 Stock Prices 的應用程式會使用稱為 Stock 的外部 API 來顯示股票的目前市場價格。 「股票價格」應用程式有一個名為「股票頁面」的頁面,用戶端 Web 瀏覽器會使用 GET /Home/Stock來開啟該頁面。 應用程式會使用 HTTP 呼叫 GET /api/stock/value來查詢 Stock API。
您可以執行查詢來分析產生的遙測:
(requests | union dependencies | union pageViews)
| where operation_Id == "STYz"
| project timestamp, itemType, name, id, operation_ParentId, operation_Id
在結果中,所有遙測專案都會共用根 operation_Id。 從頁面進行 Ajax 呼叫時,會將新的唯一 ID (qJSXU) 指派給相依性遙測,而 pageView 的 ID 會用作 operation_ParentId。 接著,伺服器要求會使用 Ajax 識別碼作為 operation_ParentId。
| 項目類型 | 名稱 | ID | operation_ParentId | 操作識別碼 |
|---|---|---|---|---|
| 頁面檢視 | 庫存頁面 | STYz |
STYz |
|
| 相依性 | GET /首頁/庫存 | qJSXU |
STYz |
STYz |
| 要求 | GET 首頁/庫存 | KqKwlrSt9PA= |
qJSXU |
STYz |
| 相依性 | 取得 /api/stock/value | bBrf2L7mm2g= |
KqKwlrSt9PA= |
STYz |
呼叫外部服務時 GET /api/stock/value ,您需要知道該伺服器的身分識別,以便適當地設定 dependency.target 欄位。 當外部服務不支援監視時, target 會設定為服務的主機名稱。 例如 stock-prices-api.com。 但是,如果服務透過傳回預先定義的 HTTP 標頭來識別自己, target 則包含允許 Application Insights 透過查詢該服務的遙測來建置分散式追蹤的服務身分識別。
使用 W3C TraceContext 的相互關聯標頭
Application Insights 正在過渡到 W3C Trace-Context 規範:
-
traceparent:攜帶呼叫的全域唯一操作ID和唯一識別碼。 -
tracestate:包含系統特定的追蹤上下文。
最新版本的 Application Insights SDK 支援 Trace-Context 通訊協定,但您可能需要選擇加入。 (會維護與 Application Insights SDK 所支援的先前相互關聯通訊協定的回溯相容性。
相關性 HTTP 通訊協定 (也稱為 Request-Id) 即將取代。 此通訊協定定義兩個標頭:
-
Request-Id:承載通話的全域唯一識別碼。 -
Correlation-Context:攜帶分散式追蹤屬性的名稱值配對集合。
Application Insights 也會定義相互關聯 HTTP 通訊協定的 延伸模組 。 它會使用 Request-Context 名稱值組來傳遞立即呼叫端或被呼叫者所使用的屬性集合。 Application Insights SDK 會使用此標頭來設定 dependency.target 和 request.source 欄位。
W3C Trace-Context 和 Application Insights 資料模型會依照下列方式對應:
| Application Insights | W3C TraceContext |
|---|---|
Id 的 Request 和 Dependency |
父 ID |
Operation_Id |
追蹤識別碼 |
Operation_ParentId |
此範圍父代範圍的 parent-id。 如果此欄位是根範圍,則必須是空的。 |
如需詳細資訊,請參閱 Application Insights 遙測資料模型。
啟用 W3C 分散式追蹤支援
W3C TraceContext 的分散式追蹤在所有最近的 .NET Framework 和 .NET Core SDK 中預設啟用,並且支援與舊版 Request-Id 通訊協定的向後相容性。
遙測相關性
在導入應用程式時,依預設會處理關聯。 不需要特殊動作。
.NET 執行階段藉由 Activity 和 DiagnosticSource 來支援分散式
Application Insights .NET SDK 會使用 DiagnosticSource 和 Activity 來收集和關聯遙測數據。
依賴
自動追蹤的相依性
適用於 .NET 和 .NET Core 的 Application Insights SDK 隨附 DependencyTrackingTelemetryModule,這是會自動收集相依性的遙測模組。 模組 DependencyTrackingTelemetryModule 隨附於 Microsoft.ApplicationInsights.DependencyCollector NuGet 套件中,並會在您使用 Microsoft.ApplicationInsights.Web NuGet 套件或 Microsoft.ApplicationInsights.AspNetCore NuGet 套件時自動引入。
目前,DependencyTrackingTelemetryModule 會自動追蹤下列相依性:
| 依賴 | 詳細資訊 |
|---|---|
| HTTP/HTTPS | 本機或遠端 HTTP/HTTPS 呼叫。 |
| WCF 呼叫 | 只有在使用 HTTP 型繫結時,才會自動追蹤。 |
| SQL | 使用 SqlClient 發出的呼叫。 如需擷取 SQL 查詢,請參閱透過進階 SQL 追蹤取得完整的 SQL 查詢一節。 |
| Azure Blob 儲存體、資料表儲存體或佇列儲存體 | 使用 Azure 儲存體用戶端發出的呼叫。 |
| Azure 事件中樞用戶端 SDK | 使用最新的套件:https://nuget.org/packages/Azure.Messaging.EventHubs。 |
| Azure 服務匯流排用戶端 SDK | 使用最新的套件:https://nuget.org/packages/Azure.Messaging.ServiceBus。 |
| Azure Cosmos DB | 如果使用 HTTP/HTTPS,則會自動追蹤。 在直接模式中透過 TCP 對作業的追蹤會使用預覽套件 >= 3.33.0-preview 來自動擷取。 如需詳細資訊,請瀏覽 檔。 |
如果相依性未自動收集,您可以透過追蹤相依性呼叫以手動方式加以追蹤。
如需相依性追蹤運作方式的詳細資訊,請參閱 Application Insights 的相依性追蹤。
在主控台應用程式中設定自動相依性追蹤
若要從 .NET 主控台應用程式自動追蹤相依性,請安裝 NuGet 套件 Microsoft.ApplicationInsights.DependencyCollector 並初始化 DependencyTrackingTelemetryModule:
    DependencyTrackingTelemetryModule depModule = new DependencyTrackingTelemetryModule();
    depModule.Initialize(TelemetryConfiguration.Active);
備註
對於 .NET Core 主控台應用程式,TelemetryConfiguration.Active 已過時。
手動追蹤相依性
下列相依性範例不是自動收集的,因此需要手動追蹤:
- 只有在使用 HTTP/HTTPS 的情況下,才會自動追蹤 Azure Cosmos DB。 對於早於
2.22.0-Beta1的 SDK 版本,Application Insights 不會自動擷取 TCP 模式。 - Redis
對於未由 SDK 自動收集的相依性,您可以使用標準自動收集模組所使用的 TrackDependency API 以手動方式加以追蹤。
範例
如果您建置程式碼的組件不是您自己撰寫的,您可以對其所有的呼叫計時。 此案例可讓您了解其佔回應時間的比例。
若要在 Application Insights 中的相依性圖表中顯示此資料,請使用 TrackDependency 傳送此資料。
    var startTime = DateTime.UtcNow;
    var timer = System.Diagnostics.Stopwatch.StartNew();
    try
    {
        // making dependency call
        success = dependency.Call();
    }
    finally
    {
        timer.Stop();
        telemetryClient.TrackDependency("myDependencyType", "myDependencyCall", "myDependencyData", startTime, timer.Elapsed, success);
    }
或者,TelemetryClient 提供擴充方法 StartOperation 和 StopOperation,可用來手動追蹤相依性,如外部相依性追蹤所示。
停用標準相依性追蹤模組
如需詳細資訊,請參閱遙測模組。
透過進階 SQL 追蹤取得完整的 SQL 查詢
對於 SQL 呼叫,一律會收集伺服器和資料庫的名稱,並儲存為所收集 DependencyTelemetry 的名稱。 另一個稱為 data 的欄位可以包含完整的 SQL 查詢文字。
備註
Azure Functions 需要個別設定以啟用 SQL 文字收集。 如需詳細資訊,請參閱啟用 SQL 查詢集合。
ASP.NET
對於 ASP.NET 應用程式,會在位元組字碼檢測的輔助下收集完整的 SQL 查詢文字,這需要使用檢測引擎或使用 Microsoft.Data.SqlClient NuGet 套件,而不是 System.Data.SqlClient 程式庫。 下表描述啟用完整 SQL 查詢集合的平台專用步驟。
| 平台 | 取得完整 SQL 查詢所需的步驟 |
|---|---|
| Azure App Service 中的 Web Apps | 在 Web 應用程式控制台中,開啟 Application Insights 窗格,然後在 .NET 下啟用 SQL 命令。 |
| IIS 伺服器 (Azure 虛擬機器、內部部署等) | 使用 Microsoft.Data.SqlClient NuGet 套件,或使用 Application Insights 代理程式 PowerShell 模組來安裝檢測引擎並重新啟動 IIS。 |
| Azure 雲端服務 | 新增啟動工作以安裝 StatusMonitor。 您的應用程式應在建置期間上線至 ApplicationInsights SDK,方法是安裝適用於 ASP.NET 或 ASP.NET Core 應用程式的 NuGet 套件。 |
| IIS Express | 使用 Microsoft.Data.SqlClient NuGet 套件。 |
| Azure App Service 中的 WebJobs | 使用 Microsoft.Data.SqlClient NuGet 套件。 |
除了上述平台專用步驟以外,您也必須使用下列程式碼修改 檔案,以明確地選擇啟用 SQL 命令集合ApplicationInsights.config:
<TelemetryModules>
  <Add Type="Microsoft.ApplicationInsights.DependencyCollector.DependencyTrackingTelemetryModule, Microsoft.AI.DependencyCollector">
    <EnableSqlCommandTextInstrumentation>true</EnableSqlCommandTextInstrumentation>
  </Add>
ASP.NET Core
對於 ASP.NET Core 應用程式,必須使用下列方式選擇加入 SQL Text 收集:
services.ConfigureTelemetryModule<DependencyTrackingTelemetryModule>((module, o) => { module. EnableSqlCommandTextInstrumentation = true; });
在上述案例中,驗證檢測引擎是否已正確安裝的正確方式,就是驗證所收集 DependencyTelemetry 的 SDK 版本是否為 rddp。 使用 rdddsd 或 rddf 指出相依性是透過 DiagnosticSource 或 EventSource 回呼來收集,因此不會擷取完整的 SQL 查詢。
Exceptions
Web 應用程式中的例外狀況可以使用 Application Insights 報告。 失敗的要求可以與用戶端和伺服器端的例外狀況和其他事件相互關聯,加速診斷原因。 在本節中,您將了解如何設定例外狀況報告、明確報告例外狀況、診斷失敗等。
設定例外狀況報告
您可以設定 Application Insights 報告伺服器或用戶端中發生的例外狀況。 根據應用程式所在的平台,您需要適當的延伸模組或 SDK。
Server-side
若要從伺服器端應用程式回報例外狀況,請考慮下列情節:
- 新增適用於 Azure Web 應用程式的 Application Insights 延伸模組。
- 新增 應用程式監視延伸模組,適用於 Azure 虛擬機器和 Azure 虛擬機器規模設定集中的 IIS 託管應用程式。
- 將 Application Insights SDK 新增至您的應用程式程式碼、執行適用於 IIS 網頁伺服器的 Application Insights 代理程式,或啟用適用於 JAVA Web 應用程式的 JAVA 代理程式。
Client-side
JavaScript SDK 的功能提供用戶端報告網頁瀏覽器中發生的例外狀況。 若要在用戶端上設定例外狀況報告,請參閱適用於網頁的 Application Insights。
應用程式架構
使用某些應用程式架構時,需要更多設定。 請考慮下列技術:
這很重要
本節著重於從程式碼範例觀點的 .NET Framework 應用程式。 部分適用於 .NET Framework 的方法在 .NET Core SDK 中已淘汰。
診斷失敗和例外狀況
Azure 入口網站
Application Insights 隨附精心設計的 Application Performance Management 體驗,協助您診斷受監視應用程式中的失敗。
如需詳細指示,請參閱使用 Application Insights 調查失敗、效能和交易 (部分機器或 AI 翻譯)。
Visual Studio
在 Visual Studio 2019 中開啟應用程式啟解決方案。 使用 F5 執行伺服器或開發機器上的應用程式。 重新建立例外狀況。
在 Visual Studio 中開啟 [Application Insights 搜尋] 遙測視窗。 偵錯時,請選取 [Application Insights] 下拉式清單。
選取例外狀況報告,並顯示其堆疊追蹤。 若要開啟相關程式碼檔案,請選取堆疊追蹤中的行參考。
如果已啟用 CodeLens,您會看到例外狀況的資料:


自訂追蹤和記錄資料
若要取得您的 app 的特定診斷資料,您可以插入程式碼以傳送您自己的遙測資料。 您自訂的遙測或記錄資料會顯示在診斷搜尋,除此之外,還會顯示要求、頁面檢視和其他自動收集的資料。
使用 Microsoft.VisualStudio.ApplicationInsights.TelemetryClient 時,您可以使用下列幾個 API:
- TelemetryClient.TrackEvent 通常用來監視使用模式,但它傳送的資料也會顯示在診斷搜尋的 [自訂事件] 下。 事件具有名稱,並且可以包含字串屬性和數值度量,您可以對其篩選診斷搜尋。
- TelemetryClient.TrackTrace 讓您傳送較長的資料,例如 POST 資訊。
- TelemetryClient.TrackException 會傳送例外狀況詳細資料,例如堆疊追蹤、Application Insights。
若要查看這些事件,請在左側功能表上開啟 [搜尋]。 選取下拉式功能表 [事件種類],然後選擇 [自訂事件]、[追蹤] 或 [例外狀況]。
![顯示 [搜尋] 畫面控制項的螢幕擷取畫面。](media/classic-api/custom-events.png#lightbox)
備註
如果您的應用程式會產生大量遙測資料,調適型取樣模組會自動僅傳送事件代表性片段,減少傳送到入口網站的量。 會以群組形式選取或取消選取屬於相同作業的事件,讓您可以在相關事件之間瀏覽。 如需詳細資訊,請參閱在 Application Insights 中取樣。
查看要求 POST 資料
要求詳細資料不包括在 POST 呼叫中傳送至您的應用程式的資料。 若要報告此資料:
- 將 Application Insights SDK 新增至您的應用程式程式碼。
- 在您的應用程式中插入程式碼來呼叫 Microsoft.ApplicationInsights.TrackTrace()。 在訊息參數中傳送 POST 資料。 允許的大小有所限制,所以應嘗試只傳送基本的資料。
- 當您調查失敗的要求時,會發現相關聯的追蹤。
擷取例外狀況和相關的診斷資料
根據預設,並非所有導致應用程式失敗的例外狀況都會顯示在入口網站中。 如果您在網頁中使用 JavaScript SDK,就會看到瀏覽器例外狀況。 但是大部分伺服器端例外狀況會被 IIS 攔截,因此您需要新增一些程式碼來擷取並報告它們。
您可以:
- 明確記錄例外狀況 ,方法是將程式碼插入例外狀況處理常式中,以報告例外狀況。
- 自動擷取例外狀況 ,方法是設定您的 ASP.NET 架構。 架構類型不同,則必要的新增項目也不同。
明確報告例外狀況
最簡單的方法是在例外處理常式中插入 trackException() 的呼叫。
C#
var telemetry = new TelemetryClient();

try
{
    // ...
}
catch (Exception ex)
{
    var properties = new Dictionary<string, string>
    {
        ["Game"] = currentGame.Name
    };

    var measurements = new Dictionary<string, double>
    {
        ["Users"] = currentGame.Users.Count
    };

    // Send the exception telemetry:
    telemetry.TrackException(ex, properties, measurements);
}
JavaScript
try
{
    // ...
}
catch (ex)
{
    appInsights.trackException(ex, "handler loc",
    {
        Game: currentGame.Name,
        State: currentGame.State.ToString()
    });
}
屬性和度量參數為選用,但對於篩選和新增額外資訊來說,相當有用。 例如,如果您有一個可以運行多個遊戲的應用程序,您可以找到與特定遊戲相關的例外報告。 您可以將許多項目加入至每個字典,且項目數量不限。
瀏覽器例外狀況
大部分的瀏覽器例外狀況都會報告。
如果您的網頁包含來自內容傳遞網路或其他網域的指令碼檔案,請確定指令碼標籤具有屬性 crossorigin="anonymous",而且伺服器會傳送 CORS 標頭。 此行為可讓您從這些資源取得未處理 JavaScript 例外狀況的堆疊追蹤和詳細資料。
重複使用遙測用戶端
備註
建議您具現化 TelemetryClient 一次,並在應用程式生命週期中重複使用。
使用 .NET 中的相依性插入 (DI)、適當的 .NET SDK,及正確設定的 DI Application Insights,您可以要求 TelemetryClient,作為建構函式參數。
public class ExampleController : ApiController
{
    private readonly TelemetryClient _telemetryClient;

    public ExampleController(TelemetryClient telemetryClient)
    {
        _telemetryClient = telemetryClient;
    }
}
在上述範例中,TelemetryClient 會插入 ExampleController 類別。
Web Form
對於 Web Form,HTTP 模組能夠在未使用 CustomErrors 設定重新導向時收集例外狀況。 但使用重新導向時,請新增下列程式碼至 Application_Error 的 函式。
void Application_Error(object sender, EventArgs e)
{
    if (HttpContext.Current.IsCustomErrorEnabled &&
        Server.GetLastError () != null)
    {
        _telemetryClient.TrackException(Server.GetLastError());
    }
}
在上述範例中,_telemetryClient 類型 TelemetryClient 的類別範圍變數。
MVC
從 Application Insights Web SDK 2.6 版 (beta3 和更新版本) 開始,Application Insights 會自動收集在 MVC 5+ 控制器方法中擲回的未處理例外狀況。 如果您之前已新增追蹤這類例外狀況的自訂處理常式,為避免重複追蹤例外狀況,請移除該處理常式。
例外狀況篩選無法正確處理錯誤,或擲回例外狀況時,有數種情節:
- 從控制器建構函式
- 從訊息處理常式
- 路由傳送期間
- 回應內容序列化期間
- 應用程式啟動期間
- 在背景工作中
由應用程式處理的所有例外狀況仍然需要手動追蹤。 源自控制器的未處理例外狀況通常會導致 500「內部伺服器錯誤」回應。 如果此類回應是因為已處理的例外狀況 (或根本沒有例外狀況) 而手動建構的,則對應的要求遙測會加以追蹤並產生 ResultCode 500。 不過,Application Insights SDK 無法追蹤對應的例外狀況。
舊版支援
如果您使用 Application Insights Web SDK 2.5 (和較早版本) 的 MVC 4 (和較早版本),請參閱以下範例以追蹤例外狀況。
展開以檢視舊版的指示
如果 CustomErrors 設定是 Off,則例外狀況將可供 HTTP 模組收集。 不過如果是設定為 RemoteOnly (預設值) 或 On,則會清除例外狀況,且不適用於讓 Application Insights 自動收集。 您可以藉由覆寫 System.Web.Mvc.HandleErrorAttribute 類別,並且針對以下不同的 MVC 版本套用已覆寫的類別來修正該行為 (請參閱 GitHub 來源) (英文):
using System;
using System.Web.Mvc;
using Microsoft.ApplicationInsights;

namespace MVC2App.Controllers
{
    [AttributeUsage(AttributeTargets.Class | AttributeTargets.Method, Inherited = true, AllowMultiple = true)]
    public class AiHandleErrorAttribute : HandleErrorAttribute
    {
        public override void OnException(ExceptionContext filterContext)
        {
            if (filterContext != null && filterContext.HttpContext != null && filterContext.Exception != null)
            {
                //The attribute should track exceptions only when CustomErrors setting is On
                //if CustomErrors is Off, exceptions will be caught by AI HTTP Module
                if (filterContext.HttpContext.IsCustomErrorEnabled)
                {   //Or reuse instance (recommended!). See note above.
                    var ai = new TelemetryClient();
                    ai.TrackException(filterContext.Exception);
                }
            }
            base.OnException(filterContext);
        }
    }
}
MVC 2
使用您控制器中的新屬性取代 HandleError 屬性:
    namespace MVC2App.Controllers
    {
        [AiHandleError]
        public class HomeController : Controller
        {
            // Omitted for brevity
        }
    }
MVC 3
登錄 AiHandleErrorAttribute 作為 Global.asax.cs 中的全域篩選:
public class MyMvcApplication : System.Web.HttpApplication
{
    public static void RegisterGlobalFilters(GlobalFilterCollection filters)
    {
        filters.Add(new AiHandleErrorAttribute());
    }
}
MVC 4、MVC 5
登錄 AiHandleErrorAttribute 作為 FilterConfig.cs 中的全域篩選:
public class FilterConfig
{
    public static void RegisterGlobalFilters(GlobalFilterCollection filters)
    {
        // Default replaced with the override to track unhandled exceptions
        filters.Add(new AiHandleErrorAttribute());
    }
}
網路應用程式介面
從 Application Insights Web SDK 2.6 版 (beta3 和更新版本) 開始,Application Insights 會自動針對 Web API 2+ 收集在控制器方法中擲回的未處理例外狀況。 如果您先前已新增自訂處理常式來追蹤此類例外狀況 (如下列範例中所述),您可以將其移除,以避免重複追蹤例外狀況。
有一些例外狀況篩選條件無法處理的案例。 例如:
- 從控制器建構函式擲回的例外狀況。
- 從訊息處理常式擲回的例外狀況。
- 在路由期間擲回的例外狀況。
- 在回應內容序列化期間擲回的例外狀況。
- 在應用程式啟動期間擲回的例外狀況。
- 背景工作中擲回的例外狀況。
由應用程式處理的所有例外狀況仍然需要手動追蹤。 源自控制器的未處理例外狀況通常會導致 500「內部伺服器錯誤」回應。 如果此類回應是因為已處理的例外狀況 (或根本沒有例外狀況) 而手動建構的,則對應的要求遙測會加以追蹤並產生 ResultCode 500。 不過,Application Insights SDK 無法追蹤對應的例外狀況。
舊版支援
如果您使用 Application Insights Web SDK 2.5 (和較早版本) 的 Web API 1 (和較早版本),請參閱以下範例以追蹤例外狀況。
展開以檢視舊版的指示
Web API 1.x
覆寫 System.Web.Http.Filters.ExceptionFilterAttribute:
using System.Web.Http.Filters;
using Microsoft.ApplicationInsights;

namespace WebAPI.App_Start
{
    public class AiExceptionFilterAttribute : ExceptionFilterAttribute
    {
    public override void OnException(HttpActionExecutedContext actionExecutedContext)
    {
        if (actionExecutedContext != null && actionExecutedContext.Exception != null)
        {  //Or reuse instance (recommended!). See note above.
            var ai = new TelemetryClient();
            ai.TrackException(actionExecutedContext.Exception);
        }
        base.OnException(actionExecutedContext);
    }
    }
}
您可以新增此覆寫的屬性至特定的控制器,或新增至 WebApiConfig 類別中的全域篩選設定:
using System.Web.Http;
using WebApi1.x.App_Start;

namespace WebApi1.x
{
    public static class WebApiConfig
    {
        public static void Register(HttpConfiguration config)
        {
            config.Routes.MapHttpRoute(
                name: "DefaultApi",
                routeTemplate: "api/{controller}/{id}",
                defaults: new { id = RouteParameter.Optional });

            // ...
            config.EnableSystemDiagnosticsTracing();

            // Capture exceptions for Application Insights:
            config.Filters.Add(new AiExceptionFilterAttribute());
        }
    }
}
Web API 2.x
新增 IExceptionLogger 的實作:
using System.Web.Http.ExceptionHandling;
using Microsoft.ApplicationInsights;

namespace ProductsAppPureWebAPI.App_Start
{
    public class AiExceptionLogger : ExceptionLogger
    {
        public override void Log(ExceptionLoggerContext context)
        {
            if (context != null && context.Exception != null)
            {
                //or reuse instance (recommended!). see note above
                var ai = new TelemetryClient();
                ai.TrackException(context.Exception);
            }
            base.Log(context);
        }
    }
}
將此程式碼片段新增至 WebApiConfig 中的服務:
using System.Web.Http;
using System.Web.Http.ExceptionHandling;
using ProductsAppPureWebAPI.App_Start;

namespace WebApi2WithMVC
{
    public static class WebApiConfig
    {
        public static void Register(HttpConfiguration config)
        {
            // Web API configuration and services

            // Web API routes
            config.MapHttpAttributeRoutes();

            config.Routes.MapHttpRoute(
                name: "DefaultApi",
                routeTemplate: "api/{controller}/{id}",
                defaults: new { id = RouteParameter.Optional });

            config.Services.Add(typeof(IExceptionLogger), new AiExceptionLogger());
        }
    }
}
做為替代方案,您可以:
- 使用
ExceptionHandler自訂實作取代唯一的IExceptionHandler執行個體。 此例外處理常式只會在架構仍然可以選擇要針對執行個體傳送的回應訊息時呼叫 (不會在中止連接時呼叫)。 - 使用在所有案例中均不會呼叫的例外狀況篩選條件 (如先前 Web API 1.x 控制器章節所述)。
WCF
新增擴充 Attribute 及實作 IErrorHandler 和 IServiceBehavior 的類別。
    using System;
    using System.Collections.Generic;
    using System.Linq;
    using System.ServiceModel.Description;
    using System.ServiceModel.Dispatcher;
    using System.Web;
    using Microsoft.ApplicationInsights;

    namespace WcfService4.ErrorHandling
    {
      public class AiLogExceptionAttribute : Attribute, IErrorHandler, IServiceBehavior
      {
        public void AddBindingParameters(ServiceDescription serviceDescription,
            System.ServiceModel.ServiceHostBase serviceHostBase,
            System.Collections.ObjectModel.Collection<ServiceEndpoint> endpoints,
            System.ServiceModel.Channels.BindingParameterCollection bindingParameters)
        {
        }

        public void ApplyDispatchBehavior(ServiceDescription serviceDescription,
            System.ServiceModel.ServiceHostBase serviceHostBase)
        {
            foreach (ChannelDispatcher disp in serviceHostBase.ChannelDispatchers)
            {
                disp.ErrorHandlers.Add(this);
            }
        }

        public void Validate(ServiceDescription serviceDescription,
            System.ServiceModel.ServiceHostBase serviceHostBase)
        {
        }

        bool IErrorHandler.HandleError(Exception error)
        {//or reuse instance (recommended!). see note above
            var ai = new TelemetryClient();

            ai.TrackException(error);
            return false;
        }

        void IErrorHandler.ProvideFault(Exception error,
            System.ServiceModel.Channels.MessageVersion version,
            ref System.ServiceModel.Channels.Message fault)
        {
        }
      }
    }
將屬性新增至服務實作:
namespace WcfService4
{
    [AiLogException]
    public class Service1 : IService1
    {
        // Omitted for brevity
    }
}
例外狀況效能計數器
如果伺服器已安裝 Azure 監視器 Application Insights 代理程式,即可取得 .NET 測量的例外狀況比率圖。 這包括已處理和未處理的 .NET 例外狀況。
開啟 [計量總管] 索引標籤並新增新圖表。 在 [效能計數器] 底下,選取 [例外狀況比率]。
.NET Framework 會計算間隔中的例外狀況次數並除以間隔長度,以計算得出例外狀況比率。
此計數與 Application Insights 入口網站執行 TrackException 報告計數算得的「例外狀況」計數不同。 取樣間隔不同,且 SDK 不會針對所有已處理與未處理的例外狀況傳送 TrackException 報告。
自訂計量收集
Azure 監視器 Application Insights .NET 和 .NET Core SDK 有兩種不同的收集自訂計量方法:
-
TrackMetric()方法,缺少預先彙總。 -
GetMetric()方法,具備預先彙總。
建議使用彙總,,因此 TrackMetric()不再是收集自訂計量的慣用方法。 此文章將逐步引導您使用 GetMetric() 方法,以及其運作方式背後的一些原理。
展開以深入了解預先彙總與非預先彙總 API 的差異
TrackMetric() 方法會傳送代表計量的原始遙測。 針對每個值傳送單一遙測項目的效率不佳。
TrackMetric() 方法在效能方面的效率也不佳,因為每個 TrackMetric(item) 都要經過遙測初始設定式和處理器的完整 SDK 管線。
不同於 TrackMetric(),GetMetric() 會為您處理本機預先彙總,然後只以一分鐘的固定間隔提交彙總的摘要計量。 如果您需要以秒或甚至毫秒層級密切監視某些自訂計量,您可以執行此動作,同時僅會產生每分鐘只監視一次的儲存體和網路流量成本。 此行為也可大幅降低發生節流的風險,因為需要針對彙總計量傳送的遙測項目總數會大幅降低。
在 Application Insights 中,透過 TrackMetric() 和 GetMetric() 收集的自訂計量不會受到取樣影響。 針對重要計量進行取樣,可能會導致以這些計量為基礎建置的警示在某些案例中變得不可靠。 由於絕對不會針對您的自訂計量進行取樣,因此,您通常能夠確信當警示閾值有缺口時,就會引發警示。 因為不會針對自訂計量進行取樣,所以有一些潛在的疑慮。
逐秒追蹤計量中的趨勢,或使用更精細的間隔,可能會導致:
- 增加資料儲存體成本。 傳送至 Azure 監視器的資料量會產生相關聯的成本。 您傳送的資料越多,整體監視成本就越高。
- 增加網路流量或效能額外負荷。 在某些情況下,此額外負荷可能同時帶來費用與應用程式效能成本。
- 擷取節流的風險。 您的應用程式在短時間內傳送高比率的遙測時,Azure 監視器就會捨棄 (「節流」) 資料點。
節流可能會導致警示闕漏,是一項顧慮。 觸發警示的條件可能會在本地發生,但隨後在擷取端點上可能因傳送的資料過多而遭到卸除。 除非您實作了自己的本機彙總邏輯,否則不建議對 .NET 和 .NET Core 使用 TrackMetric()。 如果您嘗試追蹤每個會在指定時段發生事件的執行個體,則可能發現 TrackEvent() 更適合。 請記住,與自訂計量不同,自訂事件需要進行取樣。 即使您未撰寫自己的本機預先彙總,仍然可以使用 TrackMetric()。 但是,如果您這麼做,請注意其缺陷。
總而言之,建議使用 GetMetric(),因為它會執行預先彙總,所以會累積來自全部 Track() 呼叫的值,且每分鐘傳送摘要/彙總一次。
GetMetric() 方法可透過傳送較少資料點,同時仍能收集全部相關資訊,大幅降低成本和效能額外負荷。
開始使用 GetMetric
在我們的範例中,將使用基本的 .NET Core 3.1 背景工作服務應用程式。 如果您想要複製在這些範例中使用的測試環境,請依照 .NET Core Worker Service 應用程式底下的步驟 1-6。 這些步驟會將 Application Insights 新增至基本背景工作角色服務專案範本。 這些概念適用於任何可使用 SDK 的一般應用程式,包括 Web 應用程式和主控台應用程式。
傳送計量
以下列程式碼取代 worker.cs 檔案的內容:
using System;
using System.Threading;
using System.Threading.Tasks;
using Microsoft.Extensions.Hosting;
using Microsoft.Extensions.Logging;
using Microsoft.ApplicationInsights;

namespace WorkerService3
{
    public class Worker : BackgroundService
    {
        private readonly ILogger<Worker> _logger;
        private TelemetryClient _telemetryClient;

        public Worker(ILogger<Worker> logger, TelemetryClient tc)
        {
            _logger = logger;
            _telemetryClient = tc;
        }

        protected override async Task ExecuteAsync(CancellationToken stoppingToken)
        {   // The following line demonstrates usages of GetMetric API.
            // Here "computersSold", a custom metric name, is being tracked with a value of 42 every second.
            while (!stoppingToken.IsCancellationRequested)
            {
                _telemetryClient.GetMetric("ComputersSold").TrackValue(42);

                _logger.LogInformation("Worker running at: {time}", DateTimeOffset.Now);
                await Task.Delay(1000, stoppingToken);
            }
        }
    }
}
執行範例程式碼時,您會看到 while 迴圈重複執行,且 Visual Studio 輸出視窗中不會傳送任何遙測。 單一遙測項目會在 60 秒左右傳送,在我們的測試中顯示如下:
Application Insights Telemetry: {"name":"Microsoft.ApplicationInsights.Dev.00000000-0000-0000-0000-000000000000.Metric", "time":"2019-12-28T00:54:19.0000000Z",
"ikey":"00000000-0000-0000-0000-000000000000",
"tags":{"ai.application.ver":"1.0.0.0",
"ai.cloud.roleInstance":"Test-Computer-Name",
"ai.internal.sdkVersion":"m-agg2c:2.12.0-21496",
"ai.internal.nodeName":"Test-Computer-Name"},
"data":{"baseType":"MetricData",
"baseData":{"ver":2,"metrics":[{"name":"ComputersSold",
"kind":"Aggregation",
"value":1722,
"count":41,
"min":42,
"max":42,
"stdDev":0}],
"properties":{"_MS.AggregationIntervalMs":"42000",
"DeveloperMode":"true"}}}}
此單一遙測項目代表 41 個相異公制度量單位的彙總。 由於我們反覆傳送相同值,因此,我們的「標準差 (stDev))」為 0,且最大值 (max) 和最小值 (min) 的值完全相同。
value 屬性代表已彙總的全部個別值總和。
備註
GetMetric 不支援追蹤最後一個值 (例如,gauge) 或追蹤長條圖或分佈。
如果我們檢查 [記錄 (分析)] 體驗中的 Application Insights 資源,個別遙測項目下列螢幕擷取畫面所示。

備註
儘管原始遙測項目並未在內嵌後包含明確的總和屬性/欄位,但我們會為您建立一個。 在此情況下,value 和 valueSum 屬性都代表同一個項目。
您也可以在入口網站的 [計量] 區段中存取自訂計量遙測,做為記錄型和自訂計量。 下列螢幕擷取畫面是記錄型計量的範例。

適用於高輸送量用途的快取計量參考
在某些情況下,可能會經常觀察到計量值。 例如,處理每秒 500 個要求的高輸送量服務,可能想要針對每個要求發出 20 個遙測計量。 此結果表示每秒會追蹤 10,000 個值。 在這類高輸送量案例中,使用者可能需要避免某些查閱來協助 SDK。
例如,上述範例對計量 ComputersSold 執行控制代碼的查閱,然後追蹤觀察到的值 42。 相反地,可能會快取多個追蹤叫用的控制代碼:
//...

        protected override async Task ExecuteAsync(CancellationToken stoppingToken)
        {
            // This is where the cache is stored to handle faster lookup
            Metric computersSold = _telemetryClient.GetMetric("ComputersSold");
            while (!stoppingToken.IsCancellationRequested)
            {

                computersSold.TrackValue(42);

                computersSold.TrackValue(142);

                _logger.LogInformation("Worker running at: {time}", DateTimeOffset.Now);
                await Task.Delay(50, stoppingToken);
            }
        }
除了快取計量控制代碼之外,上述範例也將 Task.Delay 縮減為 50 毫秒,讓迴圈執行頻率更高。 結果產生 772 次 TrackValue() 叫用。
多維度計量
上一節的範例顯示零維度計量。 計量也可以是多維度的。 目前最多支援 10 個維度。
以下是如何建立一維計量的範例:
//...

        protected override async Task ExecuteAsync(CancellationToken stoppingToken)
        {
            // This is an example of a metric with a single dimension.
            // FormFactor is the name of the dimension.
            Metric computersSold= _telemetryClient.GetMetric("ComputersSold", "FormFactor");

            while (!stoppingToken.IsCancellationRequested)
            {
                // The number of arguments (dimension values)
                // must match the number of dimensions specified while GetMetric.
                // Laptop, Tablet, etc are values for the dimension "FormFactor"
                computersSold.TrackValue(42, "Laptop");
                computersSold.TrackValue(20, "Tablet");
                computersSold.TrackValue(126, "Desktop");


                _logger.LogInformation("Worker running at: {time}", DateTimeOffset.Now);
                await Task.Delay(50, stoppingToken);
            }
        }
執行範例程式碼至少 60 秒會導致將個不同的遙測項目傳送至 Azure。 每個項目都代表三種尺寸之一的彙總。 和之前一樣,您可以在 [記錄 (分析)] 檢視中進一步檢查。

在計量瀏覽器中:

請注意,您無法依新的自訂維度分割計量,或使用計量檢視來檢視自訂維度。

根據預設,不會在 Application Insights 資源中開啟計量瀏覽器中的多維度計量。
啟用多維度計量
若要為 Application Insights 資源啟用多維度計量,請選取 [使用量和估計成本]>[自訂計量]>[啟用自訂計量維度的警示]>[確定]。 如需詳細資訊,請參閱自訂計量維度和預先彙總。
在您進行該變更並傳送新的多維度遙測之後,即可選取 [套用分割]。
備註
只有在入口網站中開啟該功能之後新傳送的計量才會儲存維度。

檢視每個 FormFactor 維度的計量彙總。

在有三個以上的維度時使用 MetricIdentifier
目前支援 10 個維度。 使用三個以上的維度需要使用 MetricIdentifier:
// Add "using Microsoft.ApplicationInsights.Metrics;" to use MetricIdentifier
// MetricIdentifier id = new MetricIdentifier("[metricNamespace]","[metricId],"[dim1]","[dim2]","[dim3]","[dim4]","[dim5]");
MetricIdentifier id = new MetricIdentifier("CustomMetricNamespace","ComputerSold", "FormFactor", "GraphicsCard", "MemorySpeed", "BatteryCapacity", "StorageCapacity");
Metric computersSold = _telemetryClient.GetMetric(id);
computersSold.TrackValue(110,"Laptop", "Nvidia", "DDR4", "39Wh", "1TB");
自訂計量設定
如果您想要更改計量設定,就必須在計量進行初始化的位置執行更改。
特殊維度名稱
計量不會使用用來存取這些計量的 TelemetryClient 之中的遙測內容。 使用 MetricDimensionNames 類別中做為常數的特殊維度名稱是這項限制的最佳因應措施。
下列 Special Operation Request Size 計量所傳送的計量彙總不會將 Context.Operation.Name 設定為 Special Operation。
TrackMetric() 方法或其他任何 TrackXXX() 方法會將 OperationName 正確設定為 Special Operation。
        //...
        TelemetryClient specialClient;
        private static int GetCurrentRequestSize()
        {
            // Do stuff
            return 1100;
        }
        int requestSize = GetCurrentRequestSize()

        protected override async Task ExecuteAsync(CancellationToken stoppingToken)
        {
            while (!stoppingToken.IsCancellationRequested)
            {
                //...
                specialClient.Context.Operation.Name = "Special Operation";
                specialClient.GetMetric("Special Operation Request Size").TrackValue(requestSize);
                //...
            }

        }
在此情況下,請使用 MetricDimensionNames 類別中所列的特殊維度名稱來指定 TelemetryContext 值。
例如,在將下一個陳述式所產生的計量彙總傳送到 Application Insights 雲端端點時,其中的 Context.Operation.Name 資料欄位會設定為 Special Operation:
_telemetryClient.GetMetric("Request Size", MetricDimensionNames.TelemetryContext.Operation.Name).TrackValue(requestSize, "Special Operation");
此特殊維度的值會複製到 TelemetryContext,而且不會當做正常維度使用。 如果您想要讓作業維度保持正常計量探索,則必須基於該目的建立個別維度:
_telemetryClient.GetMetric("Request Size", "Operation Name", MetricDimensionNames.TelemetryContext.Operation.Name).TrackValue(requestSize, "Special Operation", "Special Operation");
維度和時間序列上限
若要防止遙測子系統意外使用您的資源,您可以控制每個計量的資料數列數目上限。 預設限制為每個計量不超過 1000 個資料數列總數,而且每個維度不超過 100 個不同值。
這很重要
請對維度使用低基數值,以避免節流。
在維度和時間序列上限的內容中,我們使用 Metric.TrackValue(..) 來確保會觀察到限制。 如果已達到限制,Metric.TrackValue(..) 會傳回 False 且不會追蹤值。 否則,它會傳回 True。 如果計量的資料源自使用者輸入,此行為將有其效用。
MetricConfiguration 建構函式採用一些選項,說明如何在個別計量內管理不同數列,以及實作 IMetricSeriesConfiguration 的類別物件,以指定計量每個個別數列的彙總行為:
var metConfig = new MetricConfiguration(seriesCountLimit: 100, valuesPerDimensionLimit:2,
                new MetricSeriesConfigurationForMeasurement(restrictToUInt32Values: false));

Metric computersSold = _telemetryClient.GetMetric("ComputersSold", "Dimension1", "Dimension2", metConfig);

// Start tracking.
computersSold.TrackValue(100, "Dim1Value1", "Dim2Value1");
computersSold.TrackValue(100, "Dim1Value1", "Dim2Value2");

// The following call gives 3rd unique value for dimension2, which is above the limit of 2.
computersSold.TrackValue(100, "Dim1Value1", "Dim2Value3");
// The above call doesn't track the metric, and returns false.
-
seriesCountLimit是計量可包含的資料時間序列數目上限。 達到此限制時,對TrackValue()的呼叫通常會導致新序列傳回false。 -
valuesPerDimensionLimit會以類似方式來限制每個維度的相異值數目。 -
restrictToUInt32Values會判斷是否應該追蹤非負整數值。
以下範例說明如何傳送訊息,以了解是否已超過上限限制:
if (! computersSold.TrackValue(100, "Dim1Value1", "Dim2Value3"))
{
// Add "using Microsoft.ApplicationInsights.DataContract;" to use SeverityLevel.Error
_telemetryClient.TrackTrace("Metric value not tracked as value of one of the dimension exceeded the cap. Revisit the dimensions to ensure they are within the limits",
SeverityLevel.Error);
}
自訂作業追蹤
Application Insights SDK 會自動追蹤相依服務的連入 HTTP 要求和呼叫,例如 HTTP 要求和 SQL 查詢。 追蹤和相互關聯要求與相依性,可讓您深入了解橫跨所有微服務 (合併此應用程式) 的整體應用程式回應能力和可靠性。
有一類應用程式模式無法以一般方式支援。 適當監視這類模式時,需要進行手動程式碼檢測。 本節涵蓋一些可能需要手動儀器化的模式,例如自訂佇列處理和運行長時間的背景任務。
此節提供有關如何使用 Application Insights SDK 追蹤自訂作業的指導。
概觀
作業是應用程式執行的邏輯部分。 它具有名稱、開始時間、持續時間、結果和執行的內容,例如使用者名稱、屬性和結果。 如果作業 A 是由作業 B 起始,則作業 B 設為 A 的父代。作業只能有一個父代,但是可以有多個子系作業。 如需有關作業和遙測相互關聯的詳細資訊,請參閱 Application Insights 遙測相互關聯。
在 Application Insights.NET SDK 中,作業是由抽象類別 OperationTelemetry 及其子系 RequestTelemetry 和 DependencyTelemetry 描述。
傳入作業追蹤
Application Insights Wb SDK 會針對在 IIS 管線中執行的 ASP.NET 應用程式和所有的 ASP.NET Core 應用程式,自動收集 HTTP 要求。 其他平台和架構有社群支援的解決方案。 如果有任何標準或社群支援的解決方案不支援應用程式,您可以用手動方式進行檢測。
接收佇列中項目的背景工作是另一個需要自訂追蹤的範例。 對於某些佇列,將訊息新增至此佇列的呼叫會作為相依性追蹤。 不會自動收集描述訊息處理的高階作業。
我們來看看追蹤這類作業的方式。
在較高的層級中,工作是建立 RequestTelemetry 並且設定已知的屬性。 作業完成之後,您會追蹤遙測。 下列範例示範此工作。
Owin 自我裝載應用程式中的 HTTP 要求
在此範例中,追蹤內容會根據相互關聯的 HTTP 通訊協定傳播。 您應該預期會收到該處所述的標題。
展開以檢視程式碼
public class ApplicationInsightsMiddleware : OwinMiddleware
{
    // You may create a new TelemetryConfiguration instance, reuse one you already have,
    // or fetch the instance created by Application Insights SDK.
    private readonly TelemetryConfiguration telemetryConfiguration = TelemetryConfiguration.CreateDefault();
    private readonly TelemetryClient telemetryClient = new TelemetryClient(telemetryConfiguration);

    public ApplicationInsightsMiddleware(OwinMiddleware next) : base(next) {}

    public override async Task Invoke(IOwinContext context)
    {
        // Let's create and start RequestTelemetry.
        var requestTelemetry = new RequestTelemetry
        {
            Name = $"{context.Request.Method} {context.Request.Uri.GetLeftPart(UriPartial.Path)}"
        };

        // If there is a Request-Id received from the upstream service, set the telemetry context accordingly.
        if (context.Request.Headers.ContainsKey("Request-Id"))
        {
            var requestId = context.Request.Headers.Get("Request-Id");
            // Get the operation ID from the Request-Id (if you follow the HTTP Protocol for Correlation).
            requestTelemetry.Context.Operation.Id = GetOperationId(requestId);
            requestTelemetry.Context.Operation.ParentId = requestId;
        }

        // StartOperation is a helper method that allows correlation of
        // current operations with nested operations/telemetry
        // and initializes start time and duration on telemetry items.
        var operation = telemetryClient.StartOperation(requestTelemetry);

        // Process the request.
        try
        {
            await Next.Invoke(context);
        }
        catch (Exception e)
        {
            requestTelemetry.Success = false;
            requestTelemetry.ResponseCode;
            telemetryClient.TrackException(e);
            throw;
        }
        finally
        {
            // Update status code and success as appropriate.
            if (context.Response != null)
            {
                requestTelemetry.ResponseCode = context.Response.StatusCode.ToString();
                requestTelemetry.Success = context.Response.StatusCode >= 200 && context.Response.StatusCode <= 299;
            }
            else
            {
                requestTelemetry.Success = false;
            }

            // Now it's time to stop the operation (and track telemetry).
            telemetryClient.StopOperation(operation);
        }
    }

    public static string GetOperationId(string id)
    {
        // Returns the root ID from the '|' to the first '.' if any.
        int rootEnd = id.IndexOf('.');
        if (rootEnd < 0)
            rootEnd = id.Length;

        int rootStart = id[0] == '|' ? 1 : 0;
        return id.Substring(rootStart, rootEnd - rootStart);
    }
}
相互關聯的 HTTP 通訊協定也會宣告 Correlation-Context 標題。 為了簡單起見,其已在此省略。
佇列檢測
W3C 追蹤內容 (英文) 和適用於相互關聯的 HTTP 通訊協定 (英文) 都可以透過 HTTP 要求來傳遞相互關聯詳細資料,但每個佇列通訊協定都必須定義相同的詳細資料如何透過訊息佇列傳遞。 某些佇列通訊協定 (例如 AMQP) 允許傳遞更多中繼資料。 其他通訊協定 (例如 Azure 儲存體佇列) 需要將內容編碼至訊息承載。
備註
佇列尚不支援跨元件追蹤。
使用 HTTP 時,如果您的生產者和取用者將遙測傳送到不同的 Application Insights 資源,交易診斷體驗和應用程式對應會顯示交易並進行端對端對應。 對於佇列,尚不支援此功能。
服務匯流排佇列
如需追蹤資訊,請參閱透過 Azure 服務匯流排傳訊的分散式追蹤和相互關聯。
Azure 儲存體佇列
下列範例示範如何追蹤 Azure 儲存體佇列作業,並且讓產生者、取用者與 Azure 儲存體之間的遙測相互關聯。
儲存體佇列有 HTTP API。 HTTP 要求的 Application Insights 相依性收集器會追蹤對佇列的所有呼叫。 預設會在 ASP.NET 和 ASP.NET Core 應用程式上加以設定。 使用其他類型的應用程式時,請參閱主控台應用程式文件。
您可能也想要相互關聯 Application Insights 作業識別碼與儲存體要求識別碼。 如需如何設定及取得儲存體要求用戶端和伺服器要求識別碼的詳細資訊,請參閱監視、診斷 Azure 儲存體及進行移難排解。
加入佇列
因為 Azure 儲存體佇列支援 HTTP API,Application Insights 會自動追蹤所有作業與佇列。 在許多情況下,此檢測應該就足夠了。 若要讓取用者端追蹤與生產者追蹤相互關聯,您必須傳遞一些相互關聯內容,類似於我們在「適用於相互關聯的 HTTP 通訊協定」中的作業方式。
這個範例顯示如何追蹤 Enqueue 作業。 您可以:
-
相互關聯重試 (如果有的話):全部都有一個通用父代,也就是
Enqueue作業。 否則會作為連入要求的子系追蹤。 如果佇列有多個邏輯要求,可能難以找到導致重試的呼叫。 - 相互關聯儲存體記錄 (必要時):與 Application Insights 遙測相互關聯。
Enqueue 作業是父作業的子系。 其中一個範例是傳入的 HTTP 要求。 HTTP 相依性呼叫是 Enqueue 作業的子系,以及連入要求的孫系。
public async Task Enqueue(CloudQueue queue, string message)
{
    var operation = telemetryClient.StartOperation<DependencyTelemetry>("enqueue " + queue.Name);
    operation.Telemetry.Type = "Azure queue";
    operation.Telemetry.Data = "Enqueue " + queue.Name;

    // MessagePayload represents your custom message and also serializes correlation identifiers into payload.
    // For example, if you choose to pass payload serialized to JSON, it might look like
    // {'RootId' : 'some-id', 'ParentId' : '|some-id.1.2.3.', 'message' : 'your message to process'}
    var jsonPayload = JsonConvert.SerializeObject(new MessagePayload
    {
        RootId = operation.Telemetry.Context.Operation.Id,
        ParentId = operation.Telemetry.Id,
        Payload = message
    });

    CloudQueueMessage queueMessage = new CloudQueueMessage(jsonPayload);

    // Add operation.Telemetry.Id to the OperationContext to correlate Storage logs and Application Insights telemetry.
    OperationContext context = new OperationContext { ClientRequestID = operation.Telemetry.Id};

    try
    {
        await queue.AddMessageAsync(queueMessage, null, null, new QueueRequestOptions(), context);
    }
    catch (StorageException e)
    {
        operation.Telemetry.Properties.Add("AzureServiceRequestID", e.RequestInformation.ServiceRequestID);
        operation.Telemetry.Success = false;
        operation.Telemetry.ResultCode = e.RequestInformation.HttpStatusCode.ToString();
        telemetryClient.TrackException(e);
    }
    finally
    {
        // Update status code and success as appropriate.
        telemetryClient.StopOperation(operation);
    }
}
如果您因為其他原因,而想要減少您應用程式回報的遙測資料量,或不想追蹤 Enqueue 作業,您可以直接使用 Activity API:
- 建立 (和啟動) 新的
Activity,而不是啟動 Application Insights 作業。 除了作業名稱之外,您 不需要 指派任何屬性。 - 將
yourActivity.Id序列化成為訊息承載,而不是operation.Telemetry.Id。 您也可以使用Activity.Current.Id。
清除佇列
類似於 Enqueue,Application Insights 會自動追蹤儲存體佇列的實際 HTTP 要求。 我們會假設 Enqueue 作業發生於父代內容,例如連入要求內容。 Application Insights SDK 會自動將此類作業 (及其 HTTP 部分) 與相同範圍中的父代要求和回報的其他遙測相互關聯。
Dequeue 作業有些麻煩。 Application Insights SDK 會自動追蹤 HTTP 要求。 不過,其在剖析訊息之前並無法知道相互關聯內容。 您無法透過對 HTTP 要求進行相互關聯來獲得其餘遙測的訊息,尤其是在收到超過一則訊息的情況下。
public async Task<MessagePayload> Dequeue(CloudQueue queue)
{
    var operation = telemetryClient.StartOperation<DependencyTelemetry>("dequeue " + queue.Name);
    operation.Telemetry.Type = "Azure queue";
    operation.Telemetry.Data = "Dequeue " + queue.Name;

    try
    {
        var message = await queue.GetMessageAsync();
    }
    catch (StorageException e)
    {
        operation.telemetry.Properties.Add("AzureServiceRequestID", e.RequestInformation.ServiceRequestID);
        operation.telemetry.Success = false;
        operation.telemetry.ResultCode = e.RequestInformation.HttpStatusCode.ToString();
        telemetryClient.TrackException(e);
    }
    finally
    {
        // Update status code and success as appropriate.
        telemetryClient.StopOperation(operation);
    }

    return null;
}
流程
在下列範例中,追蹤連入訊息的方式類似於追蹤連入 HTTP 要求的方式:
public async Task Process(MessagePayload message)
{
    // After the message is dequeued from the queue, create RequestTelemetry to track its processing.
    RequestTelemetry requestTelemetry = new RequestTelemetry { Name = "process " + queueName };

    // It might also make sense to get the name from the message.
    requestTelemetry.Context.Operation.Id = message.RootId;
    requestTelemetry.Context.Operation.ParentId = message.ParentId;

    var operation = telemetryClient.StartOperation(requestTelemetry);

    try
    {
        await ProcessMessage();
    }
    catch (Exception e)
    {
        telemetryClient.TrackException(e);
        throw;
    }
    finally
    {
        // Update status code and success as appropriate.
        telemetryClient.StopOperation(operation);
    }
}
同樣地,可能會檢測其他佇列作業。 預覽 (Peek) 作業應以類似清除佇列作業的方式進行檢測。 不一定要檢測佇列管理作業。 Application Insights 會追蹤 HTTP 這類作業,這在大多數情況下已足夠。
檢測訊息刪除時,請務必設定作業 (相互關聯) 識別碼。 或者,您可使用 Activity API。 您就不需要在遙測項目上設定作業識別碼,因為 Application Insights SDK 會為您設定:
- 取得佇列中的項目後,建立新的
Activity。 - 使用
Activity.SetParentId(message.ParentId)讓取用者和產生者記錄相互關聯。 - 啟動
Activity。 - 使用
Start/StopOperation協助程式追蹤清除佇列、處理和刪除作業。 從相同的非同步控制流程 (執行內容) 執行此作業。 如此一來,這些作業就會正確地相互關聯。 - 停止
Activity。 - 使用
Start/StopOperation或手動呼叫Track遙測。
相依性類型
Application Insights 使用相依性類型來自定 UI 體驗。 針對佇列,其會辨識下列類型的 DependencyTelemetry,以改善交易診斷體驗:
-
適用於 Azure 儲存體佇列的
Azure queue -
Azure 事件中樞的
Azure Event Hubs -
Azure 服務匯流排的
Azure Service Bus
批次處理
有些佇列中,您可以使用一個要求清除佇列多個訊息。 處理這類訊息可能是獨立的,並且屬於不同的邏輯作業。 無法將 Dequeue 作業與正在處理的特定訊息相互關聯。
每個訊息應該在自己的非同步控制流程中處理。 如需詳細資訊,請參閱連出相依性追蹤一節。
長時間執行的背景工作
有些應用程式可能會應使用者要求,啟動長時間執行的作業。 就追蹤/檢測觀點而言,這與要求或相依性檢測並無不同:
async Task BackgroundTask()
{
    var operation = telemetryClient.StartOperation<DependencyTelemetry>(taskName);
    operation.Telemetry.Type = "Background";
    try
    {
        int progress = 0;
        while (progress < 100)
        {
            // Process the task.
            telemetryClient.TrackTrace($"done {progress++}%");
        }
        // Update status code and success as appropriate.
    }
    catch (Exception e)
    {
        telemetryClient.TrackException(e);
        // Update status code and success as appropriate.
        throw;
    }
    finally
    {
        telemetryClient.StopOperation(operation);
    }
}
在此範例中,telemetryClient.StartOperation 會建立 DependencyTelemetry 並填滿相互關聯內容。 假設您有一項父代作業,由排程作業的連入要求所建立。 只要 BackgroundTask 在與連入要求相同的非同步控制流程中啟動,它就會與該父代作業相互關聯。
BackgroundTask 和所有巢狀遙測項目將會自動與造成它的要求相互關聯,即使在要求結束後亦然。
從沒有任何相關聯作業 (Activity) 的背景執行緒啟動工作時,BackgroundTask 沒有任何父代。 不過,它可以有巢狀作業。 工作回報的所有遙測項目會與在 DependencyTelemetry 中建立的 BackgroundTask 相互關聯。
連出相依性追蹤
您可以追蹤自己的相依性種類或 Application Insights 不支援的作業。
服務匯流排佇列或儲存體佇列中的 Enqueue 方法可作為這類自訂追蹤的範例。
自訂相依性追蹤的一般方法如下:
- 呼叫
TelemetryClient.StartOperation(延伸模組) 方法,其能填滿相互關聯所需的DependencyTelemetry屬性及一些其他屬性 (例如開始、時間戳記及持續時間)。 - 在
DependencyTelemetry上設定其他自訂屬性,例如名稱與您需要的任何其他內容。 - 進行相依性呼叫並且等候。
- 完成時使用
StopOperation停止作業。 - 處理例外狀況。
public async Task RunMyTaskAsync()
{
    using (var operation = telemetryClient.StartOperation<DependencyTelemetry>("task 1"))
    {
        try
        {
            var myTask = await StartMyTaskAsync();
            // Update status code and success as appropriate.
        }
        catch(...)
        {
            // Update status code and success as appropriate.
        }
    }
}
處置作業會導致作業停止,因此您可以考慮這麼做,而不是呼叫 StopOperation。
警告
在某些情況下,未處理的例外狀況可能會防止呼叫 finally,因此可能不會追蹤作業。
平行的作業處理和追蹤
呼叫 StopOperation 只會停止已啟動的作業。 如果目前執行中作業不符合您想要停止的作業,則 StopOperation 不會有任何動作。 如果您以平行方式在相同的執行內容中啟動多個作業,便可能會發生這種情形。
var firstOperation = telemetryClient.StartOperation<DependencyTelemetry>("task 1");
var firstTask = RunMyTaskAsync();

var secondOperation = telemetryClient.StartOperation<DependencyTelemetry>("task 2");
var secondTask = RunMyTaskAsync();

await firstTask;

// FAILURE!!! This will do nothing and will not report telemetry for the first operation
// as currently secondOperation is active.
telemetryClient.StopOperation(firstOperation);

await secondTask;
請務必一律以相同的StartOperation方法來呼叫 並處理作業,以隔離平行執行的作業。 如果作業是同步的 (或不是非同步的),請包裝處理序並使用 Task.Run 加以追蹤。
public void RunMyTask(string name)
{
    using (var operation = telemetryClient.StartOperation<DependencyTelemetry>(name))
    {
        Process();
        // Update status code and success as appropriate.
    }
}

public async Task RunAllTasks()
{
    var task1 = Task.Run(() => RunMyTask("task 1"));
    var task2 = Task.Run(() => RunMyTask("task 2"));

    await Task.WhenAll(task1, task2);
}
ApplicationInsights 作業與 System.Diagnostics.Activity 之間的比較
System.Diagnostics.Activity 代表分散式追蹤內容,並由架構和程式庫用於建立和散佈程序內外的內容,並使遙測項目相互關聯。
Activity 能與 System.Diagnostics.DiagnosticSource 搭配使用,作為架構/程式庫之間的通知機制,以通知感興趣的事件,例如傳入或傳出要求及例外狀況。
活動是 Application Insights 中的最上層功能。 自動相依性和要求收集皆高度依賴活動及 DiagnosticSource 事件。 如果您在應用程式中建立 Activity,其並不會連帶建立 Application Insights 遙測。 Application Insights 必須接收 DiagnosticSource 事件,並知道事件名稱和承載,才能轉譯 Activity 成遙測。
每個 Application Insights 作業 (要求或相依性) 皆涉及 Activity。 呼叫 StartOperation 時,其會在下方建立 Activity。
建議使用 StartOperation 方式來手動追蹤要求或相依性遙測,並確定所有內容都相互關聯。
Counters
Application Insights 支援效能計數器和事件計數器。 本指南提供這兩者的概觀,包含用途、設定,以及在 .NET 應用程式中的使用方式。
效能計數器 內建於 Windows 作業系統,並提供預先定義的計量,例如 CPU 使用量、記憶體使用量和磁碟活動。 這些計數器非常適合用來監視標準效能計量,且只需最少設定。 它們有助於追蹤資源使用率或疑難排解以 Windows 為基礎應用程式中的系統層級瓶頸,但不支援自訂的應用程式特定計量。
事件計數器可跨多平台運作,包括 Windows、Linux 和 macOS。 它們可讓開發人員定義並監視輕量型、可自訂的應用程式特定計量,進而提供比效能計數器更高的彈性。 當系統計量不足,或跨平台應用程式需要更詳細的遙測時,事件計數器特別有用。 它們需要明確的實作與設定,因而讓設定更為費工。
效能計數器
Windows 提供各種效能計數器,例如用來收集處理器、記憶體和磁碟使用量統計資料的計數器。 您也可以定義自己的效能計數器。
如果您的應用程式是在內部部署主機或具備系統管理存取權的虛擬機器上,以 Internet Information Server (IIS) 執行,它就支援效能計數器收集。 以 Azure Web Apps 身分執行的應用程式無法直接存取效能計數器,但 Application Insights 會收集部分可用的計數器。
小提示
與其他計量一樣,您可以設定警示,以便在計數器超出指定限制時發出警告。 若要設定警示,請開啟 [警示] 窗格,然後選取 [新增警示]。
先決條件
將其新增至效能監視器使用者群組,授與應用程式集區服務帳戶監視效能計數器的權限。
net localgroup "Performance Monitor Users" /add "IIS APPPOOL\NameOfYourPool"
檢視計數器
[計量] 窗格會顯示一組預設的效能計數器。
ASP.NET
ASP.NET Web 應用程式的預設計數器:
- % 處理\處理器時間
- % 處理程序\處理器時間正規化
- 記憶體\可用位元組
- ASP.NET 要求/秒
- 擲回的 .NET Common Language Runtime (CLR) 例外狀況 / 秒
- ASP.NET ApplicationsRequest 執行時間
- 處理序\私用位元組
- Process\IO 資料位元組/秒
- 應用程式佇列中的 ASP.NET 應用程式\要求
- 處理器(_Total)\% 處理器使用時間
ASP.NET Core
ASP.NET Core Web 應用程式的預設計數器:
- % 處理\處理器時間
- % 處理程序\處理器時間正規化
- 記憶體\可用位元組
- 處理序\私用位元組
- Process\IO 資料位元組/秒
- 處理器(_Total)\% 處理器使用時間
備註
ASP.NET Core 效能計數器的支援受限制:
- 如果應用程式是在 Azure Web Apps (Windows) 中執行,SDK 版本2.4.1 和以後版本會收集效能計數器。
- 如果應用程式是在 Windows 中執行,而且目標是
NETSTANDARD2.0或以後版本,SDK 版本2.7.1 和更新版本會收集效能計數器。 - 對於以 .NET Framework 為目標的應用程式,所有版本的 SDK 都支援效能計數器。
- SDK 版本 2.8.0 和更新版本支援 Linux 中的 CPU/記憶體計數器。 Linux 不支援其他計數器。 若要在 Linux (和其他非 Windows 環境) 中取得系統計數器,請使用事件計數器。
新增計數器
如果計量清單中未包含您想要的效能計數器,您可以新增該計數器。
ASP.NET
選項 1:ApplicationInsights.config 中的設定
在本機伺服器上使用以下 PowerShell 命令,以找出伺服器中可用的計數器:
Get-Counter -ListSet *如需詳細資訊,請參閱
Get-Counter。開啟
ApplicationInsights.config。如果您在開發期間將 Application Insights 新增至應用程式:
- 在專案中編輯
ApplicationInsights.config。 - 將其重新部署至伺服器。
- 在專案中編輯
編輯效能收集器指示詞:
    <Add Type="Microsoft.ApplicationInsights.Extensibility.PerfCounterCollector.PerformanceCollectorModule, Microsoft.AI.PerfCounterCollector">
      <Counters>
        <Add PerformanceCounter="\Objects\Processes"/>
        <Add PerformanceCounter="\Sales(photo)\# Items Sold" ReportAs="Photo sales"/>
      </Counters>
    </Add>
您可擷取標準計數器和您自己實作的計數器。
\Objects\Processes 是所有 Windows 系統上都提供的一個標準計數器範例。
\Sales(photo)\# Items Sold 是可能在 Web 服務中實作的自訂計數器範例。
格式為 \Category(instance)\Counter,若是沒有執行個體的類別,則為 \Category\Counter。
不符合 ReportAs 的計數器名稱需要 [a-zA-Z()/-_ \.]+ 參數。
如果您指定了執行個體,它就會成為已報告計量的維度 CounterInstanceName。
選項 2:程式碼中的設定
請參閱下列各節。
ASP.NET Core
在 PerformanceCollectorModule 中的 WebApplication.CreateBuilder() 方法後面設定 Program.cs:
using Microsoft.ApplicationInsights.Extensibility.PerfCounterCollector;

var builder = WebApplication.CreateBuilder(args);

builder.Services.AddApplicationInsightsTelemetry();

// The following configures PerformanceCollectorModule.

builder.Services.ConfigureTelemetryModule<PerformanceCollectorModule>((module, o) =>
    {
        // The application process name could be "dotnet" for ASP.NET Core self-hosted applications.
        module.Counters.Add(new PerformanceCounterCollectionRequest(@"\Process([replace-with-application-process-name])\Page Faults/sec", "DotnetPageFaultsPerfSec"));
    });

var app = builder.Build();
在程式碼中收集 ASP.NET Web 應用程式或 .NET/.NET Core 主控台應用程式的效能計數器
若要收集系統效能計數器並將其傳送至 Application Insights,可以採用下列程式碼片段:
    var perfCollectorModule = new PerformanceCollectorModule();
    perfCollectorModule.Counters.Add(new PerformanceCounterCollectionRequest(
      @"\Process([replace-with-application-process-name])\Page Faults/sec", "PageFaultsPerfSec"));
    perfCollectorModule.Initialize(TelemetryConfiguration.Active);
或者,您可以透過您建立的自訂計量執行相同的作業:
    var perfCollectorModule = new PerformanceCollectorModule();
    perfCollectorModule.Counters.Add(new PerformanceCounterCollectionRequest(
      @"\Sales(photo)\# Items Sold", "Photo sales"));
    perfCollectorModule.Initialize(TelemetryConfiguration.Active);
在 Azure App Service 上於 Azure Web Apps 和 Windows 容器中執行的應用程式效能計數器
部署至 Azure Web Apps 的 ASP.NET 和 ASP.NET Core 應用程式都是在特殊的沙箱環境中執行。 部署至 Azure App 服務的應用程式可以利用 Windows 容器,或裝載於沙箱環境中。 如果應用程式部署在 Windows 容器中,容器映像中會提供所有標準效能計數器。
此沙箱環境不允許直接存取系統效能計數器。 不過,有限的計數器子集會公開為環境變數,如公開為環境變數的效能計數器中所述。 只能在此環境中取得計數器的子集。 如需完整清單,請參閱公開為環境變數的效能計數器。
適用於 ASP.NET 和 ASP.NET Core 的 Application Insights SDK 會偵測程式碼是否已部署至 Web 應用程式或非 Windows 容器。 偵測會決定其是否在沙箱環境中收集效能計數器,或在 Windows 容器或虛擬機器上裝載時使用標準收集機制。
效能計數器的 Log Analytics 查詢
您可以在記錄分析中搜尋並顯示效能計數器報表。
PerformanceCounters 結構描述會公開每個效能計數器的 category、counter 名稱和 instance 名稱。 在每個應用程式的遙測中,您只會看到該應用程式的計數器。 例如,若要查看哪些計數器可用︰
performanceCounters | summarize count(), avg(value) by category, instance, counter
這裡的 Instance 是指效能計數器執行個體,而不是角色或伺服器機器執行個體。 效能計數器執行個體名稱一般會將計數器分段,例如依處理序或應用程式名稱的處理器時間。
若要取得可用記憶體在最近一段時間的圖表︰
performanceCounters | where counter == "Available Bytes" | summarize avg(value), min(value) by bin(timestamp, 1h) | render timechart
與其他遙測一樣,performanceCounters 也有 cloud_RoleInstance 資料行可指出應用程式執行所在主機伺服器執行個體的身分識別。 例如,若要比較不同機器上的應用程式效能︰
performanceCounters | where counter == "% Processor Time" and instance == "SendMetrics" | summarize avg(value) by cloud_RoleInstance, bin(timestamp, 1d)
效能計數器常見問題
若要檢閱常見問題 (FAQ),請參閱效能計數器常見問題。
事件計數器
EventCounter 是 .NET/.NET Core 機制,用來發佈和取用計數器或統計資料。 所有作業系統平台 (Windows、Linux 和 macOS) 都支援 EventCounter。 它可以視為僅在 Windows 系統中支援的 PerformanceCounters 的跨平臺對等專案。
雖然使用者可以發佈任何自訂事件計數器以符合其需求,但 .NET 預設會發佈一組這些計數器。 此文件會逐步解說在 Azure Application Insights 中收集及檢視事件計數器 (系統定義或使用者定義) 所需的步驟。
小提示
與其他計量一樣,您可以設定警示,以便在計數器超出指定限制時發出警告。 若要設定警示,請開啟 [警示] 窗格,然後選取 [新增警示]。
使用 Application Insights 收集 EventCounter
Application Insights 支援以其 EventCounters 收集 EventCounterCollectionModule,這是新發行 NuGet 套件 Microsoft.ApplicationInsights.EventCounterCollector 的一部分。
使用 EventCounterCollectionModule 或 WorkerService 時,會自動啟用 。
EventCounterCollectionModule 會以 60 秒的不可設定的收集頻率收集計數器。 收集 EventCounter 並不需要特殊的權限。 針對 ASP.NET Core 應用程式,您也想要新增 Microsoft.ApplicationInsights.AspNetCore 套件。
dotnet add package Microsoft.ApplicationInsights.EventCounterCollector
dotnet add package Microsoft.ApplicationInsights.AspNetCore
收集的預設計數器
從 2.15.0 版 AspNetCore SDK 或 WorkerService SDK 開始,預設不會收集任何計數器。 模組本身已啟用,因此使用者可以新增所需的計數器來收集這些計數器。
若要取得 .NET 執行時間所發佈的已知計數器清單,請參閱可用的計數器文件。
自訂要收集的計數器
下列範例示範如何新增/移除計數器。 使用 AddApplicationInsightsTelemetry() 或 AddApplicationInsightsWorkerService() 啟用 Application Insights 遙測收集之後,就會在應用程式服務設定中完成此自訂。 以下是來自 ASP.NET Core 應用程式的範例程式碼。 如需其他型別的應用程式,請參閱 設定遙測模組。
using Microsoft.ApplicationInsights.Extensibility.EventCounterCollector;
using Microsoft.Extensions.DependencyInjection;

builder.Services.ConfigureTelemetryModule<EventCounterCollectionModule>(
        (module, o) =>
        {
            // Removes all default counters, if any.
            module.Counters.Clear();

            // Adds a user defined counter "MyCounter" from EventSource named "MyEventSource"
            module.Counters.Add(
                new EventCounterCollectionRequest("MyEventSource", "MyCounter"));

            // Adds the system counter "gen-0-size" from "System.Runtime"
            module.Counters.Add(
                new EventCounterCollectionRequest("System.Runtime", "gen-0-size"));
        }
    );
停用 EventCounter 集合模組
可以使用 EventCounterCollectionModule 來停用 ApplicationInsightsServiceOptions。
下列範例使用 ASP.NET Core SDK。
using Microsoft.ApplicationInsights.AspNetCore.Extensions;
using Microsoft.Extensions.DependencyInjection;

var applicationInsightsServiceOptions = new ApplicationInsightsServiceOptions();
applicationInsightsServiceOptions.EnableEventCounterCollectionModule = false;
builder.Services.AddApplicationInsightsTelemetry(applicationInsightsServiceOptions);
類似的方法也可以用於 Worker Service SDK,但命名空間必須改變,如下列範例所示。
using Microsoft.ApplicationInsights.AspNetCore.Extensions;
using Microsoft.Extensions.DependencyInjection;

var applicationInsightsServiceOptions = new ApplicationInsightsServiceOptions();
applicationInsightsServiceOptions.EnableEventCounterCollectionModule = false;
builder.Services.AddApplicationInsightsTelemetry(applicationInsightsServiceOptions);
事件計數器的 Log Analytics 查詢
您可以在 Log Analytics 的 customMetrics 資料表中,搜尋並顯示事件計數器報告。
例如,執行下列查詢以查看已收集哪些計數器並可供查詢:
customMetrics | summarize avg(value) by name
若要取得最近一段時間內特定計數器的圖表 (例如:ThreadPool Completed Work Item Count),請執行下列查詢。
customMetrics
| where name contains "System.Runtime|ThreadPool Completed Work Item Count"
| where timestamp >= ago(1h)
| summarize avg(value) by cloud_RoleInstance, bin(timestamp, 1m)
| render timechart
與其他遙測一樣,customMetrics 也有 cloud_RoleInstance 資料行,可指出應用程式執行所在主機伺服器執行個體的身分識別。 上述查詢會顯示每個執行個體的計數器值,而且可以用來比較不同伺服器執行個體的效能。
事件計數器常見問題
若要檢閱常見問題 (FAQ),請參閱事件計數器常見問題。
快照收集
若要深入了解如何為 ASP.NET 和 ASP.NET Core 應用程式設定快照收集,請參閱在 Azure Service Fabric、Azure 雲端服務和 Azure 虛擬機器中啟用 .NET 應用程式的快照偵錯工具。
處理和篩選遙測數據
本節內容
篩選和預先處理遙測
您可以撰寫程式碼來篩選、修改或增強遙測,然後再從 SDK 傳送出去。 處理包括從標準遙測模組傳送的資料,例如 HTTP 要求收集和相依性收集。
篩選可以先修改或捨棄遙測,再藉由實作
ITelemetryProcessor從 SDK 傳送遙測。 例如,您可以排除機器人發出的請求,以減少遙測數據量。 與取樣不同,您可以完全控制傳送或捨棄的內容,但這會影響所有基於彙總日誌的指標。 視您捨棄項目的方式而定,您也可能會失去在相關項目之間瀏覽的能力。透過實作
ITelemetryInitializer,將屬性新增或修改至從應用程式傳送的任何遙測資料。 例如,您可以新增計算值或版本號碼,以篩選入口網站中的資料。取樣 可減少遙測量量,而不會影響您的統計資料。 它會將相關的資料點放在一起,以便您在診斷問題時可以在它們之間導航。 在入口網站中將乘以總計數,以補償取樣。
備註
SDK API 可用來傳送自訂事件和指標。
篩選
此技術可讓您直接控制遙測資料流程中包含或排除的內容。 篩選可用來卸除遙測項目,使其無法傳送至 Application Insights。 您可以搭配取樣或單獨使用篩選。
若要篩選遙測,您可以撰寫遙測處理器,並將其註冊到 TelemetryConfiguration。 所有遙測都會通過您的處理器。 您可以選擇將其從串流中刪除,或將其提供給鏈中的下一個處理器。 包含來自標準模組的遙測,例如 HTTP 請求收集器和相依性收集器,以及您自己追蹤的遙測。 例如,您可以篩選出來自機器人的請求或成功的依賴呼叫的遙測數據。
ITelemetryProcessor 和 ITelemetryInitializer
遙測處理器和遙測初始化器之間有何差異?
- 其用途有部分重疊。 兩者都可用來新增或修改遙測的屬性,不過建議您使用初始設定式來達到此目的。
- 遙測初始化運算式一律會在遙測處理器之前執行。
- 遙測初始化器可能會多次被呼叫。 依照慣例,他們不會設定任何已設定的屬性。
- 遙測處理器可讓您完全取代或捨棄遙測項目。
- 每個遙測項目都會呼叫所有已註冊的遙測初始程式。 針對遙測處理器,SDK 保證呼叫第一個遙測處理器。 是否呼叫其餘處理器是由先前的遙測處理器所決定。
- 使用遙測初始化器,以更多屬性來擴充遙測,或覆寫現有的屬性。 使用遙測處理器來過濾遙測數據。
新增/修改屬性
使用遙測初始化器來豐富遙測資料或覆寫標準遙測模組設定的屬性。
例如,網頁套件中的 Application Insights 會收集 HTTP 請求的遙測資料。 根據預設,它會將任何回應碼 >=400 的要求標示為失敗。 如果您想要將 400 視為成功,您可以提供一個遙測初始化器來設定成功屬性。
如果您提供遙測初始化器,則每當呼叫任何 Track*() 方法時,都會呼叫它。 此初始化運算式包含 Track() 標準遙測模組所呼叫的方法。 依照慣例,這些模組不會設定初始化運算式已設定的任何屬性。 在呼叫遙測處理器之前會呼叫遙測初始化程式,因此初始化程式所做的任何擴充都對處理器可見。
遙測初始設定式
若要使用其他資訊擴充遙測,或覆寫標準遙測模組所設定的遙測屬性,請使用遙測初始化表達式。
遙測初始設定式設定與遙測的每個項目一起傳送的內容屬性。 您可以撰寫自己的初始化運算式來設定內容屬性。
標準初始設定式都是由 Web 或 WindowsServer NuGet 套件所設定:
| 初始設定式 | Description |
|---|---|
AccountIdTelemetryInitializer |
設定 AccountId 屬性。 |
AuthenticatedUserIdTelemetryInitializer |
將 AuthenticatedUserId 屬性設定為 JavaScript SDK 所設定的值。 |
AzureRoleEnvironmentTelemetryInitializer |
針對所有遙測項目,會使用從 Azure 執行階段環境擷取的資訊來更新 RoleName 內容的 RoleInstance 和 Device 屬性。 |
BuildInfoConfigComponentVersionTelemetryInitializer |
針對所有遙測項目,會使用從 MS Build 產生之 Version 檔案擷取的值來更新 Component 內容的 BuildInfo.config 屬性。 |
ClientIpHeaderTelemetryInitializer |
針對所有遙測項目,會根據要求的 Ip HTTP 標頭來更新 Location 內容的 X-Forwarded-For 屬性。 |
DeviceTelemetryInitializer |
針對所有遙測項目,會更新 Device 內容中的下列屬性:• 將 Type 設定為 PC。• 將 Id 設定為正執行 Web 應用程式的電腦網域名稱。• 將 OemName 設定為使用 WMI 從 Win32_ComputerSystem.Manufacturer 欄位擷取的值。• 將 Model 設定為使用 WMI 從 Win32_ComputerSystem.Model 欄位擷取的值。• 將 NetworkType 設定為從 NetworkInterface 屬性擷取的值。• 將 Language 設定為 CurrentCulture 屬性的名稱。 |
DomainNameRoleInstanceTelemetryInitializer |
針對所有遙測項目,會使用正執行 Web 應用程式的電腦網域名稱來更新 RoleInstance 內容的 Device 屬性。 |
OperationNameTelemetryInitializer |
針對所有遙測項目,會根據 HTTP 方法,以及用來處理要求的 ASP.NET MVC 控制器與動作名稱,來更新 Name 的 RequestTelemetry 屬性與 Name 內容的 Operation 屬性。 |
OperationIdTelemetryInitializer 或 OperationCorrelationTelemetryInitializer |
針對所有在處理要求時所追蹤的遙測項目,會使用自動產生的 Operation.Id 來更新 RequestTelemetry.Id 內容屬性。 |
SessionTelemetryInitializer |
針對所有遙測項目,會使用使用者瀏覽器中執行的 Id JavaScript 檢測程式碼所產生之 Session Cookie 擷取的值,來更新 ai_session 內容的 ApplicationInsights 屬性。 |
SyntheticTelemetryInitializer 或 SyntheticUserAgentTelemetryInitializer |
針對所有在處理來自綜合來源 (例如可用性測試或搜尋引擎 Bot) 的要求時所追蹤的遙測項目,會更新 User、Session 和 Operation 內容屬性。 根據預設,計量瀏覽器不會顯示綜合遙測。<Filters> 會設定要求的識別屬性。 |
UserTelemetryInitializer |
針對所有遙測項目,會使用 Application Insights JavaScript 檢測程式碼在使用者瀏覽器中所產生之 Id Cookie 擷取的值,更新 AcquisitionDate 內容的 User 和 ai_user 屬性。 |
WebTestTelemetryInitializer |
會為來自可用性測試的 HTTP 要求設定使用者識別碼、工作階段識別碼和綜合來源屬性。<Filters> 會設定要求的識別屬性。 |
備註
針對 Azure Service Fabric 中執行的 .NET 應用程式,您可以包括 Microsoft.ApplicationInsights.ServiceFabric NuGet 套件。 此套件所包括的 FabricTelemetryInitializer 屬性會將 Service Fabric 屬性新增至遙測項目。 如需詳細資訊,請參閱 GitHub 頁面了解這個 NuGet 套件所新增之屬性的相關資訊。
新增 ITelemetryInitializer
本部落格 描述一個專案,透過自動向依賴項發送定期 ping 來診斷依賴項問題。
定義初始化運算式
using System;
using Microsoft.ApplicationInsights.Channel;
using Microsoft.ApplicationInsights.DataContracts;
using Microsoft.ApplicationInsights.Extensibility;

namespace MvcWebRole.Telemetry
{
  /*
   * Custom TelemetryInitializer that overrides the default SDK
   * behavior of treating response codes >= 400 as failed requests
   *
   */
    public class MyTelemetryInitializer : ITelemetryInitializer
    {
        public void Initialize(ITelemetry telemetry)
        {
            var requestTelemetry = telemetry as RequestTelemetry;
            // Is this a TrackRequest() ?
            if (requestTelemetry == null) return;
            int code;
            bool parsed = Int32.TryParse(requestTelemetry.ResponseCode, out code);
            if (!parsed) return;
            if (code >= 400 && code < 500)
            {
                // If we set the Success property, the SDK won't change it:
                requestTelemetry.Success = true;

                // Allow us to filter these requests in the portal:
                requestTelemetry.Properties["Overridden400s"] = "true";
            }
            // else leave the SDK to set the Success property
        }
    }
}
載入初始化程序
ASP.NET
選項 1:程式碼中的設定
protected void Application_Start()
{
    // ...
    TelemetryConfiguration.Active.TelemetryInitializers.Add(new MyTelemetryInitializer());
}
選項 2:ApplicationInsights.config 中的設定
<ApplicationInsights>
    <TelemetryInitializers>
    <!-- Fully qualified type name, assembly name: -->
    <Add Type="MvcWebRole.Telemetry.MyTelemetryInitializer, MvcWebRole"/>
    ...
    </TelemetryInitializers>
</ApplicationInsights>
請參閱 此範例的更多內容。
備註
請確定 applicationinsights.config 檔案位於輸出目錄中,並包含任何最近的變更。
ASP.NET Core
使用
ApplicationInsights.config或TelemetryConfiguration.Active新增初始化運算式對於 ASP.NET Core 應用程式來說是無效的。
對於使用 ASP.NET Core 撰寫的應用程式,新增遙測初始化程序是透過將它新增至 DependencyInjection 容器來完成,如下所示。 在 Startup.ConfigureServices 方法中完成這一步驟。
var builder = WebApplication.CreateBuilder(args);

builder.Services.AddSingleton<ITelemetryInitializer, MyCustomTelemetryInitializer>();

var app = builder.Build();
備註
builder.Services.AddSingleton<ITelemetryInitializer, MyCustomTelemetryInitializer>(); 適用於簡單的初始設定式。 除此之外,則需要 builder.Services.AddSingleton(new MyCustomTelemetryInitializer() { fieldName = "myfieldName" });。
移除遙測初始設定式
預設存在遙測初始設定式。 若要移除所有或特定的遙測初始設定式,請在呼叫 AddApplicationInsightsTelemetry(),使用下列範例程式碼。
var builder = WebApplication.CreateBuilder(args);

builder.Services.AddApplicationInsightsTelemetry();

// Remove a specific built-in telemetry initializer
var tiToRemove = builder.Services.FirstOrDefault<ServiceDescriptor>
                    (t => t.ImplementationType == typeof(AspNetCoreEnvironmentTelemetryInitializer));
if (tiToRemove != null)
{
    builder.Services.Remove(tiToRemove);
}

// Remove all initializers
// This requires importing namespace by using Microsoft.Extensions.DependencyInjection.Extensions;
builder.Services.RemoveAll(typeof(ITelemetryInitializer));

var app = builder.Build();
背景工作服務
使用
ApplicationInsights.config或TelemetryConfiguration.Active新增初始設定式對 Worker Service SDK 無效。
對於使用 Worker Service 編寫的應用程式,新增遙測初始設定式的方式是將其加入至 DependencyInjection 容器中,如圖所示。 在 Startup.ConfigureServices 方法中完成這一步驟。
    using Microsoft.ApplicationInsights.Extensibility;

    public void ConfigureServices(IServiceCollection services)
    {
        services.AddSingleton<ITelemetryInitializer, MyCustomTelemetryInitializer>();
        services.AddApplicationInsightsTelemetryWorkerService();
    }
移除遙測初始設定式
遙測初始化器預設為存在。 若要移除所有或特定的遙測初始設定式,請在呼叫 AddApplicationInsightsTelemetryWorkerService(),使用下列範例程式碼。
   public void ConfigureServices(IServiceCollection services)
   {
        services.AddApplicationInsightsTelemetryWorkerService();
        // Remove a specific built-in telemetry initializer.
        var tiToRemove = services.FirstOrDefault<ServiceDescriptor>
                            (t => t.ImplementationType == typeof(AspNetCoreEnvironmentTelemetryInitializer));
        if (tiToRemove != null)
        {
            services.Remove(tiToRemove);
        }

        // Remove all initializers.
        // This requires importing namespace by using Microsoft.Extensions.DependencyInjection.Extensions;
        services.RemoveAll(typeof(ITelemetryInitializer));
   }
範例 ITelemetryInitializers
新增自訂屬性
以下範例的初始化器會將自訂屬性新增至每個被追蹤的遙測資料。
public void Initialize(ITelemetry item)
{
    var itemProperties = item as ISupportProperties;
    if(itemProperties != null && !itemProperties.Properties.ContainsKey("customProp"))
    {
        itemProperties.Properties["customProp"] = "customValue";
    }
}
新增雲端角色名稱和雲端角色執行個體
步驟 1:撰寫自訂 TelemetryInitializer
下列範例初始設定式會將雲端角色名稱設定為每個所追蹤的遙測。
using Microsoft.ApplicationInsights.Channel;
using Microsoft.ApplicationInsights.Extensibility;

namespace CustomInitializer.Telemetry
{
    public class MyTelemetryInitializer : ITelemetryInitializer
    {
        public void Initialize(ITelemetry telemetry)
        {
            if (string.IsNullOrEmpty(telemetry.Context.Cloud.RoleName))
            {
                //set custom role name here
                telemetry.Context.Cloud.RoleName = "Custom RoleName";
                telemetry.Context.Cloud.RoleInstance = "Custom RoleInstance";
            }
        }
    }
}
步驟 2:將初始設定式載入 TelemetryConfiguration
ASP.NET
在 ApplicationInsights.config 檔案中:
    <ApplicationInsights>
      <TelemetryInitializers>
        <!-- Fully qualified type name, assembly name: -->
        <Add Type="CustomInitializer.Telemetry.MyTelemetryInitializer, CustomInitializer"/>
        ...
      </TelemetryInitializers>
    </ApplicationInsights>
ASP.NET Web 應用程式的替代方法是在程式碼中具現化初始化運算式。 下列範例顯示 Global.aspx.cs 檔案中的程式碼:
 using Microsoft.ApplicationInsights.Extensibility;
 using CustomInitializer.Telemetry;

    protected void Application_Start()
    {
        // ...
        TelemetryConfiguration.Active.TelemetryInitializers.Add(new MyTelemetryInitializer());
    }
ASP.NET Core
若要新增執行個體 TelemetryInitializer ,請將其新增至依賴注入容器。 下列範例顯示此方法。 將此程式碼新增至ConfigureServices類別的Startup.cs方法中。
 using Microsoft.ApplicationInsights.Extensibility;
 using CustomInitializer.Telemetry;
 public void ConfigureServices(IServiceCollection services)
{
    services.AddSingleton<ITelemetryInitializer, MyTelemetryInitializer>();
}
控制用於地理位置對應的用戶端 IP 位址
在遙測擷取期間,下列初始設定式範例會設定用於地理位置對應的用戶端 IP,而不是用戶端通訊端 IP 位址。
public void Initialize(ITelemetry telemetry)
{
    var request = telemetry as RequestTelemetry;
    if (request == null) return true;
    request.Context.Location.Ip = "{client ip address}"; // Could utilize System.Web.HttpContext.Current.Request.UserHostAddress;
    return true;
}
遙測處理器
遙測處理器可以在遙測從 SDK 傳送至入口網站之前篩選並修改每個遙測項目。
實作 ITelemetryProcessor
遙測處理器會建構處理鏈結。 當您具現化遙測處理器時,您會取得鏈結中下一個處理器的參考。 當遙測數據點傳遞至進程方法時,它會執行其工作,然後呼叫 (或不呼叫) 鏈結中的下一個遙測處理器。
using Microsoft.ApplicationInsights.Channel;
using Microsoft.ApplicationInsights.Extensibility;
using Microsoft.ApplicationInsights.DataContracts;

public class SuccessfulDependencyFilter : ITelemetryProcessor
{
    private ITelemetryProcessor Next { get; set; }

    // next will point to the next TelemetryProcessor in the chain.
    public SuccessfulDependencyFilter(ITelemetryProcessor next)
    {
        this.Next = next;
    }

    public void Process(ITelemetry item)
    {
        // To filter out an item, return without calling the next processor.
        if (!OKtoSend(item)) { return; }

        this.Next.Process(item);
    }

    // Example: replace with your own criteria.
    private bool OKtoSend (ITelemetry item)
    {
        var dependency = item as DependencyTelemetry;
        if (dependency == null) return true;

        return dependency.Success != true;
    }
}
新增您的處理器
ASP.NET
將此片段插入 ApplicationInsights.config:
<TelemetryProcessors>
    <Add Type="WebApplication9.SuccessfulDependencyFilter, WebApplication9">
    <!-- Set public property -->
    <MyParamFromConfigFile>2-beta</MyParamFromConfigFile>
    </Add>
</TelemetryProcessors>
您可以在類別中提供公開具名屬性,以從 .config 檔案傳遞字串值。
警告
請注意,.config 檔案中的類型名稱和任何屬性名稱與程式碼中的類別和屬性名稱相符。 如果 .config 檔案參考不存在的類型或屬性,SDK 可能會在不發出任何通知的情況下未能傳送遙測資料。
或者,您可以在程式碼中初始化篩選器。 在適當的初始化類別中 (例如,Global.asax.cs 中的 AppStart) 將處理器插入至鏈結中:
備註
下列程式碼範例已過時,但可在此處提供給後代。 請考慮 開始使用 OpenTelemetry 或 移轉至 OpenTelemetry。
var builder = TelemetryConfiguration.Active.DefaultTelemetrySink.TelemetryProcessorChainBuilder;
builder.Use((next) => new SuccessfulDependencyFilter(next));

// If you have more processors:
builder.Use((next) => new AnotherProcessor(next));

builder.Build();
在此之後建立的遙測用戶端會使用您的處理器。
自適性取樣遙測處理器 (自 2.0.0-beta3 起)
此功能預設為啟用。 如果您的應用程式傳送許多遙測,此處理器會移除其中一些遙測。
    <TelemetryProcessors>
        <Add Type="Microsoft.ApplicationInsights.WindowsServer.TelemetryChannel.AdaptiveSamplingTelemetryProcessor, Microsoft.AI.ServerTelemetryChannel">
        <MaxTelemetryItemsPerSecond>5</MaxTelemetryItemsPerSecond>
        </Add>
    </TelemetryProcessors>
參數會提供演算法嘗試要達成的目標。 每個 SDK 執行個體都會獨立運作。 因此,如果您的伺服器是數個機器的叢集,則實際遙測數目會隨之加乘。
深入了解取樣。
固定取樣遙測處理器 (自 2.0.0-beta1 起)
還有一個標準採樣遙測處理器(從 2.0.1 開始):
    <TelemetryProcessors>
        <Add Type="Microsoft.ApplicationInsights.WindowsServer.TelemetryChannel.SamplingTelemetryProcessor, Microsoft.AI.ServerTelemetryChannel">

        <!-- Set a percentage close to 100/N where N is an integer. -->
        <!-- E.g. 50 (=100/2), 33.33 (=100/3), 25 (=100/4), 20, 1 (=100/100), 0.1 (=100/1000) -->
        <SamplingPercentage>10</SamplingPercentage>
        </Add>
    </TelemetryProcessors>
ASP.NET Core
備註
新增處理器使用 ApplicationInsights.config 或 TelemetryConfiguration.Active 對於 ASP.NET Core 應用程式或使用 Microsoft.ApplicationInsights.WorkerService SDK 是無效的。
針對 ASP.NET Core,新增遙測處理器的方式是透過在 AddApplicationInsightsTelemetryProcessor 上使用 IServiceCollection 延伸模組,如下所示。 這個方法是在你的ConfigureServices類別的Startup.cs方法中呼叫的。
var builder = WebApplication.CreateBuilder(args);

// ...
builder.Services.AddApplicationInsightsTelemetry();
builder.Services.AddApplicationInsightsTelemetryProcessor<MyFirstCustomTelemetryProcessor>();

// If you have more processors:
builder.Services.AddApplicationInsightsTelemetryProcessor<MySecondCustomTelemetryProcessor>();

var app = builder.Build();
若要在 ASP.NET Core 中註冊需要參數的遙測處理器,請建立實作 ITelemetryProcessorFactory 的自訂類別。 在 Create 方法中使用所需參數呼叫建構函式,然後使用 AddSingleton<ITelemetryProcessorFactory、MyTelemetryProcessorFactory>()。
背景工作服務
備註
新增處理器使用 ApplicationInsights.config 或 TelemetryConfiguration.Active 對於 ASP.NET Core 應用程式或使用 Microsoft.ApplicationInsights.WorkerService SDK 是無效的。
針對 Worker Service,新增遙測處理器的方式是透過在 AddApplicationInsightsTelemetryProcessor 上使用 IServiceCollection 延伸模組,如下所示。 這個方法是在你的ConfigureServices類別的Startup.cs方法中呼叫的。
    public void ConfigureServices(IServiceCollection services)
    {
        services.AddApplicationInsightsTelemetryWorkerService();
        services.AddApplicationInsightsTelemetryProcessor<MyFirstCustomTelemetryProcessor>();
        // If you have more processors:
        services.AddApplicationInsightsTelemetryProcessor<MySecondCustomTelemetryProcessor>();
    }
範例篩選器
綜合請求
過濾掉機器人和 Web 測試。 雖然 Metrics Explorer 可讓您選擇篩選掉合成來源,但此選項會在 SDK 本身篩選這些來源,以減少流量和資料擷取的大小。
public void Process(ITelemetry item)
{
    if (!string.IsNullOrEmpty(item.Context.Operation.SyntheticSource)) {return;}

    // Send everything else:
    this.Next.Process(item);
}
驗證失敗
過濾掉具有「401」回應的請求。
public void Process(ITelemetry item)
{
    var request = item as RequestTelemetry;

    if (request != null &&
    request.ResponseCode.Equals("401", StringComparison.OrdinalIgnoreCase))
    {
        // To filter out an item, return without calling the next processor.
        return;
    }

    // Send everything else
    this.Next.Process(item);
}
篩除快速遠端相依性呼叫
如果您只想診斷慢速呼叫,請過濾掉快速呼叫。
備註
此篩選會扭曲您在入口網站上看到的統計資料。
public void Process(ITelemetry item)
{
    var request = item as DependencyTelemetry;

    if (request != null && request.Duration.TotalMilliseconds < 100)
    {
        return;
    }
    this.Next.Process(item);
}
取樣
若要了解如何設定 ASP.NET 和 ASP.NET Core 應用程式的取樣,請參閱 Application Insights 中的取樣。
背景工作服務
適用於背景工作角色服務的 Application Insights SDK 支援固定速率取樣和調適型取樣。 預設會啟用調適性取樣。 在 EnableAdaptiveSampling 中使用 選項可以停用取樣。
若要設定其他取樣設定,您可以使用下列範例:
using Microsoft.ApplicationInsights.AspNetCore.Extensions;
using Microsoft.ApplicationInsights.Extensibility;

var builder = WebApplication.CreateBuilder(args);

builder.Services.Configure<TelemetryConfiguration>(telemetryConfiguration =>
{
   var telemetryProcessorChainBuilder = telemetryConfiguration.DefaultTelemetrySink.TelemetryProcessorChainBuilder;

   // Using adaptive sampling
   telemetryProcessorChainBuilder.UseAdaptiveSampling(maxTelemetryItemsPerSecond: 5);

   // Alternately, the following configures adaptive sampling with 5 items per second, and also excludes DependencyTelemetry from being subject to sampling:
   // telemetryProcessorChainBuilder.UseAdaptiveSampling(maxTelemetryItemsPerSecond:5, excludedTypes: "Dependency");
});

builder.Services.AddApplicationInsightsTelemetryWorkerService(new ApplicationInsightsServiceOptions
{
   EnableAdaptiveSampling = false,
});

var app = builder.Build();
透過 HTTP 擴充資料
ASP.NET
var requestTelemetry = HttpContext.Current?.Items["Microsoft.ApplicationInsights.RequestTelemetry"] as RequestTelemetry;

if (requestTelemetry != null)
{
    requestTelemetry.Properties["myProp"] = "someData";
}
ASP.NET Core
HttpContext.Features.Get<RequestTelemetry>().Properties["myProp"] = someData
SDK 組態
本節內容
您可以自訂適用於 ASP.NET、ASP.NET Core 和背景工作角色服務的 Application Insights SDK,以變更預設設定。
ASP.NET
Application Insights .NET SDK 是由許多 NuGet 封裝組成。 核心封裝 提供 API,用於傳送遙測至 Application Insights。 其他套件提供遙測模組和初始設定式,用於自動從您的應用程式和其內容追蹤遙測。 調整設定檔,即可啟用或停用遙測模組和初始設定式。 您也可以設定其中一些項目的參數。
設定檔的名稱為 ApplicationInsights.config 或 ApplicationInsights.xml。 名稱取決於應用程式的類型。 當您安裝大部分版本的 SDK 時,系統會自動將組態檔新增至您的專案。
根據預設,從支援 [新增] > [Application Insights Telemetry] 的 Visual Studio 範本專案使用自動化體驗時,專案根資料夾中會建立 ApplicationInsights.config 檔案。 編譯後,它會被複製到 bin 資料夾。 其還可透過 IIS 伺服器上的 Application Insights 新增到 Web 應用程式中。
這很重要
如果使用 Azure 網站的延伸模組 或 Azure VM 和 Azure 虛擬機器擴展集的延伸模組 ,則會忽略組態檔。
沒有同等的檔案可控制網頁中的 SDK。
ASP.NET Core
在 ASP.NET Core 應用程式中,除非另有指示,否則所有組態變更都會在 ConfigureServices() 類別的方法中進行。
備註
在 ASP.NET Core 應用程式中,不支援藉由修改 TelemetryConfiguration.Active 來變更設定。
背景工作服務
背景工作服務 SDK 所使用的預設值 TelemetryConfiguration 類似於 ASP.NET 或 ASP.NET Core 應用程式中所使用的自動組態,但缺少用於擴充來自 HttpContext 之遙測的遙測初始設定式。
您可以自訂適用於工作服務的 Application Insights SDK,以變更預設設定。 Application Insights ASP.NET Core SDK 的使用者可能熟悉使用 ASP.NET Core 內建 相依性插入來變更設定。 Worker Service SDK 也基於類似的原則。 在ConfigureServices()上呼叫適當的方法以實現IServiceCollection節中的幾乎所有配置變更,如下一節所述。
備註
當您使用 Worker 服務 SDK 時,透過修改 TelemetryConfiguration.Active 來變更設定是不支援的,而變更也不會被反映。
遙測通道
遙測通道是 Application Insights SDK 不可或缺的一部分。 遙測通道管理遙測的緩衝處理和到 Application Insights 服務的傳輸。 SDK 的 .NET 和 .NET Core 版本有兩個內建遙測通道:InMemoryChannel 和 ServerTelemetryChannel。 本節說明每個通道,並示範如何自訂通道行為。
備註
若要檢閱常見問題 (FAQ),請參閱遙測通道常見問題
什麼是遙測通道?
遙測通道負責緩衝處理遙測項目,並將其傳送至 Application Insights 服務儲存,以便進行查詢和分析。 遙測通道是任何可實作 Microsoft.ApplicationInsights.ITelemetryChannel 介面的類別。
呼叫過所有遙測初始設定式和遙測處理器之後,便會呼叫遙測通道的 Send(ITelemetry item) 方法。 因此,遙測處理器卸除的任何項目都不會觸達通道。
Send() 方法通常不會立即將項目傳送至後端。 一般而言,會在記憶體中緩衝處理再批次傳送這些項目,以便提升傳輸的效率。
除非必須立即傳送緩衝的遙測資料,否則請避免呼叫 Flush()。 僅在應用程式關閉、例外狀況處理,或使用短暫存留的處理序 (例如背景工作或命令列工具) 等案例中使用它。 在 Web 應用程式或長時間執行的服務中,SDK 會自動處理遙測傳送。 不必要地呼叫 Flush() 可能會造成效能問題。
即時計量資料流也有自訂通道,可支援遙測的即時串流。 此通道與一般遙測通道無關,本文件亦未套用此通道。
內建遙測通道
Application Insights .NET 和 .NET Core SDK 隨附兩個內建通道:
InMemoryChannel: 輕量型通道,會緩衝記憶體中的項目,直到傳送為止。 項目會在記憶體中緩衝處理,並每隔 30 秒或緩衝對象達 500 個項目時排清一次。 此通道提供最低可靠性保證,因其不會在失敗後重新嘗試傳送遙測。 此通道也不會將項目保留在磁碟上。 因此未傳送的項目會於應用程式關閉時永久遺失,無論應用程式是正常或不正常關閉。 此通道會實作
Flush()方法,可用以同步強制排清任何記憶體內部的遙測項目。 此通道非常適合需要同步排清的短期執行應用程式。此通道屬於較大 Microsoft.ApplicationInsights NuGet 套件的一部分,也是 SDK 在未設定其他任何項目時使用的預設通道。
ServerTelemetryChannel: 更進階的通道,具有重試原則,且可將資料儲存在本地磁碟。 如果發生暫時性錯誤,此通道會重新嘗試傳送遙測。 此通道也會使用本地磁碟儲存體,在網路中斷或高遙測磁碟區期間將項目保留在磁碟上。 因為有這些重試機制和本地磁碟儲存體,一般認為此通道更為可靠。 建議將此通道用於所有實際案例。 根據官方文件設定,ASP.NET 和 ASP.NET Core 應用程式預設使用此通道。 此通道已針對具有長時間執行流程的伺服器情節進行最佳化。 此通道實作的
Flush()方法並非同步。此通道隨附為 Microsoft.ApplicationInsights.WindowsServer.TelemetryChannel NuGet 套件,只要您使用 Microsoft.ApplicationInsights.Web 或 Microsoft.ApplicationInsights.AspNetCore NuGet 套件便會自動取得。
設定遙測通道
您可以將遙測通道設定為作用中的遙測設定,藉此設定遙測通道。 若是 ASP.NET 應用程式,設定包括將遙測通道執行個體設定為 TelemetryConfiguration.Active,或是透過 ApplicationInsights.config 進行修改。 若是 ASP.NET Core 應用程式,設定包括將通道新增至相依性插入容器。
下列各節顯示各種應用程式型別通道的 StorageFolder 設定範例。
StorageFolder 只是其中一個可供設定的項目。 如需設定的完整清單,請參閱本文稍後的通道中可設定的設定值一節。
ASP.NET
選項 1:程式碼中的設定
下列程式碼設定 ServerTelemetryChannel 執行個體,將 StorageFolder 設定為自訂位置。 在應用程式開頭新增此程式碼,通常是在 Global.aspx.cs 中的 Application_Start() 方法中。
using Microsoft.ApplicationInsights.Extensibility;
using Microsoft.ApplicationInsights.WindowsServer.TelemetryChannel;
protected void Application_Start()
{
    var serverTelemetryChannel = new ServerTelemetryChannel();
serverTelemetryChannel.StorageFolder = @"d:\temp\applicationinsights";
    serverTelemetryChannel.Initialize(TelemetryConfiguration.Active);
    TelemetryConfiguration.Active.TelemetryChannel = serverTelemetryChannel;
}
選項 2:ApplicationInsights.config 中的設定
ApplicationInsights.config 的下一節顯示已由 ServerTelemetryChannel 設定為自訂位置的 StorageFolder 通道:
    <TelemetrySinks>
        <Add Name="default">
            <TelemetryProcessors>
                <!-- Telemetry processors omitted for brevity -->
            </TelemetryProcessors>
            <TelemetryChannel Type="Microsoft.ApplicationInsights.WindowsServer.TelemetryChannel.ServerTelemetryChannel, Microsoft.AI.ServerTelemetryChannel">
                <StorageFolder>d:\temp\applicationinsights</StorageFolder>
            </TelemetryChannel>
        </Add>
    </TelemetrySinks>
ASP.NET Core
修改 ConfigureServices 類別的 Startup.cs 方法,如下所示:
using Microsoft.ApplicationInsights.Channel;
using Microsoft.ApplicationInsights.WindowsServer.TelemetryChannel;

public void ConfigureServices(IServiceCollection services)
{
    // This sets up ServerTelemetryChannel with StorageFolder set to a custom location.
    services.AddSingleton(typeof(ITelemetryChannel), new ServerTelemetryChannel() {StorageFolder = @"d:\temp\applicationinsights" });

    services.AddApplicationInsightsTelemetry();
}
這很重要
ASP.NET Core 應用程式不支援使用 TelemetryConfiguration.Active 設定通道。
覆寫 ServerTelemetryChannel
預設遙測通道為 ServerTelemetryChannel。 下列範例會示範如何對其進行覆寫。
using Microsoft.ApplicationInsights.Channel;

var builder = WebApplication.CreateBuilder(args);

// Use the following to replace the default channel with InMemoryChannel.
// This can also be applied to ServerTelemetryChannel.
builder.Services.AddSingleton(typeof(ITelemetryChannel), new InMemoryChannel() {MaxTelemetryBufferCapacity = 19898 });

builder.Services.AddApplicationInsightsTelemetry();

var app = builder.Build();
備註
如果您想要排清緩衝區,請參閱排清資料。 例如,如果您在關閉的應用程式中使用 SDK,您可能需要排清緩衝區。
背景工作服務
預設通道是 ServerTelemetryChannel。 您可以覆寫它,如下列範例所示:
using Microsoft.ApplicationInsights.Channel;

    public void ConfigureServices(IServiceCollection services)
    {
        // Use the following to replace the default channel with InMemoryChannel.
        // This can also be applied to ServerTelemetryChannel.
        services.AddSingleton(typeof(ITelemetryChannel), new InMemoryChannel() {MaxTelemetryBufferCapacity = 19898 });

        services.AddApplicationInsightsTelemetryWorkerService();
    }
在程式碼中設定主控台應用程式
針對主控台應用程式,.NET 和 .NET Core 的程式碼相同:
var serverTelemetryChannel = new ServerTelemetryChannel();
serverTelemetryChannel.StorageFolder = @"d:\temp\applicationinsights";
serverTelemetryChannel.Initialize(TelemetryConfiguration.Active);
TelemetryConfiguration.Active.TelemetryChannel = serverTelemetryChannel;
ServerTelemetryChannel 的操作詳細資料
ServerTelemetryChannel 會將抵達的項目儲存在記憶體內部緩衝區中。 這些項目會每 30 秒或在緩衝達到 500 個項目時,進行序列化、壓縮,並儲存到 Transmission 執行個體中。 單一 Transmission 執行個體最多包含 500 個項目,代表透過單一 HTTPS 呼叫傳送至 Application Insights 服務的遙測批次。
根據預設,最多可以平行傳送 10 個 Transmission 執行個體。 如果遙測抵達速度較快,或者網路或 Application Insights 後端速度緩慢,則 Transmission 執行個體會儲存在記憶體中。 此記憶體內部 Transmission 緩衝區的預設容量為 5 MB。 超過記憶體內部容量時,Transmission 執行個體會儲存在本地磁碟上,上限為 50 MB。
Transmission 執行個體也會在發生網路問題時儲存在本地磁碟上。 只有儲存在本地磁碟上的項目才能在應用程式損毀時存留下來。 只要重新啟動應用程式,即會傳送這些項目。 如果網路問題持續發生,則 ServerTelemetryChannel 會使用介於 10 秒到 1 小時的指數輪詢邏輯,然後再次重新嘗試傳送遙測資料。
通道中可設定的設定值
如需每個通道可設定設定值的完整清單,請參閱:
下列是最常用於 ServerTelemetryChannel 的設定:
MaxTransmissionBufferCapacity:通道用來緩衝記憶體傳輸的最大記憶體數量,以位元組為單位。 觸達此容量後,新項目會直接儲存至本地磁碟。 預設值是 5 MB。 設定較高的值會導致磁碟使用量降低,但請記住,如果應用程式損毀,記憶體中的項目會遺失。MaxTransmissionSenderCapacity:同時傳送至 Application Insights 的Transmission執行個體數量上限。 預設值為 10。 此設定可以設定為較高的數字,建議於產生大量遙測時使用。 大量遙測通常會於負載測試期間或關閉取樣時產生。StorageFolder:通道用來視需要將項目儲存至磁碟的資料夾。 在 Windows 中,如未明確指定其他路徑,則會使用 %LOCALAPPDATA% 或 %TEMP%。 在 Windows 以外的環境中,預設會使用下列位置 (依序): %TMPDIR%、 /var/tmp/ 或 /tmp/。
我該使用哪一個通道?
建議將 ServerTelemetryChannel 用於涉及長時間執行應用程式的多數實際案例。 如需了解如何排清遙測,請閱讀有關使用 Flush()的文章。
何時使用 Flush()
Flush() 方法會立即傳送任何已緩衝的遙測資料。 但是,它只能在特定案例中使用。
Flush() 的使用時機:
- 應用程式即將關閉,而且您想要確保在結束之前傳送遙測資料。
- 您位於例外狀況處理常式中,且需要保證遙測可傳送。
- 您正在撰寫短暫存留的處理序,例如快速結束的背景工作或 CLI 工具。
避免在長時間執行的應用程式 (例如 Web 服務) 中使用 Flush()。 SDK 會自動管理緩衝處理和傳輸。 不必要地呼叫 Flush() 可能會造成效能問題,且無法保證傳送所有資料,特別是在使用 ServerTelemetryChannel (它不會同步排清) 的情況下。
遙測模組
Application Insights 會自動收集特定工作負載的相關遙測,而不需要使用者手動追蹤。
預設會啟用下列自動收集模組。 您可加以停用或設定來改變其預設行為。
ASP.NET
每個遙測模組收集特定類型的資料,以及使用核心 API 來傳送資料。 模組由不同的 NuGet 封裝安裝,也會將必要的行加入 .config 檔案。
| Area | Description |
|---|---|
| 要求追蹤 | 收集針對傳入 Web 要求的要求遙測 (回應時間、結果碼)。 模組: Microsoft.ApplicationInsights.Web.RequestTrackingTelemetryModuleNuGet:Microsoft.ApplicationInsights.Web |
| 相依性追蹤 | 收集針對傳出相依性的遙測 (HTTP 呼叫、SQL 呼叫)。 若要在 IIS 中運作,請安裝 Application Insights 代理程式。 您也可以使用 TrackDependency API 撰寫自訂相依性追蹤。 支援透過 App Service 和 VM 與虛擬機器擴展集監控進行自動檢測。 模組: Microsoft.ApplicationInsights.DependencyCollector.DependencyTrackingTelemetryModuleNuGet:Microsoft.ApplicationInsights.DependencyCollector |
| 性能計數器 | 收集 Windows 效能計數器 (IIS 安裝的 CPU、記憶體和網路負載)。 指定哪些計數器 (包含自訂計數器)。 如需詳細資訊,請參閱收集系統效能計數器。 模組: Microsoft.ApplicationInsights.Extensibility.PerfCounterCollector.PerformanceCollectorModuleNuGet:Microsoft.ApplicationInsights.PerfCounterCollector |
| 事件計數器 | 收集 .NET EventCounters。 建議用於 ASP.NET Core 和跨平台,以取代 Windows 效能計數器。 模組: EventCounterCollectionModule (SDK ≥ 2.8.0) |
| 即時計量 (QuickPulse) | 收集即時計量窗格的遙測。 模組: QuickPulseTelemetryModule |
| 活動訊號 (App Service) | 傳送適用於 App Service 環境的活動訊號和自訂計量。 模組: AppServicesHeartbeatTelemetryModule |
| 活動訊號 (VM 與虛擬機器擴展集) | 傳送適用於 Azure VM 環境的活動訊號和自訂計量。 模組: AzureInstanceMetadataTelemetryModule |
| 診斷遙測 | 報告 Application Insights 檢測程式碼中的錯誤 (例如遺失的計數器、ITelemetryInitializer 例外狀況)。 追蹤遙測會出現在診斷搜尋中。模組: Microsoft.ApplicationInsights.Extensibility.Implementation.Tracing.DiagnosticsTelemetryModuleNuGet:Microsoft.ApplicationInsights 注意: 如果您僅安裝此套件,不會自動建立 ApplicationInsights.config 檔案。 |
| 開發人員模式 (已連結偵錯工具) | 強制 TelemetryChannel 在偵錯工具連結時立即傳送項目。 可降低延遲,但會增加 CPU/網路額外負荷。模組: Microsoft.ApplicationInsights.WindowsServer.DeveloperModeWithDebuggerAttachedTelemetryModuleNuGet:Application Insights Windows Server |
| 例外狀況追蹤 (Web) | 追蹤 Web 應用程式中未處理的例外狀況。 請參閱失敗和例外狀況。 模組: Microsoft.ApplicationInsights.Web.ExceptionTrackingTelemetryModuleNuGet:Microsoft.ApplicationInsights.Web |
| 例外狀況追蹤 (未觀察/未處理) | 追蹤背景工作角色、Windows 服務和主控台應用程式中未觀察到的工作例外狀況與未處理的例外狀況。 模組: • Microsoft.ApplicationInsights.WindowsServer.UnobservedExceptionTelemetryModule• Microsoft.ApplicationInsights.WindowsServer.UnhandledExceptionTelemetryModuleNuGet:Microsoft.ApplicationInsights.WindowsServer |
| EventSource 追蹤 | 將已設定的 EventSource 事件作為追蹤傳送至 Application Insights。 模組: Microsoft.ApplicationInsights.EventSourceListener.EventSourceTelemetryModuleNuGet:Microsoft.ApplicationInsights.EventSourceListener |
| ETW 收集器 | 將已設定的 ETW 提供者事件作為追蹤傳送至 Application Insights。 模組: Microsoft.ApplicationInsights.EtwCollector.EtwCollectorTelemetryModuleNuGet:Microsoft.ApplicationInsights.EtwCollector |
| 核心 API (不是模組) |
核心 API 由其他遙測元件使用,也適用於自訂遙測。 模組: Microsoft.ApplicationInsights packageNuGet:Microsoft.ApplicationInsights 注意: 如果您僅安裝此套件,不會自動建立 ApplicationInsights.config 檔案。 |
ASP.NET Core
| Area | Description |
|---|---|
| 要求追蹤 | 透過 ASP.NET Core Application Insights 整合內建要求追蹤。 模組:沒有單獨的模組類別。 NuGet:Microsoft.ApplicationInsights.AspNetCore |
| 相依性追蹤 | 透過相依性收集器。 NuGet:Microsoft.ApplicationInsights.DependencyCollector |
| 性能計數器 | 僅限 Windows! 在跨平台中請使用 EventCounterCollectionModule(見下一列)。NuGet:Microsoft.ApplicationInsights.PerfCounterCollector |
| 事件計數器 | 收集 .NET EventCounters。 建議用於 ASP.NET Core 和跨平台,以取代 Windows 效能計數器。 模組: EventCounterCollectionModule (SDK 2.8.0 及更新版本)NuGet:Microsoft.ApplicationInsights.EventCounterCollector |
| 即時計量 (QuickPulse) | 在 ASP.NET Core Application Insights 整合中啟用即時計量。 模組:沒有單獨的模組類別。 NuGet:Microsoft.ApplicationInsights.AspNetCore |
| 活動訊號收集器 (App Service) | 傳送具有 App Service 環境相關詳細資料的活動訊號 (做為自訂計量)。 當裝載於 App Service 時,透過基本 SDK 內建。 模組:沒有單獨的模組類別。 NuGet:Microsoft.ApplicationInsights.AspNetCore |
| 活動訊號收集器 (VM 與虛擬機器擴展集) | 傳送具有 Azure VM 環境相關詳細資料的活動訊號 (做為自訂計量)。 裝載在 Azure VM 和 Azure 虛擬機器擴展集上時,透過基底 SDK 內建。 模組:沒有單獨的模組類別。 NuGet:Microsoft.ApplicationInsights.AspNetCore |
| 診斷遙測 | 報告 Application Insights 檢測程式碼本身的錯誤 (例如無法存取效能計數器、ITelemetryInitializer 擲回例外狀況)。 追蹤遙測會出現在診斷搜尋中。模組: Microsoft.ApplicationInsights.Extensibility.Implementation.Tracing.DiagnosticsTelemetryModuleNuGet:Microsoft.ApplicationInsights |
| 開發人員模式 (已連結偵錯工具) | 可用相同行為;類別是 Windows Server 套件的一部分。 模組: Microsoft.ApplicationInsights.WindowsServer.DeveloperModeWithDebuggerAttachedTelemetryModuleNuGet:Microsoft.ApplicationInsights.WindowsServer |
| 例外狀況追蹤 (Web) | 在 ASP.NET Core Application Insights 整合中自動例外狀況追蹤 模組:沒有單獨的模組類別。 NuGet:Microsoft.ApplicationInsights.AspNetCore |
| 例外狀況追蹤 (未觀察/未處理) | 透過 ASP.NET Core 執行階段/整合的類似行為;類別名稱是 Windows Server 特定。 NuGet:Microsoft.ApplicationInsights.WindowsServer |
| EventSource 追蹤 | 將已設定的 EventSource 事件作為追蹤傳送至 Application Insights。 模組: Microsoft.ApplicationInsights.EventSourceListener.EventSourceTelemetryModuleNuGet:Microsoft.ApplicationInsights.EventSourceListener |
| ETW 收集器 | 僅限 Windows (ETW)。 將已設定的 ETW 提供者事件作為追蹤傳送至 Application Insights。 模組: Microsoft.ApplicationInsights.EtwCollector.EtwCollectorTelemetryModuleNuGet:Microsoft.ApplicationInsights.EtwCollector |
| 核心 API (不是模組) | 核心 API 由其他遙測元件使用,也適用於自訂遙測。 模組: Microsoft.ApplicationInsights packageNuGet:Microsoft.ApplicationInsights |
設定遙測模組
ASP.NET
使用 TelemetryModules 區段 (位於 ApplicationInsights.config) 來設定、新增或移除模組。 下列範例中:
- 設定
DependencyTrackingTelemetryModule(啟用 W3C 標頭插入)。 - 設定
EventCounterCollectionModule(清除預設值並新增單一計數器)。 - 透過移除
PerformanceCollectorModule以停用 perf‑counter 收集。
<ApplicationInsights>
  <TelemetryModules>

    <!-- Dependency tracking -->
    <Add Type="Microsoft.ApplicationInsights.DependencyCollector.DependencyTrackingTelemetryModule, Microsoft.AI.DependencyCollector">
      <!-- Match Core example: enable W3C header injection -->
      <EnableW3CHeadersInjection>true</EnableW3CHeadersInjection>
    </Add>

    <!-- EventCounterCollectionModule: add a single counter (if you use event counters) -->
    <Add Type="Microsoft.ApplicationInsights.Extensibility.PerfCounterCollector.EventCounterCollectionModule, Microsoft.AI.PerfCounterCollector">
      <Counters>
        <!-- Mirrors Core example: only collect 'gen-0-size' from System.Runtime -->
        <Add ProviderName="System.Runtime" CounterName="gen-0-size" />
      </Counters>
    </Add>

    <!-- PerformanceCollectorModule (classic Windows performance counters).
         To DISABLE perf-counter collection, do NOT include this module.
         If it already exists in your file, remove or comment it out.
         Example of the line you would remove:
    <Add Type="Microsoft.ApplicationInsights.Extensibility.PerfCounterCollector.PerformanceCollectorModule, Microsoft.AI.PerfCounterCollector" />
    -->

  </TelemetryModules>
</ApplicationInsights>
備註
您 ApplicationInsights.config 中所存在的模組集,取決於您安裝的 SDK 套件。
ASP.NET Core
選項 1:使用 ConfigureTelemetryModule 設定遙測模組
若要設定任何預設 TelemetryModule,請在 ConfigureTelemetryModule<T> 上使用擴充方法 IServiceCollection,如下列範例所示:
using Microsoft.ApplicationInsights.DependencyCollector;
using Microsoft.ApplicationInsights.Extensibility.PerfCounterCollector;

var builder = WebApplication.CreateBuilder(args);

builder.Services.AddApplicationInsightsTelemetry();

// The following configures DependencyTrackingTelemetryModule.
// Similarly, any other default modules can be configured.
builder.Services.ConfigureTelemetryModule<DependencyTrackingTelemetryModule>((module, o) =>
        {
            module.EnableW3CHeadersInjection = true;
        });

// The following removes all default counters from EventCounterCollectionModule, and adds a single one.
builder.Services.ConfigureTelemetryModule<EventCounterCollectionModule>((module, o) =>
        {
            module.Counters.Add(new EventCounterCollectionRequest("System.Runtime", "gen-0-size"));
        });

// The following removes PerformanceCollectorModule to disable perf-counter collection.
// Similarly, any other default modules can be removed.
var performanceCounterService = builder.Services.FirstOrDefault<ServiceDescriptor>(t => t.ImplementationType == typeof(PerformanceCollectorModule));
if (performanceCounterService != null)
{
    builder.Services.Remove(performanceCounterService);
}

var app = builder.Build();
選項 2:使用 ApplicationInsightsServiceOptions 設定遙測模組
在 SDK 2.12.2 版和更新版本中,您可以將 ApplicationInsightsServiceOptions 傳遞至 AddApplicationInsightsTelemetry 以修改一些常見的設定,如下列範例所示:
var builder = WebApplication.CreateBuilder(args);

var aiOptions = new Microsoft.ApplicationInsights.AspNetCore.Extensions.ApplicationInsightsServiceOptions();

// Disables adaptive sampling.
aiOptions.EnableAdaptiveSampling = false;

// Disables live metrics (also known as QuickPulse).
aiOptions.EnableQuickPulseMetricStream = false;

builder.Services.AddApplicationInsightsTelemetry(aiOptions);
var app = builder.Build();
下表具有完整的 ApplicationInsightsServiceOptions 設定清單:
| Setting | Description | 預設 |
|---|---|---|
| EnablePerformanceCounterCollectionModule | 啟用/停用 PerformanceCounterCollectionModule。 |
對 |
| 啟用請求追蹤遙測模組 | 啟用/停用 RequestTrackingTelemetryModule。 |
對 |
| 啟用事件計數器收集模組 | 啟用/停用 EventCounterCollectionModule。 |
對 |
| 啟用依賴追蹤遙測模組 (EnableDependencyTrackingTelemetryModule) | 啟用/停用 DependencyTrackingTelemetryModule。 |
對 |
| 啟用應用服務心跳遙測模組 | 啟用/停用 AppServicesHeartbeatTelemetryModule。 |
對 |
| 啟用 Azure 實例元資料遙測模組 (EnableAzureInstanceMetadataTelemetryModule) | 啟用/停用 AzureInstanceMetadataTelemetryModule。 |
對 |
| EnableQuickPulseMetricStream | 啟用/停用 LiveMetrics 功能。 | 對 |
| 啟用自適應取樣 (EnableAdaptiveSampling) | 啟用/停用調適型取樣。 | 對 |
| EnableHeartbeat | 開啟/關閉心跳功能。 此功能會定期 (15 分鐘預設值) 傳送名為 HeartbeatState 的自訂計量,其中包含 .NET 版本 和 Azure 環境資訊 (若適用) 等執行階段的資訊。 |
對 |
| AddAutoCollectedMetricExtractor | 啟用/停用 AutoCollectedMetrics extractor。 此遙測處理器會在取樣發生之前,先傳送有關要求/相依性的預先彙總計量。 |
對 |
| RequestCollectionOptions.TrackExceptions | 啟用/停用要求收集模組未處理的例外狀況追蹤報告。 | 在 netstandard2.0 中為 False (因為例外狀況會使用 ApplicationInsightsLoggerProvider 追蹤)。 否則為 True。 |
| 啟用診斷遙測模組 | 啟用/停用 DiagnosticsTelemetryModule。 停用會導致忽略下列設定:EnableHeartbeat、EnableAzureInstanceMetadataTelemetryModule 和 EnableAppServicesHeartbeatTelemetryModule。 |
對 |
如需最新的清單,請參閱 ApplicationInsightsServiceOptions 中可設定的設定。
Microsoft.ApplicationInsights.AspNetCore SDK 2.15.0 和更新版本的設定建議
在 Microsoft.ApplicationInsights.AspNetCore SDK 2.15.0 版和更新版本中,設定 ApplicationInsightsServiceOptions 中可用的每個設定,包括 ConnectionString。 使用應用程式的 IConfiguration 執行個體。 設定必須位於 ApplicationInsights 區段底下,如下列範例所示。 appsettings.json 的下一區段會設定連接字串,並停用調適型取樣和效能計數器集合。
{
    "ApplicationInsights": {
    "ConnectionString": "<YOUR-CONNECTION-STRING>",
    "EnableAdaptiveSampling": false,
    "EnablePerformanceCounterCollectionModule": false
    }
}
如果使用 builder.Services.AddApplicationInsightsTelemetry(aiOptions) (ASP.NET Core 6.0) 或 services.AddApplicationInsightsTelemetry(aiOptions) (ASP.NET Core 3.1 和更早版本),則會覆寫 Microsoft.Extensions.Configuration.IConfiguration 的設定。
背景工作服務
選項 1:使用 ConfigureTelemetryModule 設定遙測模組
Application Insights 會使用遙測模組來自動收集特定工作負載的遙測,而不需要手動追蹤。
預設會啟用下列自動收集模組。 這些模組負責自動收集遙測。 您可加以停用或設定來改變其預設行為。
DependencyTrackingTelemetryModulePerformanceCollectorModuleQuickPulseTelemetryModule-
AppServicesHeartbeatTelemetryModule(目前有一個涉及此遙測模組的問題。如需暫時因應措施,請參閱 GitHub 問題 1689。 AzureInstanceMetadataTelemetryModule
若要設定任何預設遙測模組,請如以下範例所示,在ConfigureTelemetryModule上使用IServiceCollection擴充方法:
    using Microsoft.ApplicationInsights.Extensibility.PerfCounterCollector.QuickPulse;
    using Microsoft.ApplicationInsights.Extensibility.PerfCounterCollector;

    public void ConfigureServices(IServiceCollection services)
    {
        services.AddApplicationInsightsTelemetryWorkerService();

            // The following configures QuickPulseTelemetryModule.
            // Similarly, any other default modules can be configured.
            services.ConfigureTelemetryModule<QuickPulseTelemetryModule>((module, o) =>
            {
                module.AuthenticationApiKey = "<YOUR-API-KEY-HERE>";
            });

            // The following removes PerformanceCollectorModule to disable perf-counter collection.
            // Similarly, any other default modules can be removed.
            var performanceCounterService = services.FirstOrDefault<ServiceDescriptor>
                                        (t => t.ImplementationType == typeof(PerformanceCollectorModule));
            if (performanceCounterService != null)
            {
                services.Remove(performanceCounterService);
            }
    }
選項 2:使用 ApplicationInsightsServiceOptions 設定遙測模組
您可以將 ApplicationInsightsServiceOptions 傳遞至 AddApplicationInsightsTelemetryWorkerService 來修改一些常見的設定,如下列範例所示:
using Microsoft.ApplicationInsights.WorkerService;

public void ConfigureServices(IServiceCollection services)
{
    var aiOptions = new ApplicationInsightsServiceOptions();
    // Disables adaptive sampling.
    aiOptions.EnableAdaptiveSampling = false;

    // Disables live metrics (also known as QuickPulse).
    aiOptions.EnableQuickPulseMetricStream = false;
    services.AddApplicationInsightsTelemetryWorkerService(aiOptions);
}
此 SDK 中的 ApplicationInsightsServiceOptions 位於命名空間 Microsoft.ApplicationInsights.WorkerService 中,而非 ASP.NET Core SDK 中的 Microsoft.ApplicationInsights.AspNetCore.Extensions。
以下表格列出ApplicationInsightsServiceOptions中常用的設定。
| Setting | Description | 預設 |
|---|---|---|
| EnableQuickPulseMetricStream | 啟用/停用即時指標功能。 | 對 |
| 啟用自適應取樣 (EnableAdaptiveSampling) | 啟用/停用調適型取樣。 | 對 |
| EnableHeartbeat | 啟用/停用心跳功能,此功能會每 15 分鐘(預設)定期傳送名為「HeartBeatState」的自訂計量,包含執行階段的資訊,例如 .NET 版本和 Azure 環境(如果適用)。 | 對 |
| AddAutoCollectedMetricExtractor | 啟用/停用 AutoCollectedMetrics 擷取器,這是一個遙測處理器,可在取樣發生之前傳送有關請求/相依性的預先彙總指標。 | 對 |
| 啟用診斷遙測模組 | 啟用/停用 DiagnosticsTelemetryModule。 停用此設定會導致忽略下列設定: EnableHeartbeat、 EnableAzureInstanceMetadataTelemetryModule和 EnableAppServicesHeartbeatTelemetryModule。 |
對 |
如需最新的清單,請參閱中的ApplicationInsightsServiceOptions可配置設定。
停用遙測
ASP.NET
組態檔中的每個模組都有一個節點。 若要停用模組,請刪除節點或將其註解化。
ASP.NET Core
如果您想要有條件且動態地停用遙測,則可在您的程式碼中使用 ASP.NET Core 相依性插入容器來解析 TelemetryConfiguration 執行個體,並在其上設定 DisableTelemetry 旗標。
var builder = WebApplication.CreateBuilder(args);

builder.Services.AddApplicationInsightsTelemetry();

// any custom configuration can be done here:
builder.Services.Configure<TelemetryConfiguration>(x => x.DisableTelemetry = true);

var app = builder.Build();
上述程式碼範例會防止將遙測傳送至 Application Insights。 它不會防止任何自動收集模組收集遙測。 如果您想要移除特定的自動收集模組,請參閱遙測模組。
背景工作服務
如果您想要有條件且動態地停用遙測,則可在您的程式碼中使用 ASP.NET Core 相依性插入容器來解析 TelemetryConfiguration 執行個體,並在其上設定 DisableTelemetry 旗標。
    public void ConfigureServices(IServiceCollection services)
    {
        services.AddApplicationInsightsTelemetryWorkerService();
    }

    public void Configure(IApplicationBuilder app, IHostingEnvironment env, TelemetryConfiguration configuration)
    {
        configuration.DisableTelemetry = true;
        ...
    }
連線字串
此設定會決定您的資料會在其中顯示的 Application Insights 資源。 通常您會針對每個應用程式建立個別資源,並使用個別的連接字串。
如需程式碼範例,請參閱 Application Insights 中的連接字串。
如果您想要動態設定連接字串 (例如將應用程式的結果傳送至不同的資源),則可以在設定檔中省略連接字串,並將其在程式碼中設定。
ASP.NET
若要設定所有 TelemetryClient 執行個體的連接字串 (包括標準遙測模組),請在初始化方法中執行此步驟,例如 ASP.NET 服務中的 global.aspx.cs:
using Microsoft.ApplicationInsights.Extensibility;
using Microsoft.ApplicationInsights;

    protected void Application_Start()
    {
        TelemetryConfiguration configuration = TelemetryConfiguration.CreateDefault();
        configuration.ConnectionString = "<YOUR-CONNECTION-STRING>";
        var telemetryClient = new TelemetryClient(configuration);
如果您想要將一組特定事件傳送至不同的資源,則可以針對特定遙測用戶端設定金鑰:
    var tc = new TelemetryClient();
    tc.Context.ConnectionString = "<YOUR-CONNECTION-STRING>";
    tc.TrackEvent("myEvent");
    // ...
若要取得新的連接字串,請在 Application Insights 入口網站中建立新的資源。
ASP.NET Core
在 ASP.NET Core 中,請在應用程式啟動期間,使用相依性插入 (DI) 容器中的 Program.cs,在 TelemetryConfiguration 中設定連接字串:
using Microsoft.ApplicationInsights.Extensibility;
using Microsoft.ApplicationInsights;

var builder = WebApplication.CreateBuilder(args);

// Add Application Insights
builder.Services.AddApplicationInsightsTelemetry();

var app = builder.Build();

// Resolve TelemetryConfiguration from DI and set the connection string
var config = app.Services.GetRequiredService<TelemetryConfiguration>();
config.ConnectionString = "<YOUR-CONNECTION-STRING>";

app.Run();
如果您想將特定事件集傳送到不同的資源,可以建立新的 TelemetryClient 執行個體,並明確設定其連接字串:
using Microsoft.ApplicationInsights;

var tc = new TelemetryClient();
tc.Context.ConnectionString = "<YOUR-CONNECTION-STRING>";
tc.TrackEvent("myEvent");
// ...
ApplicationId 提供者
備註
對於 ASP.NET,從 SDK v2.6.0* 起即可使用此提供者。
提供者的用途是要查閱以連接字串為基礎的應用程式識別碼。 應用程式識別碼包含在 RequestTelemetry 和 DependencyTelemetry 中,並且用來判斷入口網站中的相互關聯。
此功能可透過設定 TelemetryConfiguration.ApplicationIdProvider 來使用。
介面:IApplicationIdProvider
public interface IApplicationIdProvider
{
    bool TryGetApplicationId(string connectionString, out string applicationId);
}
我們在 Microsoft.ApplicationInsights SDK 中提供兩個實作:ApplicationInsightsApplicationIdProvider 和 DictionaryApplicationIdProvider。
ApplicationInsightsApplicationIdProvider
此包裝函式可用於我們的設定檔 API。 它會節流要求並快取結果。 當您安裝 Microsoft.ApplicationInsights.DependencyCollector 或 Microsoft.ApplicationInsights.Web 時,會自動包含此提供者。
此類別公開名為 ProfileQueryEndpoint 的選用屬性。 這預設為 https://dc.services.visualstudio.com/api/profiles/{0}/appId。
如果需要設定 Proxy,我們建議 Proxy 基底位址,並確保路徑包含 /api/profiles/{0}/appId。 執行時, {0} 則被每個請求的連接字串取代。
ASP.NET
透過 ApplicationInsights.config 的設定範例
<ApplicationInsights>
    ...
    <ApplicationIdProvider Type="Microsoft.ApplicationInsights.Extensibility.Implementation.ApplicationId.ApplicationInsightsApplicationIdProvider, Microsoft.ApplicationInsights">
        <ProfileQueryEndpoint>https://dc.services.visualstudio.com/api/profiles/{0}/appId</ProfileQueryEndpoint>
    </ApplicationIdProvider>
    ...
</ApplicationInsights>
透過程式碼的設定範例
TelemetryConfiguration.Active.ApplicationIdProvider = new ApplicationInsightsApplicationIdProvider();
ASP.NET Core
備註
在 ASP.NET Core 中,沒有 ApplicationInsights.config 檔案。 設定是透過相依性插入 (DI) 在 Program.cs 或 Startup.cs 中完成。
您可以覆寫預設提供者,或自訂其 ProfileQueryEndpoint。
using Microsoft.ApplicationInsights.Extensibility.Implementation.ApplicationId;

var builder = WebApplication.CreateBuilder(args);

// Add Application Insights
builder.Services.AddApplicationInsightsTelemetry();

// Replace default provider with custom configuration
builder.Services.AddSingleton<IApplicationIdProvider>(sp =>
    new ApplicationInsightsApplicationIdProvider
    {
        ProfileQueryEndpoint = "https://custom-proxy/api/profiles/{0}/appId"
    });

var app = builder.Build();
app.Run();
DictionaryApplicationIdProvider
這個靜態提供者依賴你設定的連線字串/應用程式 ID 配對。
此類別具有 Defined 屬性,其為連接字串與應用程式 ID 配對Dictionary<string,string>。
此類別具有選擇性 Next 屬性,可在您的設定中不存在所要求的連接字串時,用來設定其他提供者。
ASP.NET
透過 ApplicationInsights.config 的設定範例
<ApplicationInsights>
    ...
    <ApplicationIdProvider Type="Microsoft.ApplicationInsights.Extensibility.Implementation.ApplicationId.DictionaryApplicationIdProvider, Microsoft.ApplicationInsights">
        <Defined>
            <Type key="ConnectionString_1" value="ApplicationId_1"/>
            <Type key="ConnectionString_2" value="ApplicationId_2"/>
        </Defined>
        <Next Type="Microsoft.ApplicationInsights.Extensibility.Implementation.ApplicationId.ApplicationInsightsApplicationIdProvider, Microsoft.ApplicationInsights" />
    </ApplicationIdProvider>
    ...
</ApplicationInsights>
透過程式碼的設定範例
TelemetryConfiguration.Active.ApplicationIdProvider = new DictionaryApplicationIdProvider{
 Defined = new Dictionary<string, string>
    {
        {"ConnectionString_1", "ApplicationId_1"},
        {"ConnectionString_2", "ApplicationId_2"}
    }
};
ASP.NET Core
using Microsoft.ApplicationInsights.Extensibility.Implementation.ApplicationId;

var builder = WebApplication.CreateBuilder(args);

builder.Services.AddApplicationInsightsTelemetry();

// Register DictionaryApplicationIdProvider
builder.Services.AddSingleton<IApplicationIdProvider>(sp =>
    new DictionaryApplicationIdProvider
    {
        Defined = new Dictionary<string, string>
        {
            { "ConnectionString_1", "ApplicationId_1" },
            { "ConnectionString_2", "ApplicationId_2" }
        },
        Next = new ApplicationInsightsApplicationIdProvider() // optional fallback
    });

var app = builder.Build();
app.Run();
加入用戶端監視
上一節提供自動和手動設定伺服器端監視方法的指引。 若要新增用戶端監視,請使用用戶端 JavaScript SDK。 您可以在頁面 HTML 的結尾標記之前新增 </head>,以監視任何網頁的用戶端交易。
雖然可以手動將 JavaScript (Web) SDK 載入器指令碼新增至每個 HTML 頁面標頭,但建議您改為將 JavaScript (Web) SDK 載入器指令碼新增至主要頁面。 該動作會將 JavaScript (Web) SDK 載入器指令碼插入網站的所有頁面中。
ASP.NET
針對本文中的範本型 ASP.NET MVC 應用程式,您需要編輯的檔案是 "_Layout.cshtml"。 您可以在 [檢視] > [共用] 底下找到它。 若要新增用戶端監視,請開啟 "_Layout.cshtml",並遵循用戶端 JavaScript SDK 組態相關文章中的 JavaScript (Web) SDK 載入器指令碼型設定指示操作。
ASP.NET Core
如果您的應用程式具有用戶端元件,請遵循後續步驟,開始根據設定,使用「JavaScript (Web) SDK 載入器指令碼」插入來收集使用量遙測。
在 _ViewImports.cshtml 中,新增插入:
@inject Microsoft.ApplicationInsights.AspNetCore.JavaScriptSnippet JavaScriptSnippet在 _Layout.cshtml 中,在
HtmlHelper區段的結尾插入<head>,但在插入任何其他腳本之前。 如果您想要從頁面報告任何自訂的 JavaScript 遙測,請將它插入至此程式碼片段之後:@Html.Raw(JavaScriptSnippet.FullScript) </head>
FullScript 作為使用 ScriptBody 的替代方案,已從 Application Insights SDK for ASP.NET Core 2.14 版開始提供。 如果您需要控制 ScriptBody 標籤以設定內容安全性原則,請使用 <script>:
<script> // apply custom changes to this script tag.
    @Html.Raw(JavaScriptSnippet.ScriptBody)
</script>
稍早參考的 .cshtml 檔名來自預設MVC 應用程式範本。 最後,如果您想要正確啟用應用程式的用戶端監視,JavaScript (Web) SDK 載入器腳本必須出現在 <head> 您要監視之應用程式每個頁面的 區段中。 將 JavaScript (Web) SDK 載入器腳本新增至 應用程式範本中的 _Layout.cshtml ,以啟用客戶端監視。
如果您的專案不包含 _Layout.cshtml,您仍然可以將 JavaScript (Web) SDK 載入器腳本新增至控制應用程式內所有頁面的對等檔案,以新增<head>。 或者,您可以將 JavaScript (Web) SDK 載入器指令碼新增至多個頁面,但我們不建議這麼做。
備註
JavaScript 插入提供預設的設定體驗。 如果您需要 設定連接字串 以外的組態,您必須按照說明移除自動注入,並手動新增 JavaScript SDK。
自訂事件和指標的核心 API
在應用程式中插入幾行程式碼,以找出使用者正在使用它執行的動作,或協助診斷問題。 您可以從裝置和傳統型應用程式、Web 用戶端和 Web 伺服器傳送遙測。 使用 Application Insights 核心遙測 API 來傳送自訂事件和計量,以及您自己的標準遙測版本。 此 API 與標準 Application Insights 資料收集器使用的 API 相同。
API 摘要
核心 API 在所有平台上都是統一的,除了一些變化,例如 GetMetric (僅限 .NET)。
| 方法 | 用於 |
|---|---|
TrackPageView |
頁面、畫面、窗格或表單。 |
TrackEvent |
使用者動作和其他事件。 用於追蹤使用者行為或監控效能。 |
GetMetric |
零和多維度計量、集中設定的彙總、僅限 C#。 |
TrackMetric |
效能測量,例如與特定事件無關的佇列長度。 |
TrackException |
紀錄例外狀況以進行診斷。 追蹤事件發生的位置與其他事件的相對關係,並檢視堆疊追蹤資訊。 |
TrackRequest |
記錄伺服器請求的頻率和持續時間以進行效能分析。 |
TrackTrace |
資源診斷日誌訊息。 您也可以擷取第三方記錄。 |
TrackDependency |
記錄應用程式依賴的外部元件呼叫的頻率和持續時間。 |
您可以 將屬性和指標附加 至大部分的遙測呼叫。
先決條件
如果您還沒有 Application Insights SDK 的參考:
將 Application Insights SDK 新增至您的專案。
在您的裝置或網頁伺服器程式碼中,包括:
取得 TelemetryClient 執行個體
取得 TelemetryClient 的實例。
備註
如果您使用 Azure Functions v2+ 或 Azure WebJobs v3+,請參閱 監視 Azure Functions。
備註
針對 ASP.NET Core 和適用於 .NET/.NET Core 的非 HTTP/背景工作角色應用程式,請從相依性插入容器取得 TelemetryClient 的執行個體,如其各自的文件中所述。
private TelemetryClient telemetry = new TelemetryClient();
如果您看到訊息告訴您此方法已過時,請參閱 microsoft/ApplicationInsights-dotnet#1152 以取得詳細資訊。
系統會自動擷取傳入的 HTTP 要求。 您可能想要為應用程式的其他模組建立更多實例 TelemetryClient 。 例如,您的中介軟體類別中可能有一個 TelemetryClient 實例來報告商業邏輯事件。 您可以設定屬性,例如UserId和DeviceId,來識別本機。 此資訊會附加至執行個體傳送的所有事件。
TelemetryClient.Context.User.Id = "...";
TelemetryClient.Context.Device.Id = "...";
備註
TelemetryClient 是線程安全的。
追蹤事件
在 Application Insights 中, 自訂事件 是資料點,您可以在 計量總管 中顯示為彙總計數,並在 診斷搜尋 中顯示為個別出現專案。 (它與 MVC 或其他框架「事件」無關。
在程式碼中插入 TrackEvent 呼叫以計算各種事件。 例如,您可能想要追蹤使用者選擇特定功能的頻率。 或者您可能想知道他們實現某些目標或犯特定類型錯誤的頻率。
舉例來說,在遊戲應用程式中,每當使用者贏得遊戲時,就會傳送事件:
Log Analytics 中的自訂事件
遙測可在 customEvents或使用體驗的資料表 取得。 事件可能來自 trackEvent(..) 或 Click Analytics 自動收集外掛程式。
如果 取樣 正在運作中,則 itemCount 屬性顯示的值會大於 1。 例如, itemCount==10 表示在對 trackEvent()的 的 10 個呼叫中,取樣過程僅傳輸其中一個。 若要取得自訂事件的正確計數,請使用程式碼,例如 customEvents | summarize sum(itemCount)。
備註
itemCount 的最小值為 1;記錄本身代表一個項目。
GetMetric
若要瞭解如何有效地使用 GetMetric() 呼叫來擷取 .NET 和 .NET Core 應用程式的本機預先彙總計量,請參閱 .NET 和 .NET Core 中的自訂計量收集。
TrackMetric
備註
Microsoft.ApplicationInsights.TelemetryClient.TrackMetric 不是傳送指標的慣用方法。 在傳送指標之前,應一律在一段時間內預先彙總。 使用其中一個 GetMetric(..) 多載來取得度量對象,以便存取 SDK 預先彙總功能。
如果您要實作自己的預先彙總邏輯,則可以使用該 TrackMetric() 方法傳送產生的彙總。 如果您的應用程式需要在每次傳送個別的遙測項目,而不需要跨時間彙總,則您可能有事件遙測的使用案例。 請參閱 TelemetryClient.TrackEvent(Microsoft.ApplicationInsights.DataContracts.EventTelemetry)。
Application Insights 可以繪製未附加至特定事件的計量圖表。 例如,您可以定期監視佇列長度。 使用指標時,個別測量值的興趣不如變化和趨勢,因此統計圖表很有用。
若要將計量傳送至 Application Insights,您可以使用 TrackMetric(..) API。 傳送指標有兩種方式:
單一值。 每次在應用程式中執行測量時,都會將對應的值傳送至 Application Insights。
例如,假設您有一個指標來描述容器中的項目數量。 在特定時段內,您先將三件物品放入容器中,然後移除兩件物品。 因此,你會呼叫
TrackMetric兩次。 首先,您將傳遞值3,然後傳遞值-2。 Application Insights 會為您儲存這兩個值。彙總。 當您使用指標時,每個測量值都很少引起人們的興趣。 相反,對特定時間段內發生的事情的總結很重要。 這樣的摘要稱為 聚合。
在上述範例中,該時段的彙總計量總和為
1,且計量值的計數為2。 當您使用彙總方法時,每個時段只會叫用TrackMetric一次,並傳送彙總值。 我們建議使用此方法,因為它可以將較少的資料點傳送至 Application Insights,同時仍會收集所有相關資訊,大幅降低成本和效能額外負荷。
單一值範例
若要傳送單一指標值:
var sample = new MetricTelemetry();
sample.Name = "queueLength";
sample.Sum = 42.3;
telemetryClient.TrackMetric(sample);
Log Analytics 中的自訂計量
遙測可在 customMetrics 的資料表中找到。 每個資料列各代表應用程式中的一個 trackMetric(..) 呼叫。
-
valueSum:測量值的總和。 要獲得平均值,請除以valueCount。 -
valueCount:彙總到這個trackMetric(..)呼叫的測量數目。
備註
valueCount 的最小值為 1;記錄本身代表一個項目。
頁面檢視
在裝置或網頁應用程式中,預設會在載入每個畫面或頁面時傳送頁面檢視遙測。 但您可以變更預設值,以追蹤更多或不同時間的頁面檢視。 例如,在顯示索引標籤或窗格的應用程式中,您可能想要在使用者開啟新窗格時追蹤頁面。
使用者和會話資料會以屬性的形式與頁面檢視一起傳送,因此當有頁面檢視遙測時,使用者和會話圖表會即時運作。
自訂頁面檢視
Log Analytics 中的頁面遙測
在 Log Analytics 中,有兩個資料表會顯示瀏覽器作業的資料:
-
pageViews:包含有關 URL 和頁面標題的資料。 -
browserTimings:包含用戶端效能的相關資料,例如處理傳入資料所花費的時間。
若要查看瀏覽器處理不同頁面所需的時間:
browserTimings
| summarize avg(networkDuration), avg(processingDuration), avg(totalDuration) by name
要發現不同瀏覽器的受歡迎程度:
pageViews
| summarize count() by client_Browser
若要將頁面檢視與 AJAX 呼叫關聯起來,請與依賴項聯結。
pageViews
| join (dependencies) on operation_Id
追蹤請求
伺服器 SDK 用 TrackRequest 來記錄 HTTP 要求。
如果您想要在未執行 Web 服務模組的內容中模擬請求,您也可以自行呼叫它。
建議用來傳送要求遙測的方式是在要求作為作業內容的地方。
作業內容
您可以透過將遙測項目與操作上下文相關聯來將它們相互關聯。 標準請求追蹤模組會針對處理 HTTP 請求時傳送的例外狀況和其他事件執行此操作。 在 Search and Analytics 中,您可以使用其作業識別碼,輕鬆尋找與要求相關聯的任何事件。
當您手動追蹤遙測時,確保遙測相互關聯的最簡單方式是使用此模式:
// Establish an operation context and associated telemetry item:
using (var operation = telemetryClient.StartOperation<RequestTelemetry>("operationName"))
{
    // Telemetry sent in here uses the same operation ID.
    ...
    telemetryClient.TrackTrace(...); // or other Track* calls
    ...

    // Set properties of containing telemetry item--for example:
    operation.Telemetry.ResponseCode = "200";

    // Optional: explicitly send telemetry item:
    telemetryClient.StopOperation(operation);

} // When operation is disposed, telemetry item is sent.
如需相互關聯的詳細資訊,請參閱 Application Insights 中的遙測相互關聯。
設定作業內容的同時,StartOperation 會建立您指定類型的遙測項目。 當您結束操作或明確呼叫 StopOperation 時,它會傳送遙測項目。 如果您將 RequestTelemetry 用作遙測類型,其持續時間會設為從開始到停止之間的時間間隔。
在作業範圍內報告的遙測項目將成為該作業的子項。 作業上下文可以嵌套。
在 「搜尋」中,作業前後關聯可用來建立 「相關項目」 清單。

如需自訂作業追蹤的詳細資訊,請參閱 使用 Application Insights .NET SDK 追蹤自訂作業。
Log Analytics 中的請求
在 Application Insights Analytics 中,要求會顯示在資料表 requests 中。
如果 取樣 正在運作中,則 itemCount 屬性顯示的值會大於 1。 例如, itemCount==10 表示在對 trackRequest()的 的 10 個呼叫中,取樣過程僅傳輸其中一個。 若要取得依請求名稱區隔的正確請求計數和平均持續時間,請使用如下程式碼:
requests
| summarize count = sum(itemCount), avgduration = avg(duration) by name
TrackException
將例外狀況傳送至 Application Insights:
報告包含堆疊追蹤。
SDK 會自動攔截許多例外狀況,因此您不必一律明確呼叫 TrackException 。
Log Analytics 中的例外狀況
在 Application Insights Analytics 中,例外狀況會顯示在資料表中 exceptions 。
如果 取樣 正在運作中,則 itemCount 屬性顯示的值會大於 1。 例如, itemCount==10 表示在對 trackException()的 的 10 個呼叫中,取樣過程僅傳輸其中一個。 若要取得依例外狀況類型分割的正確例外狀況計數,請使用程式碼,例如:
exceptions
| summarize sum(itemCount) by type
大多數重要的堆疊資訊已經提取到單獨的變數中,但您可以拆解 details 結構以獲得更多變數。 因為此結構是動態的,所以您應該將結果轉換成您預期的類型。 例如:
exceptions
| extend method2 = tostring(details[0].parsedStack[1].method)
若要將例外狀況與其相關要求相關聯起,請使用聯結:
exceptions
| join (requests) on operation_Id
TrackTrace
使用 TrackTrace 傳送「麵包屑路徑」到 Application Insights,以協助診斷問題。 您可以傳送診斷資料區塊,並在 診斷搜尋中檢查它們。
在 .NET 記錄配接器中,使用此 API 將協力廠商記錄傳送至入口網站。
telemetry.TrackTrace(message, SeverityLevel.Warning, properties);
記錄診斷事件,例如進入或離開某個方法。
| 參數 | Description |
|---|---|
message |
診斷資料。 可以比名字長得多。 |
properties |
字串與字串的對應。 更多資料可用來篩選入口網站中的 例外狀況 。 預設為空白。 |
severityLevel |
支援的值: SeverityLevel.ts。 |
您可以搜尋訊息內容,但與屬性值不同,您無法篩選它。
的 message 大小限制遠高於屬性的限制。 的 TrackTrace 優點是您可以在訊息中放置相對較長的資料。 例如,您可以在那裡對 POST 資料進行編碼。
您也可以在訊息中新增嚴重性層級。 而且,就像其他遙測一樣,您可以新增屬性值,以協助您篩選或搜尋不同的追蹤集。 例如:
var telemetry = new Microsoft.ApplicationInsights.TelemetryClient();
telemetry.TrackTrace("Slow database response",
                SeverityLevel.Warning,
                new Dictionary<string,string> { {"database", db.ID} });
在 搜尋中,您可以輕鬆地篩選出與特定資料庫相關的特定嚴重性層級的所有訊息。
Log Analytics 中的痕跡
在 Application Insights 分析中,對 TrackTrace 的呼叫會顯示在 traces 資料表中。
如果 取樣 正在運作中,則 itemCount 屬性顯示的值會大於 1。 例如, itemCount==10 表示在對 trackTrace()的 的 10 個呼叫中,取樣過程僅傳輸其中一個。 若要取得正確的追蹤呼叫計數,請使用程式碼,例如 traces | summarize sum(itemCount)。
TrackDependency
使用呼叫 TrackDependency 來追蹤呼叫外部程式碼片段的回應時間和成功率。 結果會顯示在入口網站的相依性圖表中。 無論在進行相依性呼叫時,都必須新增下列程式碼片段。
備註
針對 .NET 和 .NET Core,您可以替代地使用擴充方法 TelemetryClient.StartOperation 來填入 DependencyTelemetry 所需的相互關聯屬性,以及其他一些屬性,例如開始時間和持續時間,因此您不必像下列範例中那樣建立自訂計時器。 如需詳細資訊,請參閱 使用 Application Insights .NET SDK 追蹤自訂作業中的傳出相依性追蹤一節。
var success = false;
var startTime = DateTime.UtcNow;
var timer = System.Diagnostics.Stopwatch.StartNew();
try
{
    success = dependency.Call();
}
catch(Exception ex)
{
    success = false;
    telemetry.TrackException(ex);
    throw new Exception("Operation went wrong", ex);
}
finally
{
    timer.Stop();
    telemetry.TrackDependency("DependencyType", "myDependency", "myCall", startTime, timer.Elapsed, success);
}
請記住,伺服器 SDK 包含一個 相依性模組 ,可自動探索和追蹤某些相依性呼叫,例如資料庫和 REST API。 您必須在伺服器上安裝代理程式才能使模組正常運作。
如果您想要追蹤自動追蹤系統未能捕捉到的呼叫,請使用此功能。
若要關閉 C# 中的標準相依性追蹤模組,請編輯 ApplicationInsights.config 並刪除對 的參考 DependencyCollector.DependencyTrackingTelemetryModule。
Log Analytics 中的相依性
在 Application Insights 分析中,trackDependency 呼叫會顯示在 dependencies 資料表中。
如果 取樣 正在運作中,則屬性 itemCount 會顯示大於 1 的值。 例如, itemCount==10 表示在對 trackDependency()的 的 10 個呼叫中,取樣過程僅傳輸其中一個。 若要取得依目標元件分割的正確相依性計數,請使用如下程式碼:
dependencies
| summarize sum(itemCount) by target
若要將相依性與其相關要求產生關聯,請使用聯結:
dependencies
| join (requests) on operation_Id
清除資料
通常,SDK 會以固定間隔 (通常為 30 秒) 傳送資料,或每當緩衝區已滿 (通常是 500 個專案) 時,都會傳送資料。 在某些情況下,您可能想要排清緩衝區。 例如,如果您在即將關閉的應用程式中使用 SDK。
當您使用 Flush()時,我們建議您遵循以下 模式:
telemetry.Flush();
// Allow some time for flushing before shutdown.
System.Threading.Thread.Sleep(5000);
當您使用 FlushAsync()時,我們建議您遵循以下模式:
await telemetryClient.FlushAsync()
// No need to sleep
建議您一律在應用程式關閉期間排清,以確保遙測不會遺失。
備註
檢閱自動排清設定:在檔案中web.config可能會導致使用 Application Insights 檢測的 .NET 應用程式效能降低。 啟用自動排清後,每次叫用 System.Diagnostics.Trace.Trace* 方法都會導致個別遙測項目作為個別不同的 Web 要求傳送至擷取服務。 這可能會導致 Web 伺服器上的網路和儲存空間耗盡。 為了增強效能,建議停用自動排清,並利用 ServerTelemetryChannel,專為更有效的遙測資料傳輸而設計。
此函式對於 伺服器遙測通道是非同步的。
已驗證的使用者
在 Web 應用程式中,使用者預設 會由 Cookie 識別 。 如果用戶從不同的電腦或瀏覽器存取您的應用程式,或刪除 Cookie,可能會被多次計算。
如果使用者登入您的應用程式,您可以在瀏覽器程式碼中設定經過驗證的使用者 ID,以取得更準確的計數。 不需要使用使用者的實際登入名稱。 它只需要是該使用者唯一的 ID。 它不得包含空格或任何字元 ,;=|。
使用者 ID 也會在會話 Cookie 中被設定,並傳送至伺服器。 如果已安裝伺服器 SDK,則會將已鑑別的使用者 ID 作為用戶端及伺服器遙測環境定義內容的一部分傳送。 然後,您可以對其進行過濾和搜索。
如果您的應用程式將使用者分組到帳戶中,您也可以傳遞帳戶的識別碼。 同樣的字元限制也適用。
在 Metrics Explorer 中,您可以建立計算 使用者、已驗證和 使用者帳戶的圖表。
您也可以 搜尋 具有特定使用者名稱和帳戶的客戶資料點。
備註
.NET Core SDK 中 ApplicationInsightsServiceOptions 類別中的 EnableAuthenticationTrackingJavaScript 屬性 可簡化將使用者名稱插入為 Application Insights JavaScript SDK 所傳送之每個追蹤的驗證識別碼所需的 JavaScript 設定。
當此屬性設定為 true時,ASP.NET Core 中使用者的使用者名稱會與 用戶端遙測一起列印。 因此,不再需要手動新增 appInsights.setAuthenticatedUserContext ,因為它已由 SDK for ASP.NET Core 插入。 驗證識別碼也會傳送至伺服器,其中 .NET Core 中的 SDK 會識別並將其用於任何伺服器端遙測,如 JavaScript API 參考中所述。
對於與 ASP.NET Core MVC 不同運作方式的 JavaScript 應用程式,例如 SPA Web 應用程式,您仍然需要手動新增 appInsights.setAuthenticatedUserContext 。
使用屬性篩選、搜尋及區隔資料
您可以將屬性和測量附加至事件、計量、頁面檢視、例外狀況和其他遙測資料。
屬性 是字串值,可用來篩選使用量報告中的遙測。 舉例來說,如果您的應用程式提供數個遊戲,您可以將遊戲名稱附加至每個事件,以便查看哪些遊戲更受歡迎。
琴弦長度有 8,192 個限制。 如果您想要傳送大量資料,請使用 的 TrackTrace訊息參數。
度量是 可以以圖形方式呈現的數值。 例如,您可能想查看玩家獲得的分數是否逐漸增加。 圖表可以依隨事件傳送的屬性進行區隔,以便您可以針對不同的遊戲取得個別或堆疊的圖表。
量度值應大於或等於 0 才能正確顯示。
您可以使用的 屬性、屬性值和指標數量有一些限制 。
// Set up some properties and metrics:
var properties = new Dictionary <string, string>
    {{"game", currentGame.Name}, {"difficulty", currentGame.Difficulty}};
var metrics = new Dictionary <string, double>
    {{"Score", currentGame.Score}, {"Opponents", currentGame.OpponentCount}};

// Send the event:
telemetry.TrackEvent("WinGame", properties, metrics);
這很重要
請確定您不會在屬性中記錄個人識別資訊。
設定屬性和指標的替代方式
如果更方便,您可以在單獨的物件中收集事件的參數:
var event = new EventTelemetry();

event.Name = "WinGame";
event.Metrics["processingTime"] = stopwatch.Elapsed.TotalMilliseconds;
event.Properties["game"] = currentGame.Name;
event.Properties["difficulty"] = currentGame.Difficulty;
event.Metrics["Score"] = currentGame.Score;
event.Metrics["Opponents"] = currentGame.Opponents.Length;

telemetry.TrackEvent(event);
警告
請勿重複使用相同的遙測專案實例 (event 在此範例中) 來呼叫 Track*() 多次。 此做法可能會導致遙測資料以不正確的設定被傳送。
Log Analytics 中的自訂度量和屬性
在 Log Analytics 中,自訂計量和屬性會顯示在每個遙測記錄的 customMeasurements 和 customDimensions 屬性中。
例如,如果您將名為 “game” 的屬性新增至要求遙測,則此查詢會計算 “game” 不同值的出現次數,並顯示自訂計量 “score” 的平均值:
requests
| summarize sum(itemCount), avg(todouble(customMeasurements.score)) by tostring(customDimensions.game)
請注意:
- 當您從 或
customDimensionscustomMeasurementsJSON 擷取值時,它具有動態類型,因此您必須轉換它tostring或todouble。 - 為了考慮取樣的可能性,請使用
sum(itemCount)而非count()。
計時事件
有時您想要繪製執行動作所需的時間圖表。 例如,您可能想知道使用者在遊戲中考慮選擇需要多長時間。 若要取得此資訊,請使用測量參數。
var stopwatch = System.Diagnostics.Stopwatch.StartNew();

// ... perform the timed action ...

stopwatch.Stop();

var metrics = new Dictionary <string, double>
    {{"processingTime", stopwatch.Elapsed.TotalMilliseconds}};

// Set up some properties:
var properties = new Dictionary <string, string>
    {{"signalSource", currentSignalSource.Name}};

// Send the event:
telemetry.TrackEvent("SignalProcessed", properties, metrics);
自訂遙測的預設屬性
如果您想要為您撰寫的某些自訂事件設定預設屬性值,請在TelemetryClient實例中設定它們。 它們會附加到從該用戶端傳送的每個遙測項目上。
using Microsoft.ApplicationInsights.DataContracts;

var gameTelemetry = new TelemetryClient();
gameTelemetry.Context.GlobalProperties["Game"] = currentGame.Name;
// Now all telemetry is automatically sent with the context property:
gameTelemetry.TrackEvent("WinGame");
個別遙測呼叫可以覆寫其屬性字典中的預設值。
若要將屬性新增至所有遙測,包括來自標準收集模組的資料,請 實作 ITelemetryInitializer。
停用遙測
若要 動態地停止與啟動 遙測的收集和傳輸:
using  Microsoft.ApplicationInsights.Extensibility;

TelemetryConfiguration.Active.DisableTelemetry = true;
開發者模式
偵錯期間,讓您的遙測透過管線加速很有用,如此您就可以立即看到結果。 您也會收到其他訊息,以協助您追蹤遙測的任何問題。 在生產環境中將其關閉,因為它可能會降低您的應用程式速度。
設定所選自訂遙測數據的工具金鑰
var telemetry = new TelemetryClient();
telemetry.InstrumentationKey = "---my key---";
// ...
動態連接字串
若要避免混淆來自開發、測試和生產環境的遙測,您可以 建立個別的 Application Insights 資源 ,並視環境變更其金鑰。
您可以在程式碼中設定儀器金鑰,而不是從組態檔中取得。 在初始化方法中設定金鑰,例如 global.aspx.cs 在 ASP.NET 服務中:
protected void Application_Start()
{
    Microsoft.ApplicationInsights.Extensibility.
    TelemetryConfiguration.Active.InstrumentationKey =
        // - for example -
        WebConfigurationManager.Settings["ikey"];
    ...
}
遙測上下文
TelemetryClient 具有 Context 屬性,其中包含與所有遙測資料一起傳送的值。 它們通常由標準遙測模組設定,但您也可以自行設定。 例如:
telemetry.Context.Operation.Name = "MyOperationName";
如果您自行設定其中任何一個值,請考慮從 ApplicationInsights.config 中刪除相關行,以免您的值和標準值混淆。
- 元件:應用程式及其版本。
- 裝置:應用程式執行之裝置的相關資料。 在 Web 應用程式中,它是傳送遙測的伺服器或用戶端裝置。
- InstrumentationKey:Azure 中遙測顯示位置的 Application Insights 資源。 它通常是從 ApplicationInsights.config讀取的。
- 位置:裝置的地理位置。
-
操作:在 Web 應用程式中,目前的 HTTP 請求。 在其他應用程式類型中,您可以設定此值,將事件分組在一起。
- 識別碼:生成一個用於關聯不同事件的值,以便在診斷搜尋中查看任何事件時,可以找到相關項目。
- 名稱:識別碼,通常是 HTTP 請求的 URL。
- SyntheticSource:如果不是空值或空白,則表示請求來源已識別為機器人或 Web 測試的字串。 預設情況下,它會從度量探索器的計算中排除。
- 會話:使用者的會話。 ID 會設定為產生的值,當使用者有一段時間沒有作用中時,該值會變更。
- 使用者:使用者資訊。
Limits
每個應用程式(也就是每個連接字串)的度量與事件數量有一定限制。 限制取決於您選擇的定價方案。
| Resource | 預設限制 | 上限 | 註釋 |
|---|---|---|---|
| 每日資料總量 | 100 GB | 請連絡支援人員。 | 您可以設定上限以減少資料。 如果您需要更多資料,可以從入口網站將限制增加到最多 1,000 GB。 若容量大於 1000 GB,請傳送電子郵件給 AIDataCap@microsoft.com。 |
| Throttling | 32,000 個事件/秒 | 請連絡支援人員。 | 此限制會測量超過一分鐘。 |
| 數據保留日誌 | 30 到 730 天 | 730 天 | 此資源適用於記錄。 |
| 資料保留計量 | 90 天 | 90 天 | 此資源適用於計量瀏覽器。 |
| 可用性多步驟測試詳述的結果保留期 | 90 天 | 90 天 | 此資源會提供每個步驟的詳細結果。 |
| 遙測項目大小上限 | 64 KB | 64 KB | |
| 每個批次的遙測項目數上限 | 64,000 | 64,000 | |
| 屬性和度量名稱長度 | 150 | 150 | 請參閱類型結構描述。 |
| 屬性值字串長度 | 8,192 | 8,192 | 請參閱類型結構描述。 |
| 追蹤和例外狀況訊息長度 | 32,768 | 32,768 | 請參閱類型結構描述。 |
| 每個 Application Insights 資源的可用性測試計數 | 100 | 100 | |
| 每個資源群組的可用性測試計數 | 800 | 800 | 請參閱 Azure Resource Manager |
| 可用性測試中每個測試的重新導向數上限 | 10 | 10 | |
| 可用性測試的最低測試頻率 | 300 秒鐘 | 自訂測試頻率或低於 5 分鐘的頻率,需要自訂 TrackAvailability 實作。 | |
| .NET Profiler 和 快照偵錯器 數據保留 | 兩週 | 請連絡支援人員。 資料保留上限為六個月。 | |
| 每天傳送的 .NET Profiler 數據 | 沒有限制 | 沒有限制。 | |
| 每天傳送的快照偵錯工具資料 | 每個受監視應用程式每天 30 個快照 | 沒有限制。 | 可透過設定修改每個應用程式所收集的快照集數目。 |
如需有關定價和配額的詳細資訊,請參閱 Application Insights 帳單。
若要避免達到資料速率限制,請使用 取樣。
若要判斷資料的保留時間,請參閱 資料保留和隱私權。
範例應用程式
.NET Core 主控台應用程式:如果您使用以 .NET Core (2.0 或更新版本) 或 .NET Framework (4.7.2 或更新版本) 撰寫的主控台應用程式,請使用此範例。
ASP.NET 使用 HostedServices 的核心背景工作:如果您位於 ASP.NET Core 中,並根據 官方指引建立背景工作,請使用此範例。
.NET Core 工作服務:如果您有一個依據官方指引建立的.NET工作服務應用程式,請使用此範例。
故障排除
測試應用程式主機與擷取服務之間的連線
應用程式深入剖析 SDK 和代理程式會傳送遙測,以擷取為 REST 呼叫擷取到我們擷取的端點。 您可以使用來自 PowerShell 或 curl 命令的原始 REST 用戶端,測試從 Web 伺服器或應用程式主機電腦到擷取服務端點的連線。 請參閱針對 Azure 監視器 Application Insights 中遺失的應用程式遙測進行疑難排解。
開放原始碼 SDK
發行說明
服務更新 也會摘要說明 Application Insights 的主要改善。
後續步驟
- 驗證您正在執行支援的 Application Insights SDK 版本 。
- 如需 Application Insights 類型和資料模型,請參閱資料模型。
- 查看 System.Diagnostics.Activity 使用者指南以了解如何使遙測相互關聯。
- 若要檢閱常見問題 (FAQ),請參閱: