設定適用於 .NET 的 Application Insights Profiler
啟用適用於 .NET 的 Application Insights Profiler 之後,您可以.
- 啟動新的分析工作階段。
- 設定 .NET Profiler 觸發程式。
- 檢視最近的分析工作階段。
若要開啟 [.NET Profiler 設定] 窗格,請選取 Application Insights 頁面上左窗格的 [效能 ]。
![顯示開啟 [效能] 窗格連結的螢幕擷取畫面。](media/profiler-settings/performance-blade.png#lightbox)
您可以透過兩種方法檢視整個 Azure 資源的 .NET Profiler 追蹤:
[分析工具] 按鈕:
選取 [分析工具]。
![顯示 [效能] 窗格上 [Profiler] 按鈕的螢幕擷取畫面。](media/profiler-overview/profiler-button-inline.png)
作業:
從 [作業名稱] 清單選取作業。 根據預設,[整體] 為醒目提示狀態。
選取 [分析工具追蹤]。
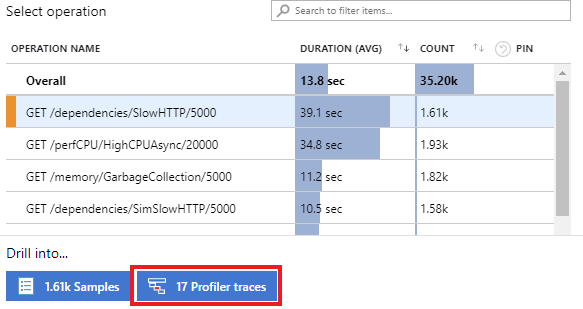
從左側清單選取其中一個要求。
選取 [設定 Profiler]。
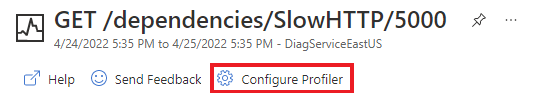
![顯示 [效能] 窗格上 [Profiler] 按鈕的螢幕擷取畫面。](media/profiler-settings/profiler-button.png#lightbox)


在 [分析工具] 頁面中,您可以設定及檢視 .NET Profiler。 適用於 .NET 的 Application Insights Profiler 頁面具有下列功能。

| 功能 | 描述 |
|---|---|
| 立即分析 | 開始為所有連結至此 Application Insights 執行個體的應用程式分析工作階段。 |
| 觸發程序 | 可讓您設定導致 Profiler 執行的觸發程式。 |
| 最近的分析工作階段 | 顯示過去分析工作階段的相關資訊,您可以使用頁面頂端的篩選進行排序。 |
選取 [立即分析],啟動所需的分析工作階段。 若您選取此連結,傳送資料至此 Application Insights 執行個體的所有 Profiler 代理程式會開始擷取設定檔。 在 5 到 10 分鐘之後,設定檔階段就會顯示在下列清單中。
若要手動觸發 Profiler 工作階段,您的角色至少需要 Application Insights 元件的寫入存取權。 在大部分案例中,您會自動取得寫入存取。 如果您遇到問題,您必須新增訂用帳戶範圍角色 Application Insights 元件參與者。 如需詳細資訊,請參閱 Azure 監視器中的角色、權限和安全性。
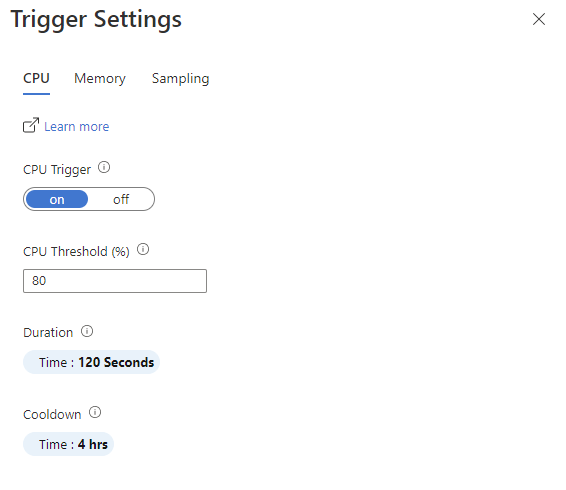
選取 [觸發程序] 開啟 [觸發程序設定] 窗格,其中有 [CPU]、[記憶體] 和 [取樣] 觸發程序索引標籤。
您可以設定觸發程序在 CPU 或記憶體使用量百分比達到您設定的層級時啟動分析。
| 設定 | 描述 |
|---|---|
| 開啟/關閉按鈕 | 開啟:啟動 Profiler。 關閉:不啟動 Profiler。 |
| 記憶體閾值 | 當使用的記憶體達到這個百分比時,啟動 Profiler。 |
| 期間 | 設定 Profiler 在觸發後執行的時間長度。 預設值為 30 秒。 |
| 冷卻 | 設定 Profiler 在觸發後,再次檢查記憶體或 CPU 使用量之前等待的時間長度。 |
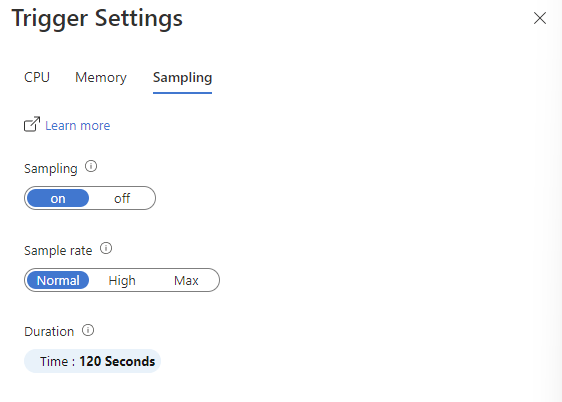
與 CPU 或記憶體觸發程序不同,事件不會觸發取樣觸發程序。 相反地,系統會隨機觸發取樣觸發程序,以便取得應用程式效能真實的隨機樣本。 您可以:
- 關閉此觸發程序以停用隨機取樣。
- 設定分析的發生頻率,以及分析工作階段的持續時間。
| 設定 | 描述 |
|---|---|
| 開啟/關閉按鈕 | 開啟:啟動 Profiler。 關閉:不啟動 Profiler。 |
| 採樣速率 | Profiler 可以發生的速率。
我們建議生產環境使用標準設定。 |
| 期間 | 設定 Profiler 在觸發後執行的時間長度。 預設值為 30 秒。 |
Profiler 頁面的此區段顯示最近的分析工作階段資訊。 分析工作階段代表 Profiler 代理程式在分析其中一部裝載您應用程式的機器時所花費的時間。 選取其中一個資料列,從工作階段開啟設定檔。 針對每個工作階段,我們會顯示下列設定。
| 設定 | 描述 |
|---|---|
| 觸發者 | 工作階段的啟動方式,可以是藉由觸發程序、立即分析功能或預設的取樣功能。 |
| 應用程式名稱 | 已分析的應用程式名稱。 |
| 電腦執行個體 | 執行 Profiler 代理程式的機器名稱。 |
| 時間戳記 | 擷取設定檔時的時間。 |
| CPU% | 分析工具執行時所使用的CPU百分比。 |
| 記憶體 % | Profiler 執行時所使用的記憶體百分比。 |